1. Africa in Numbers
Learning Objectives
After reading this chapter, you should be able to:
- State the book’s growth identity in words and as an equation, and say which of its three terms demographics hands to Africa, which term the “growth without jobs” argument is about, and which term the structural-transformation literature is about.
- Describe the scale of Africa in population and in output, distinguish aggregate from per capita measures, and explain why the two point in opposite directions on this continent more sharply than anywhere else.
- Use the book’s three scopes correctly: the 54 UN member states, the Sub-Saharan subset, and North Africa, and say which one any given statistic belongs to.
- Evaluate the statistical inputs behind those numbers, including census vintage, GDP rebasing, labour-force-survey coverage and the World Bank’s Statistical Performance Indicators, and explain why the alternatives (nightlights, consumption surveys) are correctives rather than replacements.
- Read a country card: locate the identity, scale, balance-sheet and data-quality fields, and judge how much weight the card’s own numbers will bear.
- Explain why the identity is accounting rather than theory, state the assumption the book’s bet rests on, that the marginal worker still matters, and say what each of the three terms becomes in a world where growth is carried by compute rather than by labour.
Prior work: the measurement machinery here, and the nightlights material in particular, is developed at length in the companion volume, The New Regional Economics, chapters 13 and 14 (Wilse-Samson, 2026). This chapter cites it rather than repeating it.
Between 2024 and 2054 the world will add about 1.65 billion people, and Africa will supply 1.10 billion of them (WPP, 2024). Two of every three people joining the human race over the next three decades will be born in one of the 54 countries this book covers. Nothing else about the African economy is as well established as that. It is the one fact that does not depend on a finance ministry’s forecast, a rating agency’s model, or a statistical office’s ability to run a census, because it is largely already determined: most of the people who will be working in Africa in 2054 have already been born.
That is the bet, and it is worth being precise about what it is a bet on. It is not a bet that Africa will be rich, or even that Africa will grow quickly. It is a bet that the marginal worker of the next fifty years will be African, and that anyone who wants to understand the global economy after 2040 therefore has to understand this one first. Whether those workers end up in factories, in fields, or in the informal service economies of Lagos and Kinshasa is the open question the rest of the book is about.
The distinction matters because population growth is not, by itself, economic growth. What separates the cases is whether those people find work, and whether that work is productive. The literature has a habit of collapsing all of this into a single mood, either Afro-optimism or Afro-pessimism, and then arguing about the mood. This book instead uses an accounting identity that forces the three things apart and makes each of them a measurable quantity. The identity is not a theory. It is arithmetic, and arithmetic is a good place to start an argument.
One Identity, Three Terms
Let \(Y\) be output, \(E\) be the number of people employed, and \(L\) be the working-age population. Then, trivially,
\[Y = \frac{Y}{E} \times \frac{E}{L} \times L\]
Output equals output per worker, times the share of the working-age population that is employed, times the working-age population itself. Take growth rates of both sides and the products become sums, at least to a first approximation:
\[g_Y \approx g_{Y/E} + g_{E/L} + g_L\]
In words: GDP growth is approximately the growth of output per worker, plus the growth of the employment-to-working-age ratio, plus the growth of the working-age population. All three are growth rates. This is worth insisting on because the identity is routinely stated with a level where a growth rate belongs, and then it does not add up. A share that rises from 60 to 62 percent has grown by about 3.3 percent, not by 2. Getting this wrong turns a decomposition into a decoration.
The book numbers the terms in the order they will be encountered, which is not the order the equation writes them.
Term one is \(g_L\), the growth of the working-age population. This is what demographics hands to Africa. It is the only term that can be taken as approximately given, because the people who will be aged 15 to 64 in 2050 are already alive, and the United Nations projects them under assumptions that are conservative about fertility and mortality alike (WPP, 2024). It is also the only term this chapter quotes at the country level, for reasons set out below. Across the 48 country cards outside the African Union’s Northern region, the working-age population grew at a median of 2.9 percent a year over 2014 to 2024, and the middle of the distribution runs from roughly 2.5 to 3.5 percent: 25 of those 48 cards sit inside that band, 13 below it and 10 above. The extremes are instructive. Uganda ran at 4.2 percent and Chad at 4.1; Mauritius ran at minus 0.2 percent, which is to say its working-age population shrank. South Africa, the continent’s largest economy, ran at 1.6 percent, a little over half the Sub-Saharan median.
Term two is \(g_{E/L}\), the growth of the employment-to-working-age ratio. This is where the “growth without jobs” argument lives. Opalo (2026a) records more than twenty-five years of successive expansion and argues that many countries will still struggle to turn growth of that kind into reliable jobs and human development. The adding-up series for this term is the International Labour Organization’s modelled count of everyone at work, aged 15 and over, divided by the United Nations’ working-age population, aged 15 to 64, and it is important to say in advance that this series will understate the problem, because subsistence agriculture and informal trade count as employment. A woman selling tomatoes at the roadside in Kaduna is employed by the ILO’s definition and is not what a finance minister means by a job. The thesis is therefore carried by overlays rather than by the headline: the wage-employment share, the non-agricultural employment share, and, where a labour-force survey exists, hours and youth not in employment, education or training. Chapter 10 reads those overlays country by country.
Term three is \(g_{Y/E}\), the growth of output per worker. This is the structural-transformation term, and it is the one the development literature has spent forty years on. It splits in two ways that matter. Productivity can rise within a sector, because firms in that sector get better, or between sectors, because workers move from lower-productivity activities to higher-productivity ones. The African puzzle, in the sharpest recent statement of it, is that the two halves do not meet: large firms raise productivity without adding employment, and small firms add employment without raising productivity (Diao, Ellis, McMillan and Rodrik, 2021). Chapters 6, 9 and 10 split this term within and between sectors using the Groningen Growth and Development Centre’s transformation database, following McMillan, Rodrik and Verduzco-Gallo (2014).
A word about what this chapter will and will not show. Term one comes straight from the UN’s population series and sits on all 54 country cards, so it can be quoted here country by country. Terms two and three sit on 53 of the 54 cards as well, from the ILO’s modelled employment series, and Chapter 10 is where they are read country by country, beside the overlays that make them meaningful. This chapter does not present a per-country decomposition. A decomposition whose middle term is quoted without the survey coverage behind it would be exactly the kind of false precision the rest of this chapter is about.
One property of the construction limits what the book’s own consistency check can prove, and it is worth stating once. Terms two and three share the same modelled employment count: it sits under output in the third term and over the working-age population in the second. Add the three terms and it cancels, leaving the growth of the ILO’s output series. So when implied and observed growth agree, as they do within a point and a half on 50 of the 52 cards where both exist, the agreement shows that two output series and a log approximation line up. It says nothing about whether the employment count is right. An error there moves term two one way and term three the other by the same amount and leaves the sum untouched, which is why the overlays, not the adding-up, carry the book’s claims about jobs.
The Assumption Underneath the Identity
Everything in this book that is not arithmetic rests on one assumption, and it is better to state it on page five than to let a reader find it on page four hundred. The assumption is that the marginal worker still matters: that a country with more people of working age, employed at a higher rate and made more productive, will produce more, and that the world will pay for what they produce. For the whole of recorded economic history that has been true. The bet this book makes on Africa is a bet that it remains true for the rest of this century. It may not.
Accounting is not a theory
The identity is an identity. It holds by construction in every world, including one in which nobody works, because a ratio with a zero in it is still a ratio. What the identity does not do is tell you which term carries growth. The literature this book draws on, from Lewis through the East Asian recipe to the growth-diagnostics tradition, assumes that the answer runs through the middle: people leave the farm, take jobs in firms, and the firms get better at what they do, so that terms two and three rise together and term one supplies the raw material for both. That is a theory, and a good one, with sixty years of evidence behind it. But the evidence comes from a period in which production needed hands. Take the hands out and the theory goes; the identity stays.
Now consider a world, not imaginary, in which the frontier of production is a stock of machines that reason and machines that move: compute in data centres, models running on it, and increasingly robots directed by them. Output in that world is a function of installed capital and energy, and labour enters as a complement at best (Acemoglu and Restrepo, 2019). Nobody knows how far or how fast that world arrives. Serious estimates of its near-term effect on output are modest, a few percent of GDP over a decade at the frontier, on the grounds that most tasks are not yet automatable at a cost worth paying (Acemoglu, 2025). Serious estimates of its long-run effect are not modest at all. A book about the next seventy-five years has no business choosing between them, and this one does not. It states what each term becomes if the second view is right.
What each term becomes
Term one turns over. In the labour-abundant world a working-age population growing at 3 percent a year is an endowment: the workers are the growth. In the labour-redundant world the same cohort is a liability to be fed, schooled and kept from the streets, and the countries that have it are the countries the century is hardest on. Nothing in the demographics changes. What changes is the sign of the coefficient the world puts on it.
Term two stops being a measurement problem and becomes the political variable. Chapter 10 treats the employment ratio as something to measure carefully, because surveys are scarce and modelled series flatter. In a world where the frontier does not need workers, the ratio is not measured, it is chosen: a society decides how much of its working-age population will be employed, at what, and paid from what. The “growth without jobs” critique, which this book takes seriously as a description of Africa’s last quarter-century, becomes in that world a description of everywhere. It stops being Africa’s failure and becomes the global equilibrium, and the interesting question shifts from why employment did not follow growth to what employment is for when output no longer needs it.
Term three is imported rather than built. The structural-transformation literature is about how a country raises output per worker by moving people between sectors and by making firms better. In the labour-redundant world output per worker at the frontier rises without limit, because the denominator is shrinking towards the people who own or tend the machines. For everyone else, productivity is something bought: a licence to a model, a lease on compute, a robot on a container ship. The question of whether a country can build its productivity becomes the question of on what terms it can rent it.
What the ladder looks like without rungs
The Studwell recipe that Chapter 9 tests, and the case for Africa that Chapter 4 stages, both run through export manufacturing, because that is the stage at which unskilled labour has historically been paid for. Rodrik (2016) showed that the ladder had already shortened before the current wave of automation: manufacturing employment peaks earlier and lower in today’s late industrializers than it did in Korea or in Britain, and the great African puzzle is that large firms raise productivity without adding employment while small firms add employment without raising productivity (Diao, Ellis, McMillan and Rodrik, 2021). The labour-redundant world removes the remaining rungs, and it removes the services rungs next. The business-process model that Nairobi, Accra and Lagos built over the last decade, in which a graduate answers a call or labels an image for a firm on another continent, is the first casualty of a machine that answers calls and labels images. The counter-case is real and it is uncomfortable. Because so much of African employment is informal and agricultural, the continent has the smallest share of its jobs in occupations the frontier can currently do (Gmyrek, Berg and Bescond, 2023). Informality is protective for a decade, and then it is a trap, because the protection consists of being too poor to be worth automating.
What Africa has in that world
If intelligence becomes capital, then income per head depends on who owns the capital and on the terms of trade for what you have (Korinek and Stiglitz, 2021). This is the balance-sheet lens that Chapters 21 and 32 develop for debt, turned on a different asset. Africa’s holdings in the labour-redundant world are four. It has people, whose value is the open question. It has land. It has sun, in a belt from the Sahara to the Kalahari, at a time when the binding constraint on compute is turning out to be electricity rather than chips, which is why Chapter 14 is an energy chapter and not a climate chapter. And it has the minerals the machines are made of: the cobalt, copper and manganese of Chapter 13, whose chokepoint has so far produced ore and not income. A continent that exports electrons and copper to the world’s data centres is a plausible growth economy of the labour-redundant century. It is not the growth economy this book’s title promises, and the difference between the two is who owns the data centre.
How to read the rest of this book
The honest position is that the book’s bet is conditional, and the identity is what makes the condition precise. In the labour-abundant world the identity is a lever, and Africa holds the long end of it: term one is given, and terms two and three are the work. In the labour-redundant world the identity is a distribution problem, and the questions become who owns the machines, what the people do, and what the rest of the world will pay for sun, land and ore. The same three terms describe both worlds. That is the reason to keep them. A reader who finishes this book should be able to say which term she is betting on, and should notice that the whole of Part III, the sector chapters, is a list of places where the two worlds give different answers. Chapters 35 and 36 carry the labour-redundant world as a scenario axis, with the compute-inputs case as its upside branch, and Chapter 10 has to answer the question that only that world asks: what employment is for. Until then the book proceeds on the assumption it began with, because that is the assumption under which anything can be measured, and it says so each time the assumption is doing work.
The Big Picture
Population (2024): 1.515 billion (WPP, 2024)
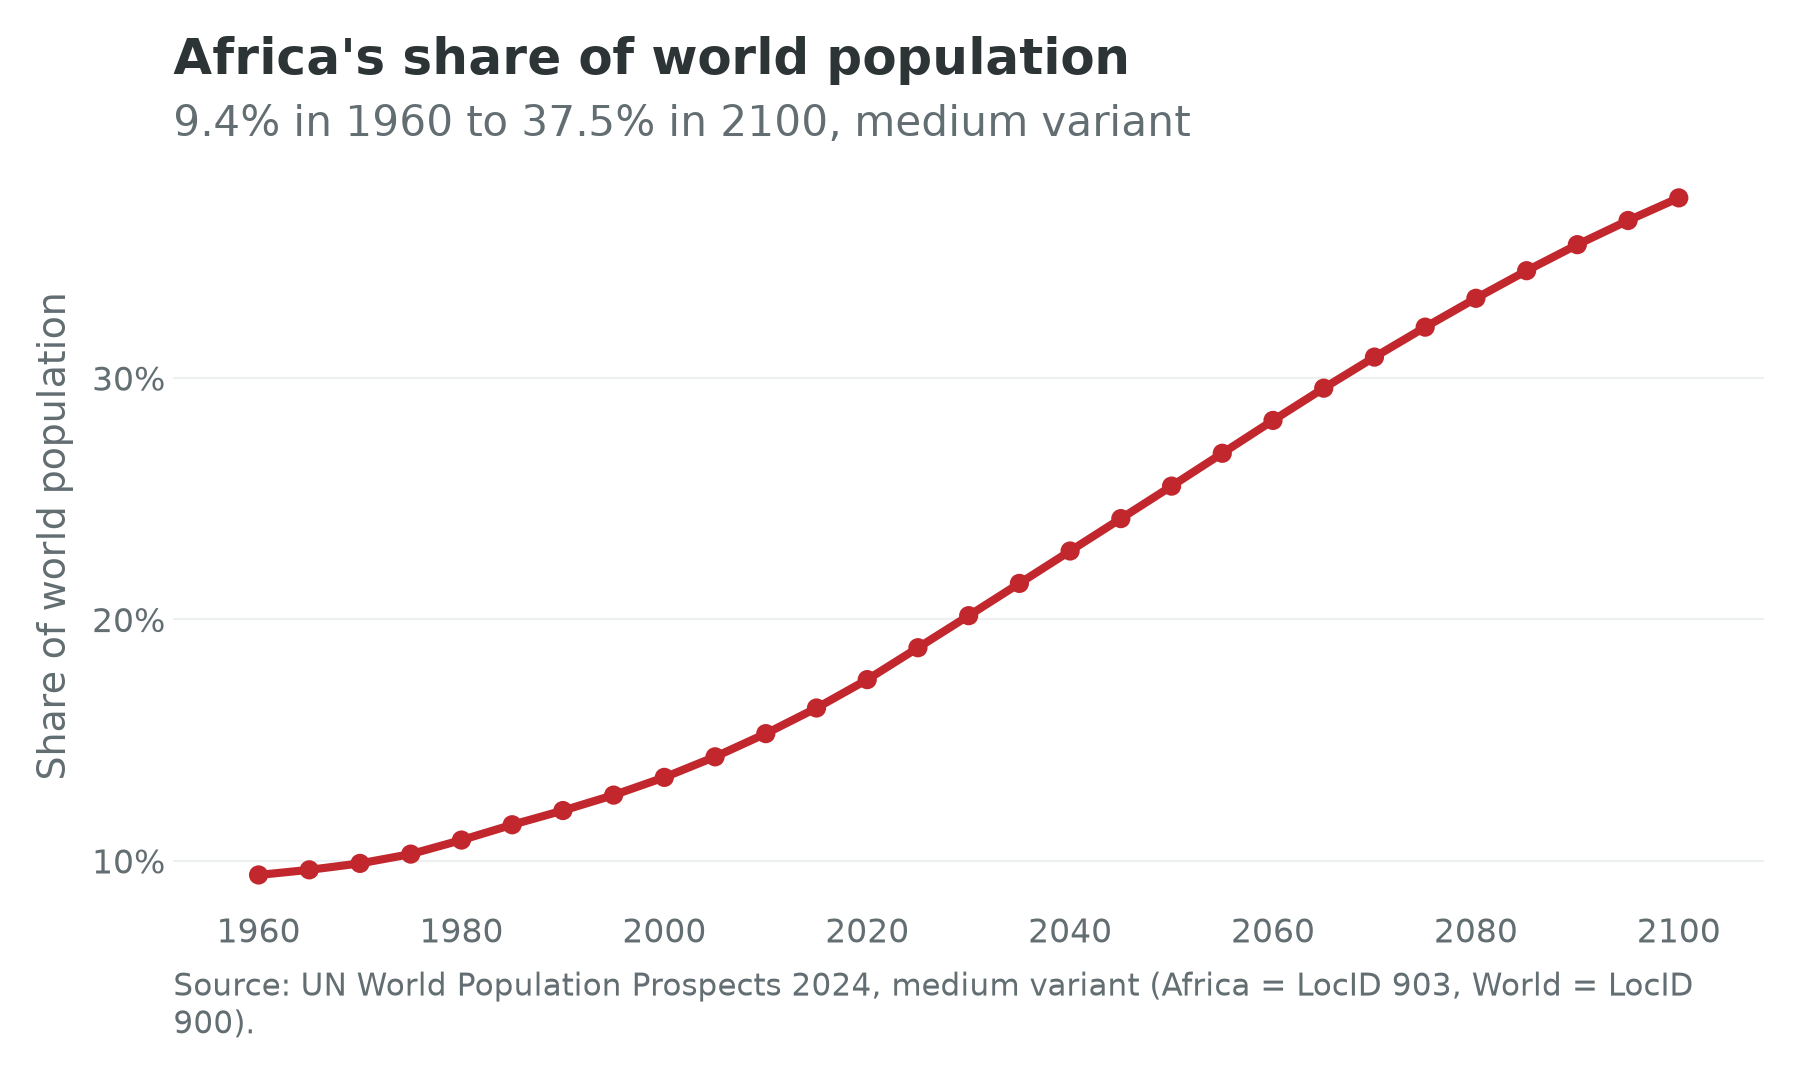
That is 18.6 percent of the world’s 8.162 billion people. In 1960 the same territory held 284 million, a fifth of today’s number. The medium variant of the UN’s projections puts Africa at 2.467 billion in 2050 and 3.814 billion in 2100, by which point more than a third of humanity, 37.5 percent, will be African.
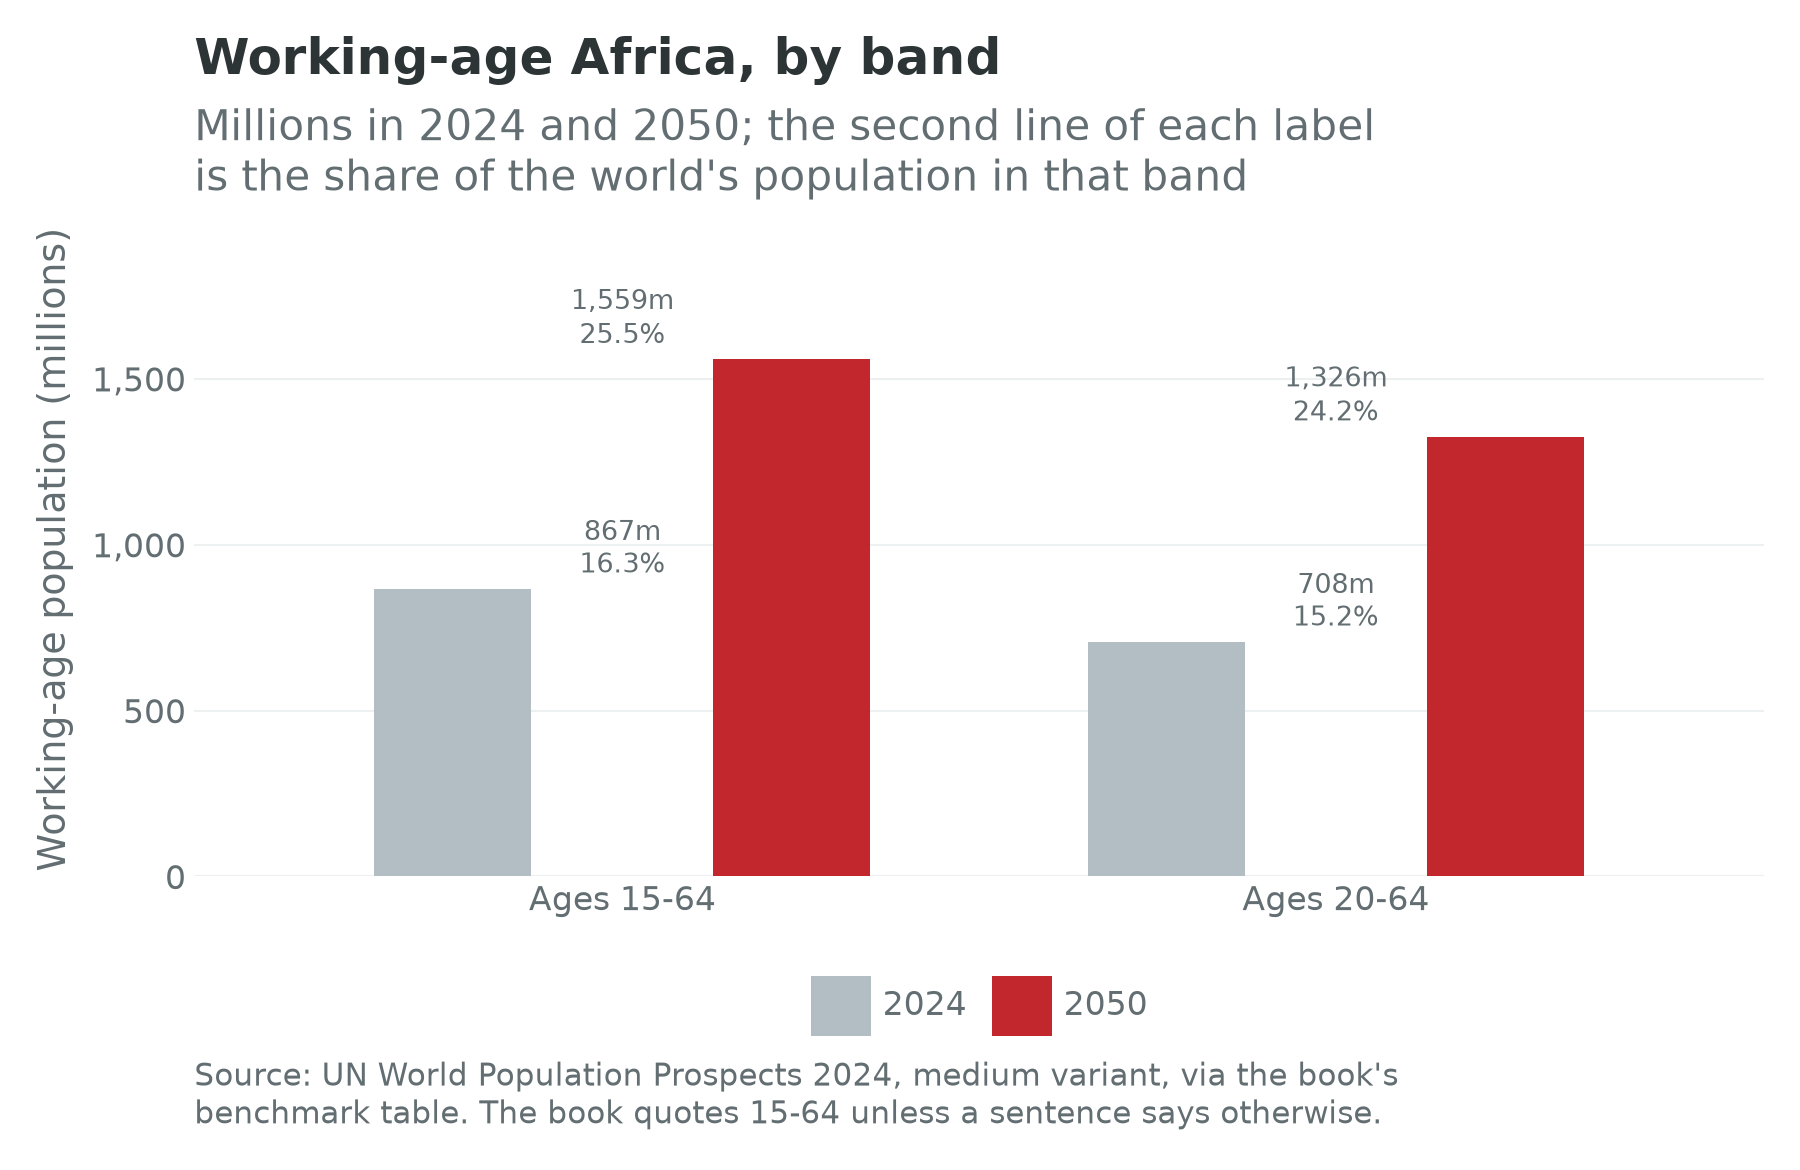
The identity does not run on headline population. It runs on the working-age population, and the choice of band changes the answer by enough to matter.
Working-age population, ages 15 to 64 (2024): 867 million, rising to 1,559 million by 2050 (WPP, 2024)
Africa’s share of the world’s 15-to-64 population rises from 16.3 percent to 25.5 percent over that period. On the narrower 20-to-64 band, which some labour statistics prefer because it excludes teenagers who ought to be in school, the numbers are 708 million in 2024 rising to 1,326 million in 2050, and the share goes from 15.2 percent to 24.2 percent. The gap between the bands is about 175 million people in 2024, larger than the population of any African country except Nigeria. This book quotes the 15-to-64 band unless a sentence says otherwise, because the two have been confused in print often enough to produce a widely repeated working-age figure off by about that same 175 million.
Within that continental total, the growth is concentrated. Eight African UN member states will at least double their populations between 2024 and 2054: the Democratic Republic of the Congo (2.17 times), the Central African Republic (2.16), Angola (2.13), Somalia (2.12), Niger (2.10), Chad (2.07), Tanzania (2.05) and Mali (2.03). Mayotte also doubles, at 2.15 times, and is left out of the count here because it is a French department rather than a UN member state; on a global increment of 1.65 billion it is a rounding error either way. Together the eight rise from 312 million to 659 million people, and they account for 21.0 percent of the entire world’s population increase over those thirty years. More than a fifth of the world’s demographic growth, in other words, will happen in eight countries that today hold 312 million people and produce $412 billion between them, less than South Africa produces with 64 million.
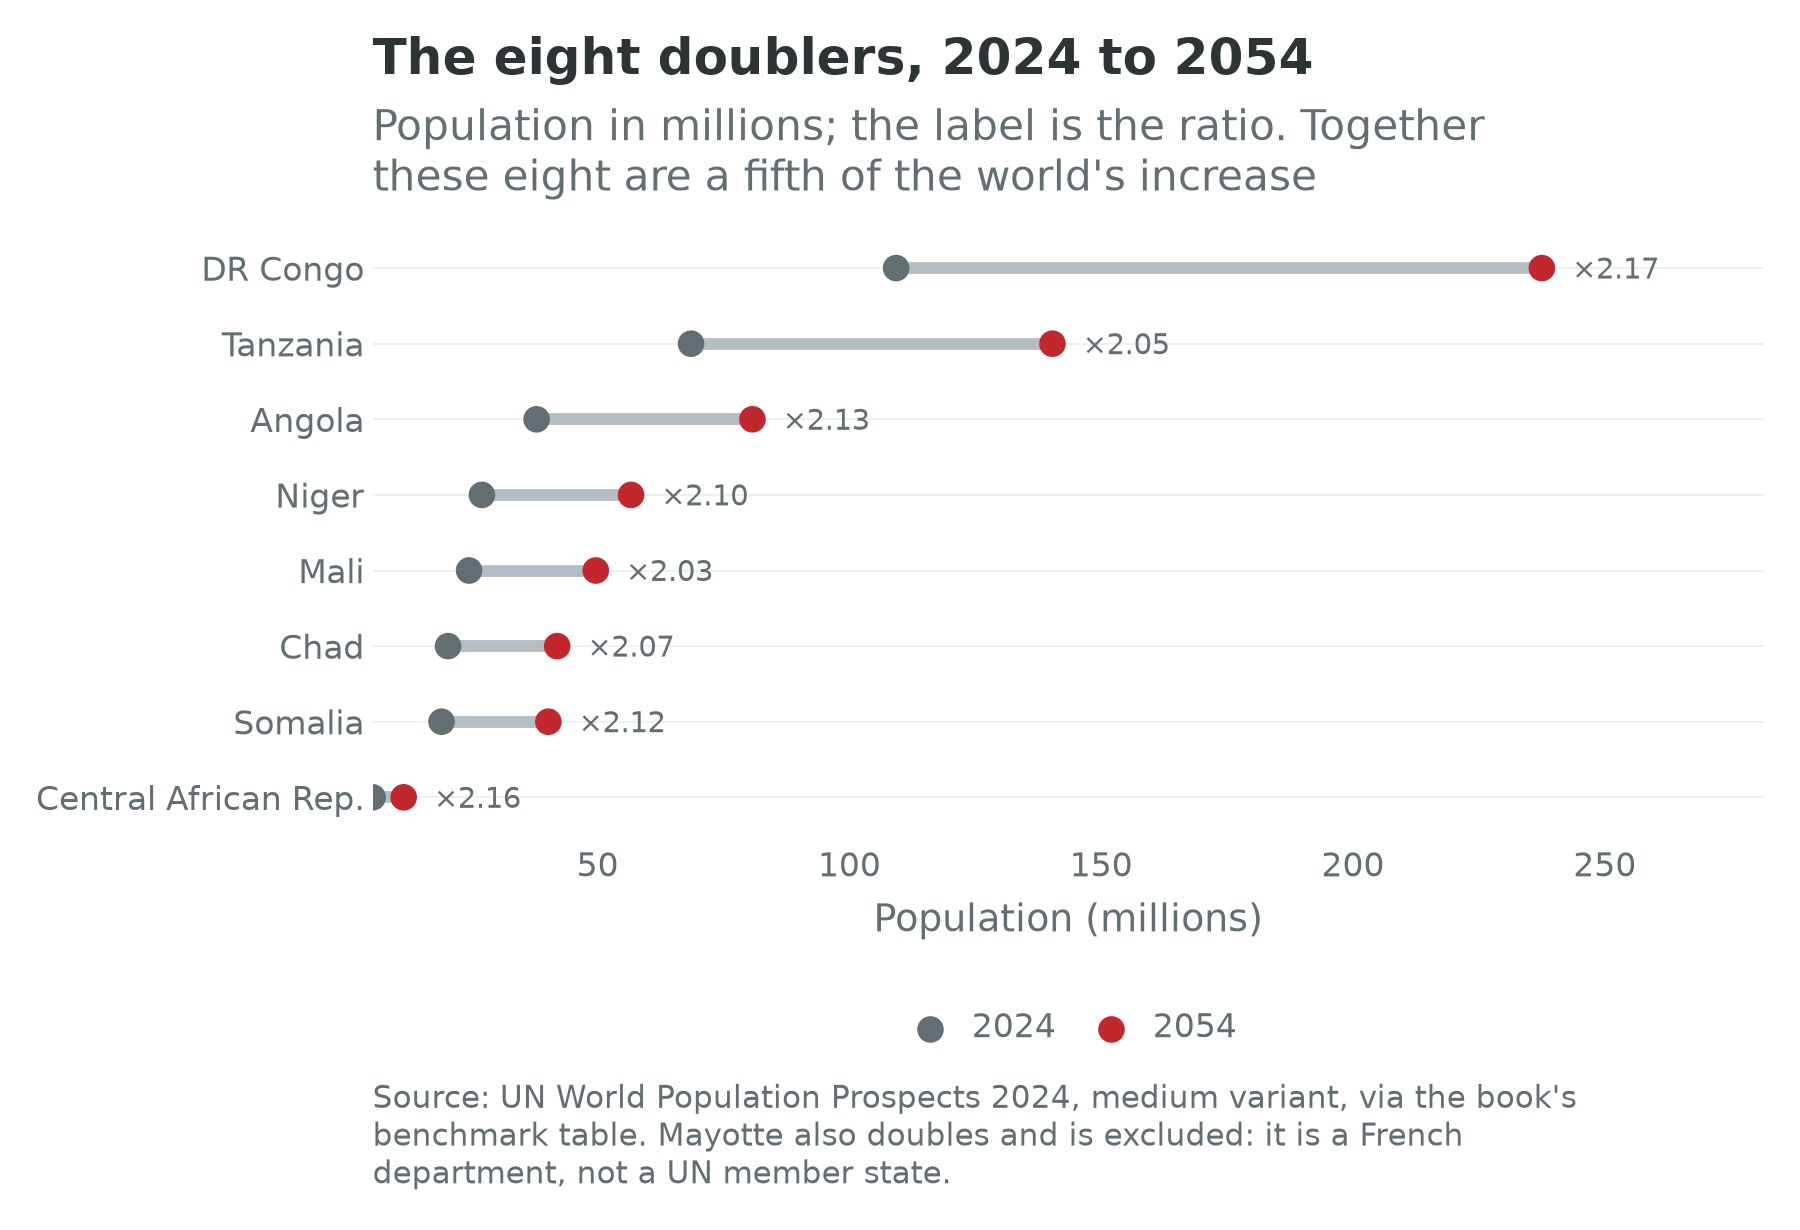
Notice what kind of list that is. It is not a list of the continent’s economic heavyweights. Egypt, South Africa, Morocco and Algeria are absent. Nigeria is absent because it starts from a base so large that its 1.54-fold rise between 2024 and 2050 still adds 127 million people. The doublers are, with the partial exception of Tanzania and Angola, the places where the state is thinnest and the statistics are worst. That conjunction is not a coincidence and it is the subject of Chapter 31.
Aggregate and Per Capita
Gross domestic product (54 countries, IMF World Economic Outlook April 2026, 2025 estimates): about $3.14 trillion
The aggregate and the per capita numbers tell two different stories, and both are true. In aggregate, the 54 economies together produce roughly $3.14 trillion a year at market exchange rates, and that total is heavily concentrated: the five largest, South Africa at $427 billion, Egypt at $365 billion, Nigeria at $290 billion, Algeria at $286 billion and Morocco at $183 billion, are 49.4 percent of it, and the ten largest are 68.6 percent. Divide the continental total by the continental population and you get roughly $2,070 per head, which places Africa as a whole in the lower-middle-income band and well below every other inhabited continent.
The dispersion around that average is the more interesting number. Seychelles records $18,479 per head and South Sudan $470, a spread of 39 to one within a single continent. Fifteen of the 54 sit below $1,000 per head; thirty-one sit below $2,000; nine sit above $5,000. There is no representative African country, and a book that quotes continental averages without saying so is misleading its reader. This is why the country cards exist.
The demographic dispersion is just as wide. Median age runs from 14.4 years in the Central African Republic to 37.4 in Mauritius; total fertility runs from 6.03 births per woman in Chad to 1.23 in Mauritius. The dependency ratio, the number of people under 15 or over 64 for every hundred of working age, runs from 39.5 in Mauritius to 104.7 in the Central African Republic. A dependency ratio above 100 means the working-age population is outnumbered by the people it supports. That is not a demographic dividend. It is the pre-dividend condition, and whether it becomes a dividend depends on the fertility transition that Chapter 2 takes up.
The 54, Sub-Saharan Africa, and North Africa
Three scopes recur in this book and they are not interchangeable. Stating the rule once and then keeping to it is the cheapest form of intellectual honesty available.
“Africa” means the 54 UN-recognized member states. That is the scope of the country cards, the WDI and population pulls, and every unlabelled continental statistic here. The African Union has 55 members, including the Sahrawi Arab Democratic Republic; where the subject is AU politics or the continental free-trade area, the book uses 55 and names the difference. Maps hatch the Morocco and Western Sahara boundary. There is no card for Somaliland; the Somalia card carries a note saying so.
“Sub-Saharan Africa” is a smaller set, and unfortunately it is a smaller set that different institutions draw differently. The country cards carry an African Union region field, whose Northern region contains six states: Algeria, Egypt, Libya, Mauritania, Morocco and Tunisia. That leaves 48 elsewhere, which is the count used above. The World Bank’s Sub-Saharan aggregate instead puts Mauritania on the Sub-Saharan side, so its “Sub-Saharan” figures rest on a slightly different list. Whenever a number here is labelled Sub-Saharan, the note under it says whose definition it uses, and when a number is assembled from the cards, the count is given.
North Africa is not the demographic century, and pretending otherwise flatters the aggregate. Tunisia’s working-age population grew at 0.5 percent a year over 2014 to 2024, Morocco’s at 1.1 percent and Algeria’s at 1.3 percent. Egypt’s, at 2.0 percent, is respectable but well short of the Sub-Saharan median. Egypt and Morocco appear in this book as productivity platforms and manufacturing exporters, in Chapters 27 and 28, not as engines of the population story. The same qualification applies at the other end: South Africa and Mauritius have already had their fertility transitions, and their identity arithmetic looks European. A continental average that mixes Niger with Mauritius is a number without a referent.
What the Numbers Are Made Of
Every figure quoted so far rests on a statistical apparatus, and on this continent that apparatus is thinner than the confident decimal places suggest. Data quality in this book is a layer, not a caveat: fields on every country card, a toggle on every map, and this section. If the reader does not know which numbers will bear weight, the numbers that will bear weight are worth less.
Start with the censuses, because the population projections that carry the whole argument are built on them. The Democratic Republic of the Congo, a country of 109 million people and the largest of the eight doublers, last ran a scientific census in 1984. Everything published about the DRC’s population since then is a projection off a 42-year-old enumeration, updated with survey data drawn from a sampling frame built on that same enumeration. Nigeria last counted in 2006, and that count was contested at the time and has never been repeated; successive governments have scheduled and then postponed a new one. Ethiopia last counted in 2007, and the round due in 2017 has been postponed repeatedly. Eritrea has no census year on its card at all, because it has never run one; Somalia’s last published enumeration was in 1975, and the round begun in the 1980s was never released. Eleven of the 53 countries with a recorded census year last counted before 2010.
This is not a reason to throw the population numbers away. Fertility and mortality are estimated from household surveys as well as censuses, the demographic transition is slow and smooth, and the UN’s methods are transparent and revised in public. It is a reason to hold country-level population figures for the worst cases loosely, and to be suspicious of any per-capita statistic for those countries, since the denominator is the projection.
The second input is the national accounts themselves, and here the operative word is rebasing. A country’s GDP series is built by scaling a base year forward with volume indices. If the base year is old, the weights are wrong, and everything that has grown since, mobile telephony above all, is undercounted. When the base year is finally updated, measured GDP jumps without a single additional shirt having been sewn. Nigeria rebased in 2014 and again in 2025, the second time moving the base year from 2010 to 2019 and lifting 2024 nominal GDP by 34.4 percent (Africa Check, 2025). Kenya rebased in 2021 to a 2016 base and revised the 2016 level up by 8.1 percent. South Africa rebased in 2021, moving the reference year from 2010 to 2015. Ghana’s 2010 rebasing and Senegal’s 2014 one were of the same order, and the general pattern of increases in the 25 to 60 percent range is documented in the companion volume (Wilse-Samson, 2026). Only 12 of the 54 cards carry a rebase year at all, which is itself a data-quality finding: for the other 42 the year could not be sourced from a public statistical-office record.
The moral is easy to state and hard to internalize. Africa’s growth rates over the 2000s were computed against denominators that later turned out to be too small. Nobody was lying. The apparatus was simply too thin to keep up with the economies it was measuring.
The third input is the labour-force survey, and it is the binding constraint on this book’s central argument. Term two of the identity is about employment, and employment is measured by asking people. Thirty-four of the 54 countries have a labour-force survey within five years. Two have never run one: the Central African Republic and South Sudan. The Democratic Republic of the Congo’s last one was the Enquête 1-2-3 in 2012. The consequence is that Chapter 10 presents its wage-employment overlay as a 34-country series, with the other 20 shown as ILO-modelled and visibly flagged, rather than as a continental series. That is a weaker claim than the one the thesis would like to make, and it is the claim the data supports.
The fourth input is a summary of the other three. The World Bank’s Statistical Performance Indicators score a country’s statistical system on data use, services, products, sources and infrastructure, and the cards carry the overall score for 53 of the 54; Eritrea, which reports almost nothing, has none (World Bank, 2026f). The median score is 61.7 and only 12 countries reach 70. At the top sit Senegal at 81.4, South Africa at 81.3 and Mauritius at 80.4; at the bottom, South Sudan at 27.1, Equatorial Guinea at 32.1 and Libya at 34.8.
The Confidence Flag
Those four fields combine into a single flag on each card, and the rule is deliberately crude so that it can be argued with. A country is flagged high if its last census was within 15 years, its SPI overall score is at least 70, and it has a labour-force survey within 5 years. It is flagged medium if exactly one of those three tests fails, and low if two or more fail or if the last census predates 2000. Where an input is missing entirely the flag is left unset rather than counted as a failure. That choice matters more than it sounds: a missing survey is ignorance about a statistical system, not evidence against it, and a rule that punished missing inputs would flag most of the continent low for reasons that have nothing to do with how its statistics are made.
The result across the 54 cards is 11 high, 20 medium, 20 low, and 3 not computable, because the Central African Republic and South Sudan have never run a labour-force survey and Eritrea has never held a census. Figure 1.4 plots the two testable dimensions against each other.
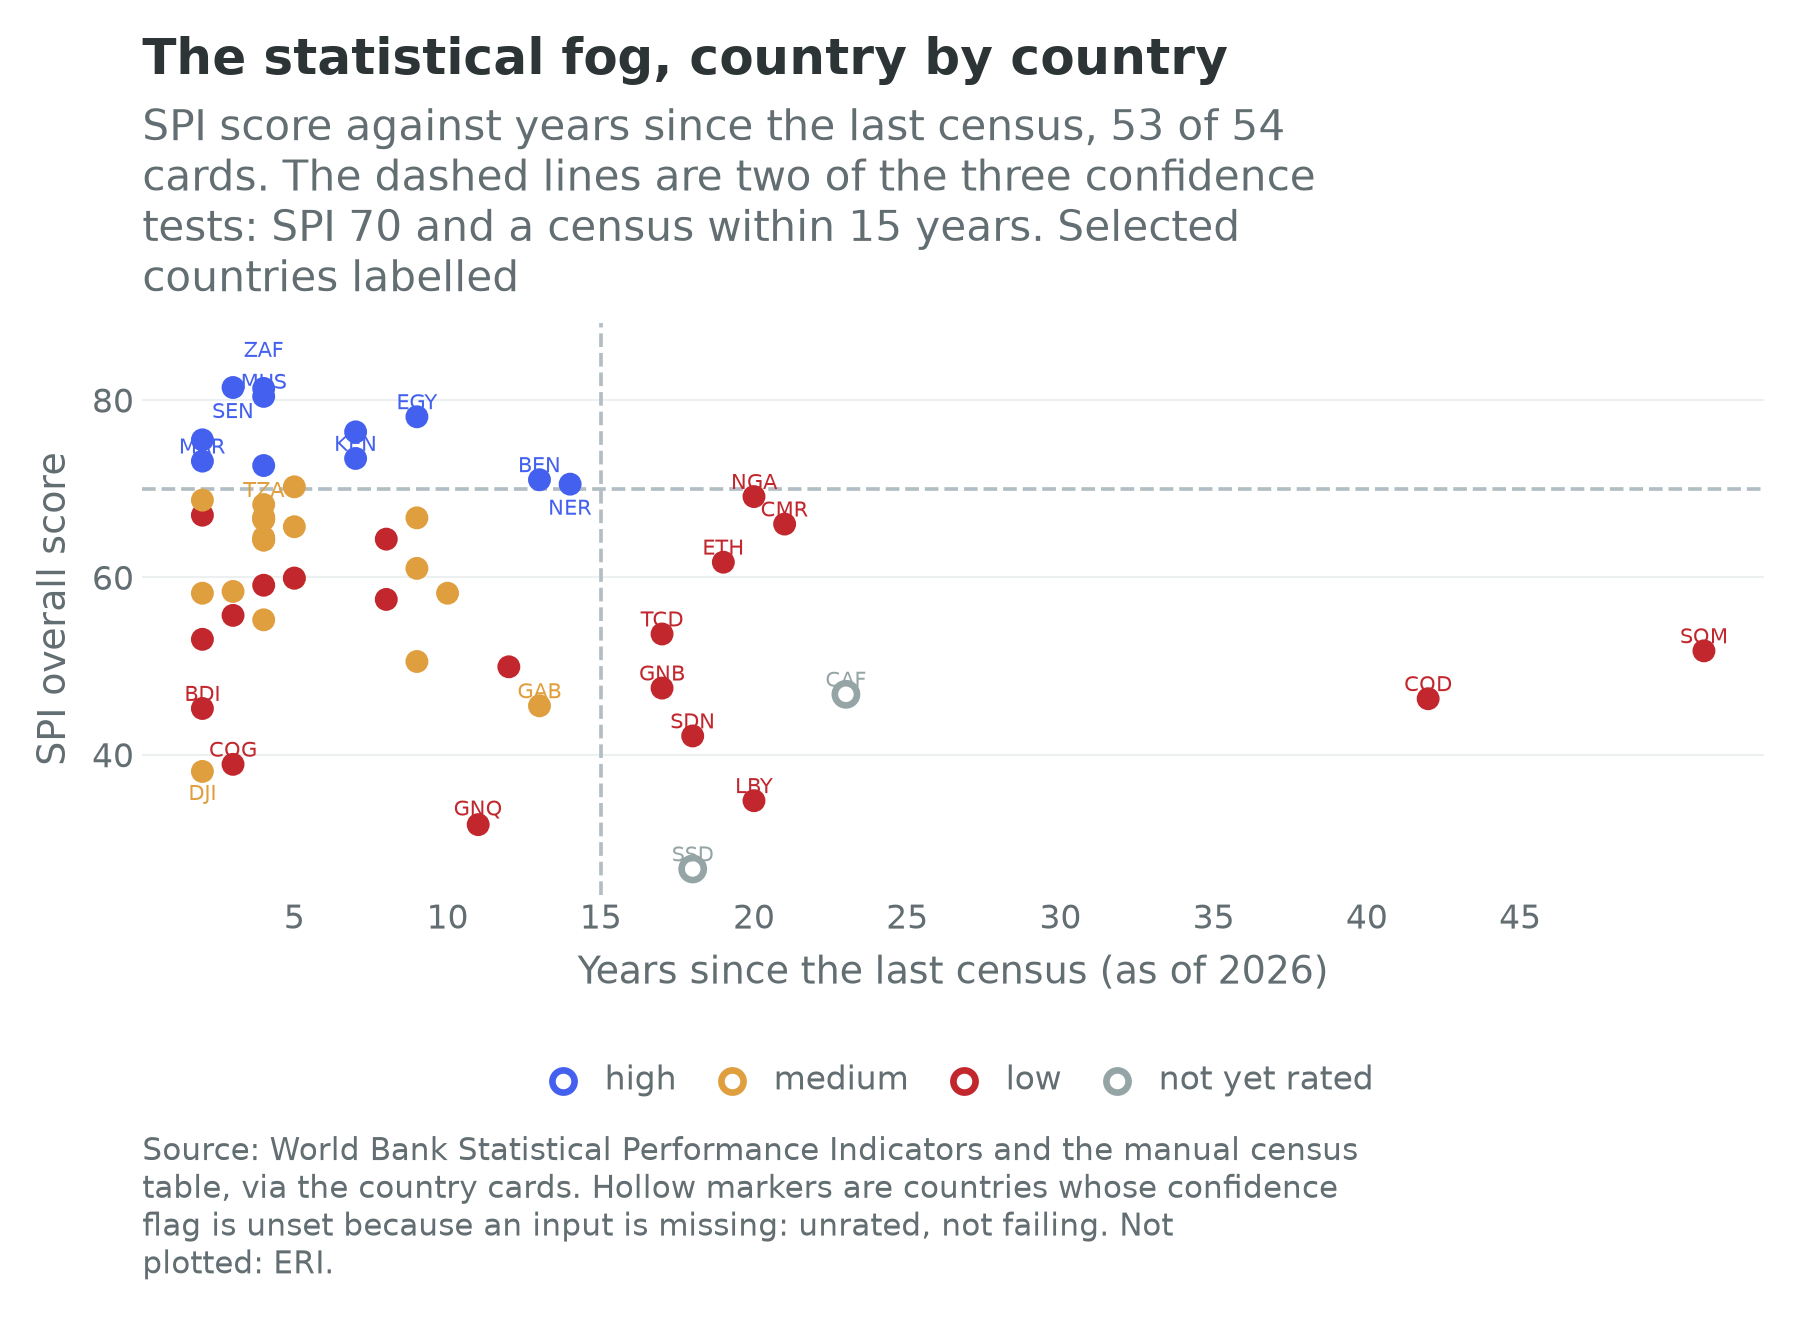
The scatter is the argument. The top-left quadrant, recent census and a decent statistical system, holds Senegal, South Africa, Morocco, Mauritius, Egypt and Kenya. The bottom-right, an old census and a weak system, holds the Democratic Republic of the Congo alone at 42 years since its last census, with the Central African Republic, Sudan, Chad and South Sudan strung out behind it. Nigeria sits at an SPI of 69.1 with a census twenty years old, which is why the largest African country by population and the third largest by output carries a low confidence flag. Ethiopia sits nearby for the same reason.
The Correctives, and Their Limits
Three literatures respond to this fog, and none of them replaces the official numbers.
The first is nightlights. Satellite measurements of light emitted at night correlate strongly with economic activity, and Henderson, Storeygard and Weil (2012) showed how to combine them with national accounts to produce growth estimates that put more weight on the satellite where the statistical system is weakest. It is an elegant idea and it has been enormously productive, and the companion volume’s Chapter 13 works through the machinery (Wilse-Samson, 2026). But nightlights have three failure modes that are specifically and severely African. Gas flares in the Niger Delta and off Cabinda light up the sensor without any corresponding local income, so oil-producing regions look richer than they are. The older sensors saturate over bright cities, so Lagos and Cairo cannot get brighter in the data no matter what they do. And subsistence activity emits almost no light at all, so the parts of the economy where most Africans actually work are, from orbit, invisible. A satellite that cannot see farming is a poor instrument for a continent where farming is the largest employer. Nightlights are therefore a corrective, flare-masked and read beside the census vintages, and never a replacement for the official series. This edition’s confidence flag does not use them; it rests on the census, survey and statistical-capacity tests alone.
The second is the household survey, used against the national accounts rather than alongside them. Young (2012) rebuilt Sub-Saharan living standards from Demographic and Health Survey data on what households actually own and consume, and found real consumption growing at 3.4 to 3.7 percent a year, three and a half to four times the rate implied by the standard international national-accounts datasets. That paper is usually read as good news, and it partly is. It is also a warning: two defensible measurement strategies applied to the same continent over the same period disagree by a factor of nearly four. Neither is obviously wrong. They are measuring different things, imperfectly, and the gap between them is the honest error bar on any statement about African growth in the 1990s and 2000s.
The third is the sociology of the statistics themselves. Jerven (2013) traced how the numbers are produced: the understaffed statistical offices, the donor projects that fund a survey and then move on, the international databases that fill gaps by interpolation and then present the interpolation with the same typography as the observation. His argument is not that African statistics are fabricated. It is that they are manufactured under constraints that the rest of us do not see, and that treating them as measurements rather than as estimates produces a literature that argues confidently about differences smaller than the measurement error. Jerven (2015) extends the point from the numbers to the economics built on them. Afrobarometer surveys, which ask people directly about employment, lived poverty and service delivery, are the standing complement: what respondents report against what the statistical office reports.
The practical upshot for this book is a rule rather than a lament. Every number in the text traces to a field on a country card or to a cited source; every country card shows its own data-quality fields next to its economic ones; every map can be switched into a mode that fades the countries whose numbers will not bear the weight. Readers who want to know how much to believe a claim can find out in one click.
Where the Money Is
The demographic numbers are the strongest thing in this chapter. The output numbers are the most interesting, and the most contingent.
The 54 cards carry GDP in current US dollars from the IMF’s World Economic Outlook of April 2026, for the year 2025, summing to about $3.14 trillion. One caveat attaches to every one of those figures. The IMF’s 2025 numbers are staff estimates made before every country had closed its accounts, they are revised at each release, and where the IMF publishes no figure the cards fall back to the World Bank’s latest year, and say so. Where a one-year difference would change an argument, this book does not make the argument.
The concentration is the first fact. South Africa and Egypt alone are a quarter of continental output. Nigeria, with twice Egypt’s population at 233 million against 117 million, produces less than Egypt does, at $290 billion against $365 billion, and has a GDP per head of $1,223 against Egypt’s $3,379. Kenya, the East African hub, is $136 billion; Ethiopia, with more than twice Kenya’s population, is $109 billion. The Democratic Republic of the Congo, which supplies about 73 percent of the world’s mined cobalt, records $93 billion of output and $871 per head (USGS, 2026). Holding the world’s chokepoint on a battery metal has not, so far, made the country that holds it rich, which is the question Chapter 13 is built around.
The second fact is that the narrative chapters of any book about Africa will over-index on five countries: South Africa, Nigeria, Kenya, Morocco and Ethiopia. Between them they are 36.8 percent of continental output and 34.6 percent of its population, and they have the research literature, the firm-level data and the journalists. This book will do it too, and says so. But the data-rich five are not uniformly data-rich, and the cards make the point better than a sentence can. South Africa, Kenya and Morocco carry high confidence flags, with SPI scores of 81.3, 73.4 and 73.1 and censuses in 2022, 2019 and 2024. Nigeria and Ethiopia carry low flags, on censuses from 2006 and 2007. Two of the five countries this book will lean on hardest are among the ones whose numbers it can trust least. The cards and the maps are how the other 49 get onto the page.
The Balance-Sheet Lens
Output is a flow. Much of what is interesting about African economies is a stock, and stocks are what a balance sheet records. The book’s second recurring lens, developed in Chapters 21 and 37 and threaded through the pole chapters, asks two questions of every economy: where do the funds come from and where do they go, and who owns what. On the sources side sit commodity export receipts, remittances, Chinese policy-bank lending, Eurobond issuance, aid and development-finance-institution money; on the uses side sit imports, debt service and capital flight. On the ownership side sit the creditors, the foreign owners of the mines, ports and telecom networks, and the diaspora. The pieces are visible in the cards already: external debt stock is recorded for 50 of the 54 countries and sums to about $1,176 billion, with South Africa at $176 billion, Egypt at $156 billion and Nigeria at $109 billion. The creditor breakdown is partial: the official debt statistics do not split bilateral lending between Paris Club and Chinese creditors, so the China line on every card is blank, which is precisely the gap that Chapter 32 fills by setting the Boston University loan database beside the official statistics and treating the difference as the object of study rather than as an error (Horn, Reinhart and Trebesch, 2021). That database records 1,319 loan commitments worth $181 billion between 2000 and 2024, to 49 governments and 7 regional bodies (Boston University Global Development Policy Center, 2025), and those are commitments rather than a debt stock, a distinction that a good deal of commentary elides. Meanwhile more than $90 billion of African government external repayments fall due in 2026, of which Egypt alone accounts for roughly $27 billion (S&P Global Ratings, 2026). Nobody currently maintains a consolidated continental balance sheet. Building one is the most useful thing this book’s data layer could produce.
The Case
State the optimistic case plainly, because a case worth arguing with deserves to be stated well.
The world’s supply of new workers is running out everywhere except here. China’s working-age population is falling, as are Europe’s, Japan’s and Korea’s, and India’s peaks within a generation (WPP, 2024). Africa’s rises from 867 million to 1,559 million between 2024 and 2050, and its share of the world’s working-age population goes from roughly a sixth to roughly a quarter. If labour is the scarce factor in the second half of this century, the continent that has it is the continent that matters, and the sequencing question becomes whether the capital, the institutions and the market access arrive in time to meet the workers.
Second, the base is low enough that catch-up growth is arithmetically easy. A country at $871 per head, which is where the Democratic Republic of the Congo sits, does not need a technological frontier to double its income; it needs fertilizer, a road, a functioning port, reliable electricity and a legal system that lets a firm collect what it is owed. Every one of those is a solved problem somewhere. Studwell (2026) is the most recent attempt to write the recipe down for this continent: land reform that raises smallholder yields, export-disciplined manufacturing, and financial policy that keeps capital pointed at both. Botswana, Mauritius, Rwanda and Ethiopia have each run parts of it, with results Chapter 9 sets side by side.
Third, some of the institutional constraints have genuinely moved. Mobile money did to African payments what the mobile telephone did to African telecoms, by skipping a generation of infrastructure rather than building it. The African Continental Free Trade Area exists, has agreed rules of origin on the large majority of tariff lines, and has begun trading under its own rules. Twelve countries have statistical systems the World Bank scores at 70 or better, three of them above 80. None of this is transformation. All of it is the removal of things that made transformation impossible.
Fourth, and least discussed, the political economy has become more interesting. The question in Dercon (2022) is not whether a country has good institutions in the abstract but whether its elite has struck a bargain to bet on growth rather than on division of the existing pot. That is a question about specific coalitions at specific moments, which means it can be answered, and it does not require the whole continent to move at once. Khan (2010) and Pritchett, Sen and Werker (2018) supply the vocabulary; Chapter 5 puts it to work.
The Counter-Case
Now state it against itself, because the case above was also made in 2011, on magazine covers, and the decade that followed did not oblige.
The first objection is the one that gives this book its central tension. Growth happened, and employment of the kind that changes a household’s trajectory did not follow in proportion. Ten to twelve million young Africans enter the labour market each year and the formal economy creates roughly three million jobs; the rest of the entrants land in low-productivity informal work (AfDB, 2016). Opalo (2026a) states the current version of the same gap: African economies are extending more than twenty-five years of successive expansion, and many of them will still struggle to turn another year of growth into reliable jobs. That is the observable content of term two of the identity, and Chapter 10 shows it country by country, for the 34 countries with a labour-force survey inside five years and, more cautiously, for the 20 without one.
The second objection is that the structural transformation may not be available. The East Asian route ran through labour-intensive manufacturing for export, and manufacturing everywhere now absorbs less labour at a given income level than it did when Korea did it, a pattern Rodrik (2016) named premature deindustrialization. Africa’s cities are growing as fast as Asia’s did, but a good number of them are growing as consumption cities financed by resource rents rather than as production cities financed by exports (Gollin, Jedwab and Vollrath, 2016). Density without tradable production is urbanization without industrialization, and it does not deliver the same productivity gains.
The third objection is the balance sheet. The repayment wall of the mid-2020s is real, the creditor composition is more complicated and less transparent than it was in the Heavily Indebted Poor Countries era, and the restructuring machinery is slower. A country spending a large share of revenue on external debt service is not building the port. Chapter 21 works through Zambia, Ghana and Ethiopia; the point here is that the balance-sheet constraint binds on exactly the term-three investments the case above requires.
The fourth objection is that the demographic dividend is a conditional, not a gift. It arrives only if fertility falls fast enough that the working-age share rises, and only if the additional workers find productive employment. Chad and Somalia, at 6.03 and 6.01 births per woman, and the Central African Republic, with 104.7 dependants for every hundred people of working age, are not yet in a dividend; they are in a bulge. A bulge that does not find work is a political risk, and Chapter 36 treats it as one.
The fifth objection is the one this chapter has been making all along. A good deal of what we think we know about African economic performance rests on a statistical apparatus that would not survive scrutiny in any other region, and the direction of the resulting bias is not known. Rebasings have moved measured GDP by a third in a single announcement. Consumption surveys and national accounts disagree about the 1990s and 2000s by a factor of nearly four. It is possible that Africa has been growing faster than the official numbers say, and possible that it has been growing more slowly. What is not possible is to settle the argument at the level of precision at which it is usually conducted.
Chapter 4 stages the argument properly, with the Africa Rising literature of 2011 on one side and its critics on the other. The purpose of putting the counter-case here, in the numbers chapter, is to establish the habit early. A book that is hopeful about a place is only worth reading if it has already conceded everything that can be conceded.
Connections to Other Chapters
- Chapter 2 (The Demographic Century) takes term one apart: fertility transitions country by country, the census vintages behind the WPP projections, and child survival as the precondition for the fertility decline.
- Chapter 4 (The Case and the Counter-Case) stages the two lists above as an argument, with Africa Rising, the growth-without-jobs critique and the development-bargain test.
- Chapter 10 (Labor, Youth, and Migration) is where the full identity decomposition lands, country by country, with the wage-employment and non-agricultural overlays beside it, and where the book answers what employment is for in a world that no longer needs it for output.
- Chapter 13 (Critical Minerals) picks up the DRC cobalt figure and asks why the chokepoint has not produced income.
- Chapter 21 (Capital and Sovereign Debt) and Chapter 32 (China in Africa) develop the balance-sheet lens sketched here, including the gap between official debt statistics and the loan-level databases.
- Chapter 22 (Land) carries the urban half of the story, including the megacity projections that this chapter deliberately did not lean on.
- Chapters 35 and 36 (Scenarios; What Could Go Wrong) carry the labour-redundant world as a scenario axis rather than a footnote, with the compute-inputs case, sun, land and minerals sold to the world’s machines, as its upside branch.
Discussion Questions
The identity says GDP growth is the sum of three growth rates. Take a country whose working-age population grows at 3 percent a year, whose employment-to-working-age ratio is flat, and whose output per worker grows at 1 percent. Compute implied GDP growth and implied GDP-per-capita growth, and explain why a government could preside over the first number for a decade and still lose an election on the second.
The confidence flag combines three tests: a census within 15 years, an SPI score of at least 70, and a labour-force survey within 5 years. Nigeria fails the first, passes the third narrowly, and sits just below the SPI threshold. Is a single composite flag the right way to summarize this, or does it destroy information that a reader needs? Propose an alternative and say what it would cost.
Young (2012) finds Sub-Saharan consumption growing three and a half to four times faster than the national accounts imply, while Jerven (2013) argues that the national accounts themselves are manufactured under severe constraints. These two claims are not the same claim. Distinguish them, and explain what each implies about whether the 2000s were a genuine African growth acceleration.
Suppose that by 2050 the frontier of production needs almost no labour, and that output per worker there rises without limit. Write out what happens to each of the identity’s three terms for a country whose working-age population is growing at 3 percent a year. Then say which of the country’s endowments, people, land, sun or minerals, the rest of the world would still pay for, and who would have to own the machines for that payment to raise income per head rather than a foreign balance sheet.
Try It
Open the three cards side by side: the Democratic Republic of the Congo, Nigeria and South Africa, in that order. For each, read the header note, the identity.working_age_pop_growth field, and the four data_quality fields. Then open the Growth Pole Map and switch on the confidence toggle, which hatches every country flagged low or whose flag is not yet computable. Write one paragraph on what the map is no longer telling you, and whether the countries that vanish are the ones the book’s thesis depends on most.
Data Exercise
Download all fifty-four cards from the country cards page on this site, as cards.csv if you work in a spreadsheet and cards.json if you would rather have the release each number came from travelling beside it. Build a table of all 54 countries with five columns: identity.working_age_pop_growth, scale.gdp_per_capita, data_quality.spi_overall_score, data_quality.last_census_year and data_quality.confidence_flag. Then answer three questions. First, is working-age population growth correlated with SPI score across the 54, and in which direction? Second, if you drop every country whose confidence_flag is low or whose census predates 2010, how much of the continent’s population and how much of its GDP have you dropped, using scale.population and scale.gdp_usd? Third, given that answer, write two sentences on whether a “high-confidence Africa” is a useful analytical object or a misleading one. Note which fields are null rather than zero, and never impute a null as a zero.
Data Sources and Further Reading
Key data sources
- UN World Population Prospects 2024 (population.un.org): all population, working-age, median-age, fertility and dependency figures here, medium variant, ages 15 to 64 unless stated. The continental benchmarks are the medium-variant totals for 2024, 2050 and 2100, and the country values are on the cards (UN DESA, 2024).
- IMF World Economic Outlook, April 2026: GDP in current US dollars, GDP per capita and real growth, 2025 estimates; World Bank World Development Indicators where the IMF publishes no figure, latest available year per country.
- World Bank International Debt Statistics: external debt stock and creditor composition.
- World Bank Statistical Performance Indicators: the overall statistical-capacity score on every card.
- National statistical offices, cited by name: NBS Nigeria, KNBS Kenya, Statistics South Africa, HCP Morocco, CAPMAS Egypt, INS Democratic Republic of the Congo.
- ILOSTAT modelled estimates (November 2025): identity terms two and three on 53 of the 54 cards, with the wage-employment, non-agricultural and informality overlays beside them. Term two is modelled employment aged 15 and over over the UN’s 15 to 64 population, a mismatch of age bands the book states rather than smooths. The GGDC Economic Transformation Database supplies the within-sector and between-sector split of term three, on the 21 countries it covers (International Labour Organization, 2026).
- Boston University Global Development Policy Center, Chinese Loans to Africa database.
- Afrobarometer: the lived-economy complement to the official series.
Further reading
- Morten Jerven, Poor Numbers (2013), on how African economic statistics are produced and what follows.
- Benno Ndulu and co-authors, The Political Economy of Economic Growth in Africa, 1960 to 2000 (2008), on the growth record itself.
- Johan Fourie, Our Long Walk to Economic Freedom (2021), for the long history Chapter 3 compresses.
- Stefan Dercon, Gambling on Development (2022), for the development-bargain framing.
- Thandika Mkandawire, “Thinking About Developmental States in Africa” (2001), for the African statist tradition the recipe literature usually ignores.
- Joe Studwell, How Africa Works (2026), for the recipe at book length, and Chapter 9 for the test.