9. The Studwell Recipe Applied
Of the fifty-three African country cards that carry both terms, exactly four post a rising employment-to-working-age ratio and output-per-worker growth above 2 percent a year over the decade to 2024: Côte d’Ivoire, Egypt, Mauritius and Rwanda. Between them they hold 164.0 million people, 10.8 percent of the continent, and produce 15.8 percent of its output. Two of the four are cases the recipe literature argues from. That is the chapter in one sentence: the East Asian pattern, in which productivity and employment rise together, is rare in Africa, it is not absent, and where it appears it appears in places the recipe already claims.
Learning Objectives
After reading this chapter, you should be able to:
- State Studwell’s three ingredients in the order he puts them, and translate each one into a prediction about a specific term or overlay of the book’s identity.
- Read Ethiopia, Rwanda, Botswana and Mauritius as four columns of one table rather than four stories, and say which of them ran which parts of the recipe and what each got for it.
- Explain why the recipe’s first ingredient, land reform, does not travel to most of Sub-Saharan Africa in the form it took in Korea, Taiwan and Japan, and what replaces it.
- Set out the critics’ case, from premature deindustrialization through the services-led alternative to the complexity view, and say which of them the country cards support and which they do not.
- Say what survives of the recipe in a world where the frontier of production no longer needs unskilled labour, and why the surviving version looks more like Botswana than like Ethiopia.
Prior work: the Rwandan sequencing argument used here, security then administration then property adjudication then market strategy, is developed at length in the companion volume, The New Regional Economics, chapter 12 (Wilse-Samson, 2026). This chapter cites it rather than repeating it, and adds the identity arithmetic the companion volume does not have.
Two conventions. This chapter is a comparison, not a set of country studies: the texture of Ethiopian industrial policy belongs to Chapter 29 and that of the Rwandan settlement to Chapters 26 and 31. And “the recipe” means the sequence set out in How Asia Works (Studwell, 2013) and applied to this continent in How Africa Works (Studwell, 2026), a book serious enough to deserve being argued with rather than summarized.
1. The recipe, stated so that it can be tested
Studwell’s argument has three ingredients and, more importantly, an order.
First, agriculture. Break up large holdings and put land in the hands of households farming at garden scale. The claim is not egalitarian sentiment; it is that a household farming two hectares with its own labour maximizes output per hectare rather than per worker, which is the right thing to maximize in an economy whose only abundant factor is people. High-yield smallholder agriculture then feeds the cities, saves foreign exchange, and creates a rural market for the manufactures of the second stage.
Second, manufacturing, disciplined by exports. Protect and subsidize infant industry, but attach the support to a test the state cannot fake: whether the goods sell abroad. Firms that pass keep the support; firms that fail lose it. Studwell’s insistence is that the export test is the active ingredient and the protection the inert one, which is why the same policy list produced Korea and also Malaysia’s rather less impressive record.
Third, finance kept on a short leash. Direct credit at the first two stages, hold interest rates and capital accounts where they serve that direction, and resist the deregulation that turns a banking system into a property-and-consumption machine. Finance is the instrument that enforces the first two ingredients, not an industry to be developed for its own sake. The order is the argument: agriculture pays for industry, exports discipline it, and finance points capital at both.
Now translate that into the book’s arithmetic. Recall from Chapter 1 that GDP growth is approximately the growth of output per worker, plus the growth of the employment-to-working-age ratio, plus the growth of the working-age population, all three as growth rates.
The first ingredient is a term-three claim about the sector that employs most people, and a term-two floor: a smallholder economy at high yields keeps people in work that is worth doing while the second stage is built. In the split of term three that Chapters 6 and 10 use, it is a within-sector claim, since it makes farmers better at farming rather than moving them.
The second ingredient is the recipe’s distinctive claim, and it is a claim about term two and term three at once. Workers move from lower-productivity agriculture into higher-productivity manufacturing, which shows up as a positive between-sector component of term three, and they move into wage employment, which shows up in the employment ratio and, more sharply, in the wage-employment and non-agricultural overlays. The recipe predicts that these rise together. Nothing else in the development literature makes that prediction so cleanly, or is so easy to check.
The third ingredient has no term of its own. It shows up as the persistence of the other two, which is the honest way of saying that it is the hardest of the three to test and the easiest to assert.
One warning about what term two can settle. It counts anyone who did any work for pay or profit, so subsistence farming and roadside trade are employment. The recipe’s promise is not employment on that definition, which Africa already has almost universally, but wage employment at rising productivity, which is why the tables below carry the wage-employment and non-agricultural overlays beside the terms.
2. The four columns
Studwell tests the recipe on four African countries: Botswana, Mauritius, Ethiopia and Rwanda. Chapter 4 has already made the first observation about that list, that two of the four sit near the top of the continental income distribution and two near the bottom, and that between them they hold under a tenth of Africa’s people. Table 9.1 puts all four in one place.
| Quantity | Ethiopia | Rwanda | Botswana | Mauritius | Continental median |
|---|---|---|---|---|---|
| Term one: working-age population | 3.46 | 2.83 | 1.78 | -0.24 | 2.89 |
| Term two: employment ratio | -1.58 | 0.65 | 0.41 | 0.61 | -0.15 |
| Term three: output per worker | 5.91 | 3.26 | -0.11 | 2.02 | 0.74 |
| Implied GDP growth | 7.79 | 6.74 | 2.09 | 2.39 | 2.98 |
| Observed GDP growth | 7.92 | 6.72 | 2.09 | 2.40 | 2.91 |
| Five-year growth forecast | 8.36 | 7.04 | 3.56 | 3.40 | 4.47 |
| Wage employment (percent of employment) | 15.4 | 59.1 | 71.9 | 81.8 | 31.0 |
| Employment outside agriculture (percent) | 39.0 | 63.5 | 81.9 | 95.1 | 59.0 |
| Informal employment (percent) | 77.7 | 84.3 | 75.6 | 23.5 | 89.1 |
| GDP per head (US dollars) | 987 | 1,128 | 7,662 | 12,977 | 1,678 |
| Within-sector productivity growth | 4.21 | 0.17 | -1.62 | 1.46 | 1.20 |
| Between-sector productivity growth | 1.67 | 3.43 | 0.38 | 0.54 | 0.69 |
| Last census | 2007 | 2022 | 2022 | 2022 | |
| Last labour-force survey | 2021 | 2024 | 2024 | 2025 | |
| Confidence flag | low | high | medium | high |
Growth rates are annual, in percentage points, over 2014 to 2024; shares are of the latest year on the card; the within-and-between split runs over 2008 to 2018 on the twenty-one countries the transformation database covers. Term one is the working-age population aged 15 to 64; term two is modelled employment aged 15 and over divided by that population. The median column is taken column by column across the cards carrying each quantity and is not a country. Sources: UN World Population Prospects 2024, medium variant; ILOSTAT modelled estimates, November 2025; IMF World Economic Outlook, April 2026; the Groningen Growth and Development Centre’s Economic Transformation Database; and the book’s data-quality table, all via the country cards.
Read down the columns and four different economies appear, at most two of them running anything a reader of How Asia Works would recognize.
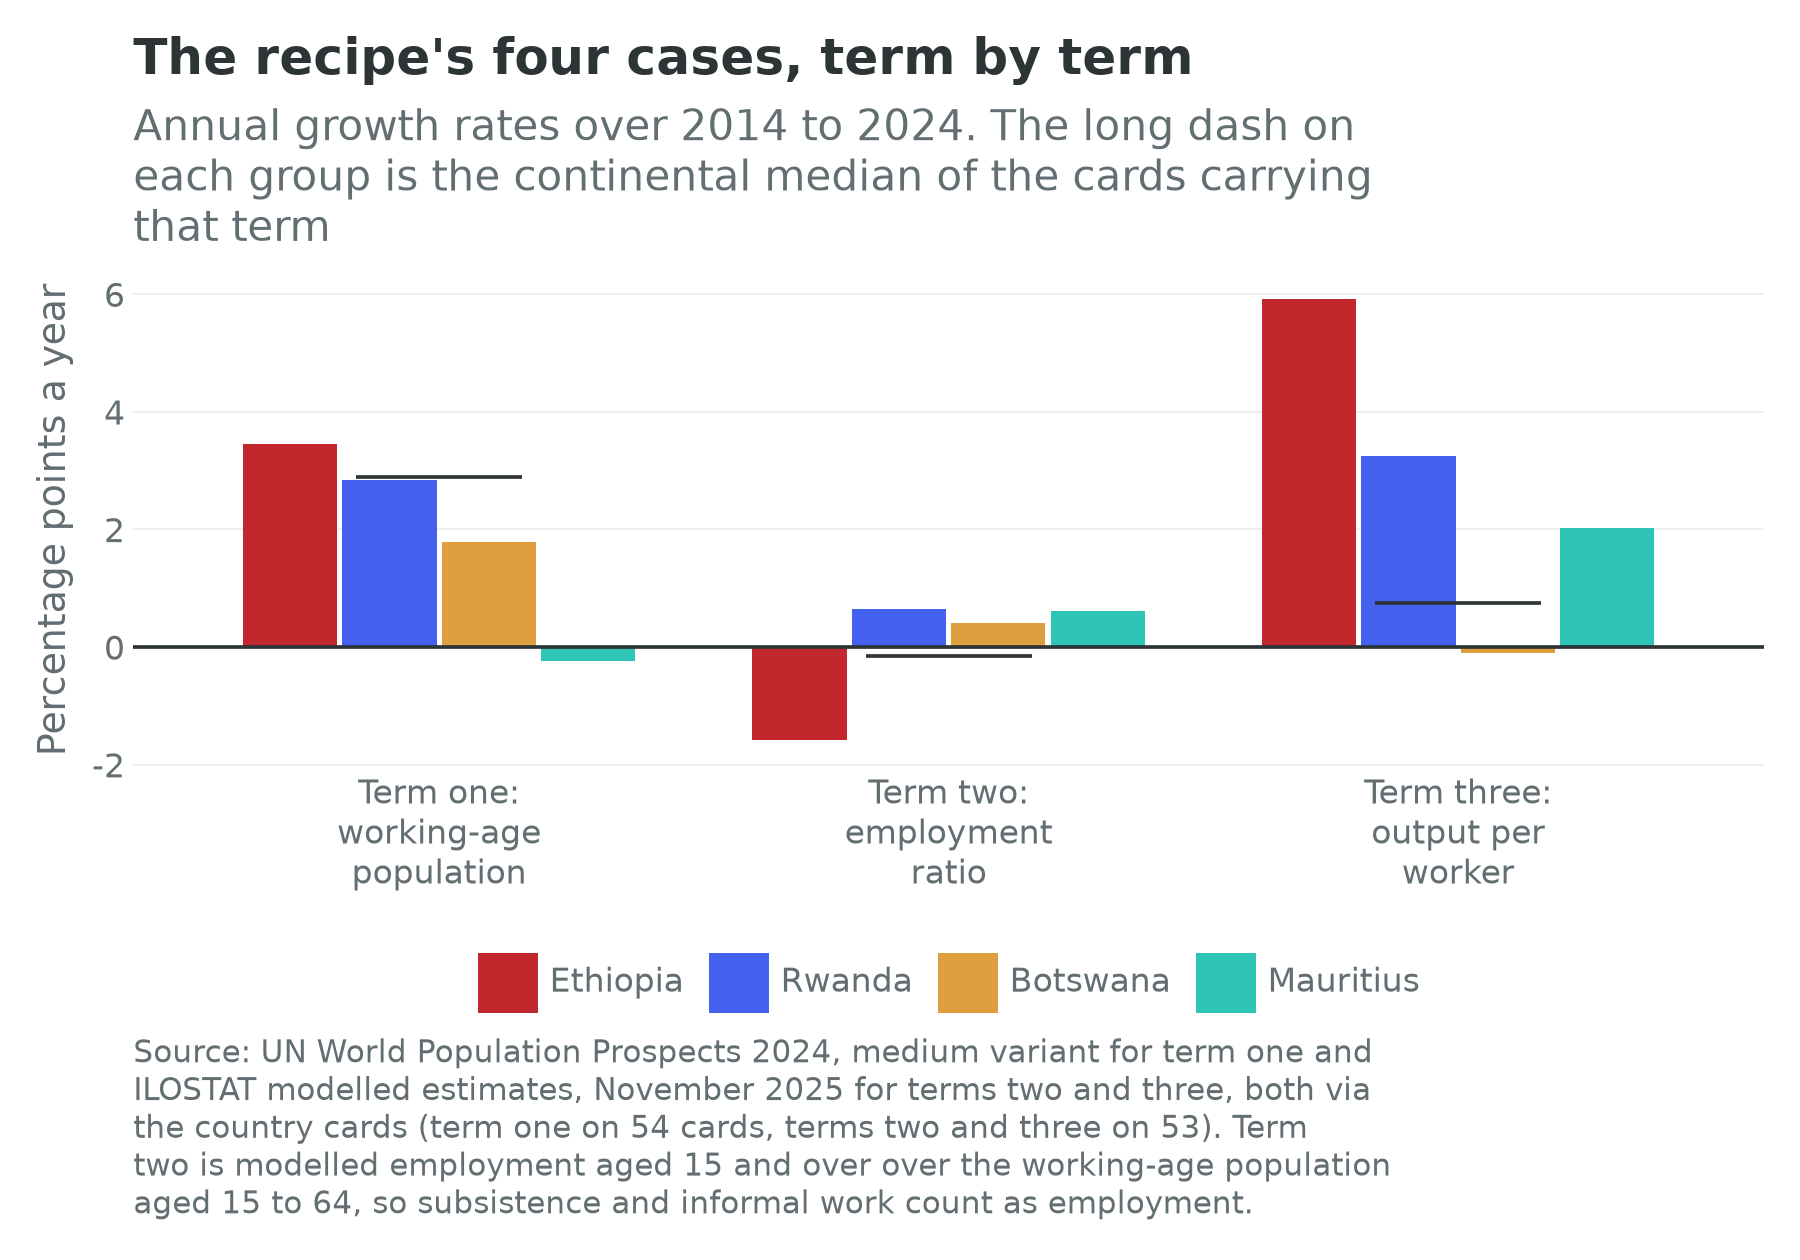
Ethiopia is the recipe’s instruments without the recipe’s result. Its output per worker grew at 5.91 percent a year, the highest of the fifty-three cards carrying the term, and its employment ratio fell at 1.58 percent a year, the lowest: the same country holds first and last place on the two terms the recipe says should move together. Its within-sector productivity component of 4.21 percentage points a year is also the highest of the twenty-one countries the transformation database covers. Sectors got better, the share of the working-age population in them did not rise, and wage employment is 15.4 percent of all employment, forty-third of fifty-three. Chapter 29 works through why: the state built the parks, the power and the railway, and could not get the currency, the market access or the wage right.
Rwanda is the recipe reading well. Its employment ratio grew at 0.65 percent a year, fourth of fifty-three, and its output per worker at 3.26, fifth, making it one of only four cards with a positive second term and a third term above 2 percent, and the only one of those four that is a low-income country in the middle of the demographic transition. Its wage-employment share of 59.1 percent is fifteenth of fifty-three, remarkable for a country with the thirty-eighth income per head. And the split of its third term is the sharpest in the book: between-sector growth of 3.43 percentage points a year, second of twenty-one, against within-sector growth of 0.17, sixteenth. Rwanda’s productivity gains came almost entirely from moving people and Ethiopia’s from improving sectors: two countries the same literature holds up ran opposite halves of the same mechanism.
Botswana ran none of it and is the fourth-richest card on the continent. Its output per worker fell at 0.11 percent a year over the decade and its within-sector component over the longer window is minus 1.62 percentage points a year, twentieth of twenty-one, and there is no export manufacturing sector to speak of. And yet 71.9 percent of Botswanan employment is waged, seventh on the continent, its employment ratio rose at 0.41 percent a year, and income per head is $7,662, fourth of the fifty-four. Something worked here, and it was not the recipe.
Mauritius is the recipe finished, and then something else. Its working-age population shrank at 0.24 percent a year, the only negative first term of the fifty-four, so the demographic story this book is about ended in Mauritius a generation ago. What is left is the residue of a completed transformation: second on the continent for wage employment and for employment outside agriculture, second lowest of the forty-five cards carrying an informality rate, and second of the fifty-four on income per head. That is what the recipe looks like when it has run to completion on a small island, and, as Section 7 argues, a country whose last two decades of growth came from an offshore financial centre, which is the third ingredient inverted.
One arithmetic reassurance before the interpretation. All four decompositions add: implied against observed growth differs by 0.13 percentage points in Ethiopia, 0.02 in Rwanda, and less than 0.01 in Botswana and Mauritius. What follows is a disagreement about mechanisms.
3. Ingredient by ingredient, against the cards
Table 9.2 states what each ingredient predicts in the identity and puts the cards’ answer beside it.
| Recipe ingredient | What it predicts in the identity | What the cards show |
|---|---|---|
| One: household-scale agriculture after land reform | Within-sector productivity growth in the sector that employs most people; a floor under term two while stage two is built; the non-agricultural share moving late rather than early | Ethiopia has the highest within-sector component of the twenty-one measured, at 4.21 points a year, and the lowest second term of the fifty-three, at minus 1.58. Rwanda has the second-highest between-sector component and a within-sector component near zero, at 3.43 against 0.17. The floor did not hold in the first case and the mechanism ran backwards in the second |
| Two: export-disciplined manufacturing | Term two and term three rising together; a positive between-sector component; the wage-employment and non-agricultural shares rising faster than income | Across the fifty-three cards the two terms are negatively correlated, at minus 0.27; the ten fastest term-three economies have a median second term of minus 0.91 against minus 0.09 for the other forty-three. Only Rwanda, of the four, shows the joint signature |
| Three: finance on a short leash | No term of its own; visible as the persistence of the first two, and as investment sustained through a downturn | Not testable on the cards, which carry an inward investment line but no investment rate and no credit series: Ethiopia took $4.0 billion of foreign direct investment and Rwanda $0.6 billion, which says who is putting money in and nothing about whether the state kept finance on a short leash. Section 7 argues it from the institutions instead |
| The joint prediction | An economy moving up all three at once, with income following | Four of the fifty-three cards have a positive second term and a third term above 2 percent: Côte d’Ivoire, Egypt, Mauritius and Rwanda. Two of the four are the recipe’s own cases, which is the strongest thing the cards say for it |
Sources: ILOSTAT modelled estimates, November 2025, for terms two and three and the overlays; the Groningen Growth and Development Centre’s Economic Transformation Database for the within-and-between split, over 2008 to 2018 on the twenty-one countries it covers; all via the country cards. The correlations and medians in the third column are computed across the cards carrying both quantities.
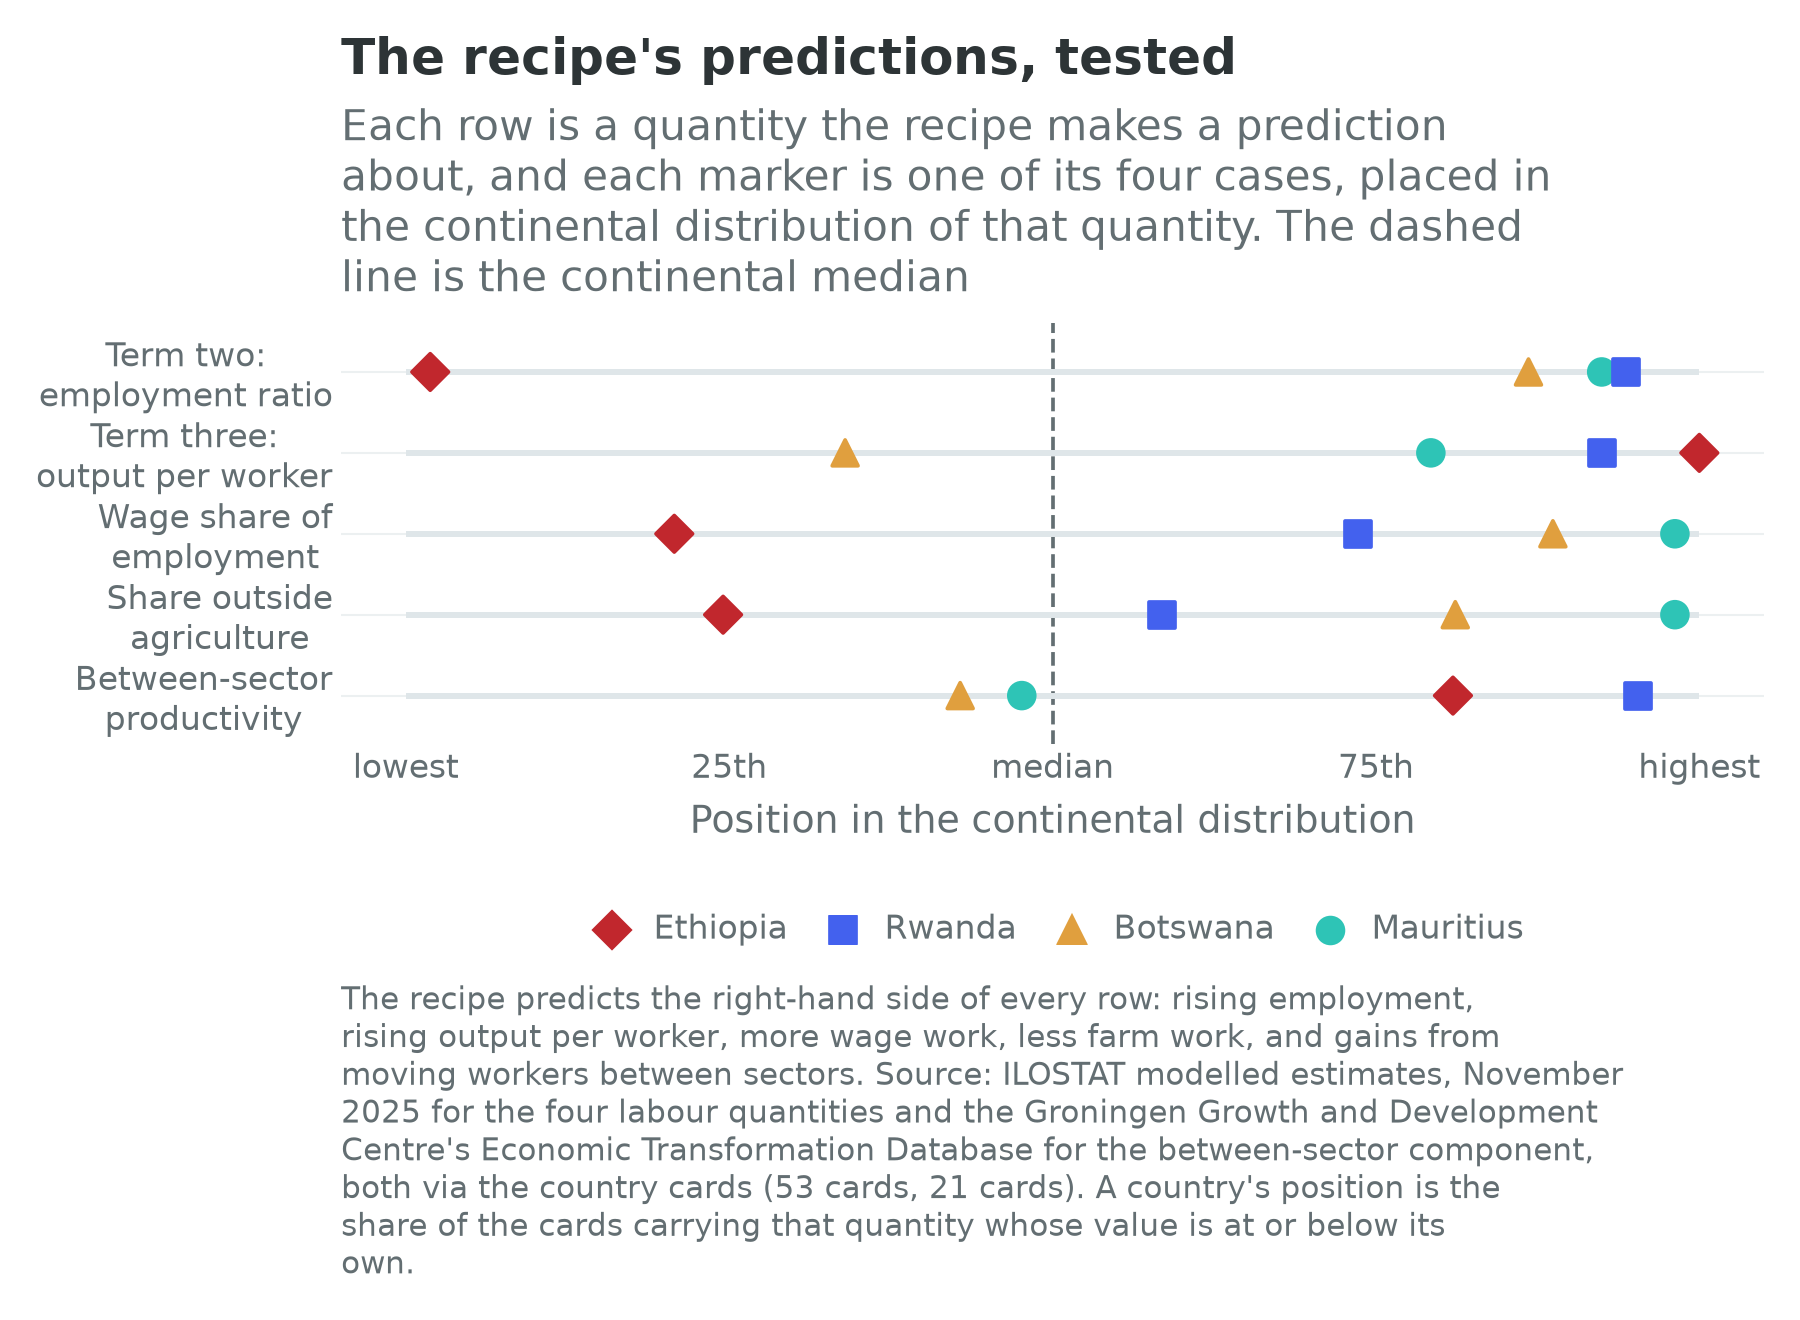
The figure is the chapter’s central exhibit. A country running the recipe successfully should sit on the right of every row, and none of the four does. Rwanda comes closest, missing only on the two level measures, on which a country at $1,128 a head cannot yet be expected to lead. Mauritius leads on the levels and is unremarkable on the flows, which is what a finished transformation looks like. Botswana leads on the levels and is near the bottom on productivity. Ethiopia is at both extremes at once.
4. The near-misses, on the same axes
A recipe argued only from its successes cannot be wrong. Table 9.3 sets five economies beside the four: three usually described as having almost run the recipe, and two that this book’s own pole chapters call the clearest African tests of it.
| Quantity | Nigeria | Kenya | Ghana | Morocco | South Africa |
|---|---|---|---|---|---|
| Term one: working-age population | 2.90 | 2.94 | 2.52 | 1.10 | 1.61 |
| Term two: employment ratio | 0.29 | -1.17 | -1.56 | -0.45 | -0.45 |
| Term three: output per worker | -1.94 | 2.84 | 3.48 | 1.88 | -0.48 |
| Observed GDP growth | 1.20 | 4.62 | 4.45 | 2.54 | 0.67 |
| Wage employment (percent of employment) | 13.6 | 35.1 | 32.2 | 59.6 | 82.7 |
| Employment outside agriculture (percent) | 65.9 | 53.5 | 64.8 | 71.7 | 94.6 |
| Informal employment (percent) | 93.1 | 86.5 | 78.1 | not carried | 34.8 |
| GDP per head (US dollars) | 1,223 | 2,558 | 3,271 | 4,842 | 6,769 |
| Within-sector productivity growth | -1.19 | 2.50 | 3.74 | 2.81 | 0.39 |
| Between-sector productivity growth | 1.48 | -0.07 | -0.71 | 1.13 | -0.21 |
| Last census | 2006 | 2019 | 2021 | 2024 | 2022 |
| Last labour-force survey | 2023 | 2024 | 2025 | 2024 | 2025 |
| Confidence flag | low | high | medium | high | high |
Units, windows and sources as in Table 9.1. Morocco’s card carries no informal-employment share, which is a gap in the international series rather than a claim about Morocco.
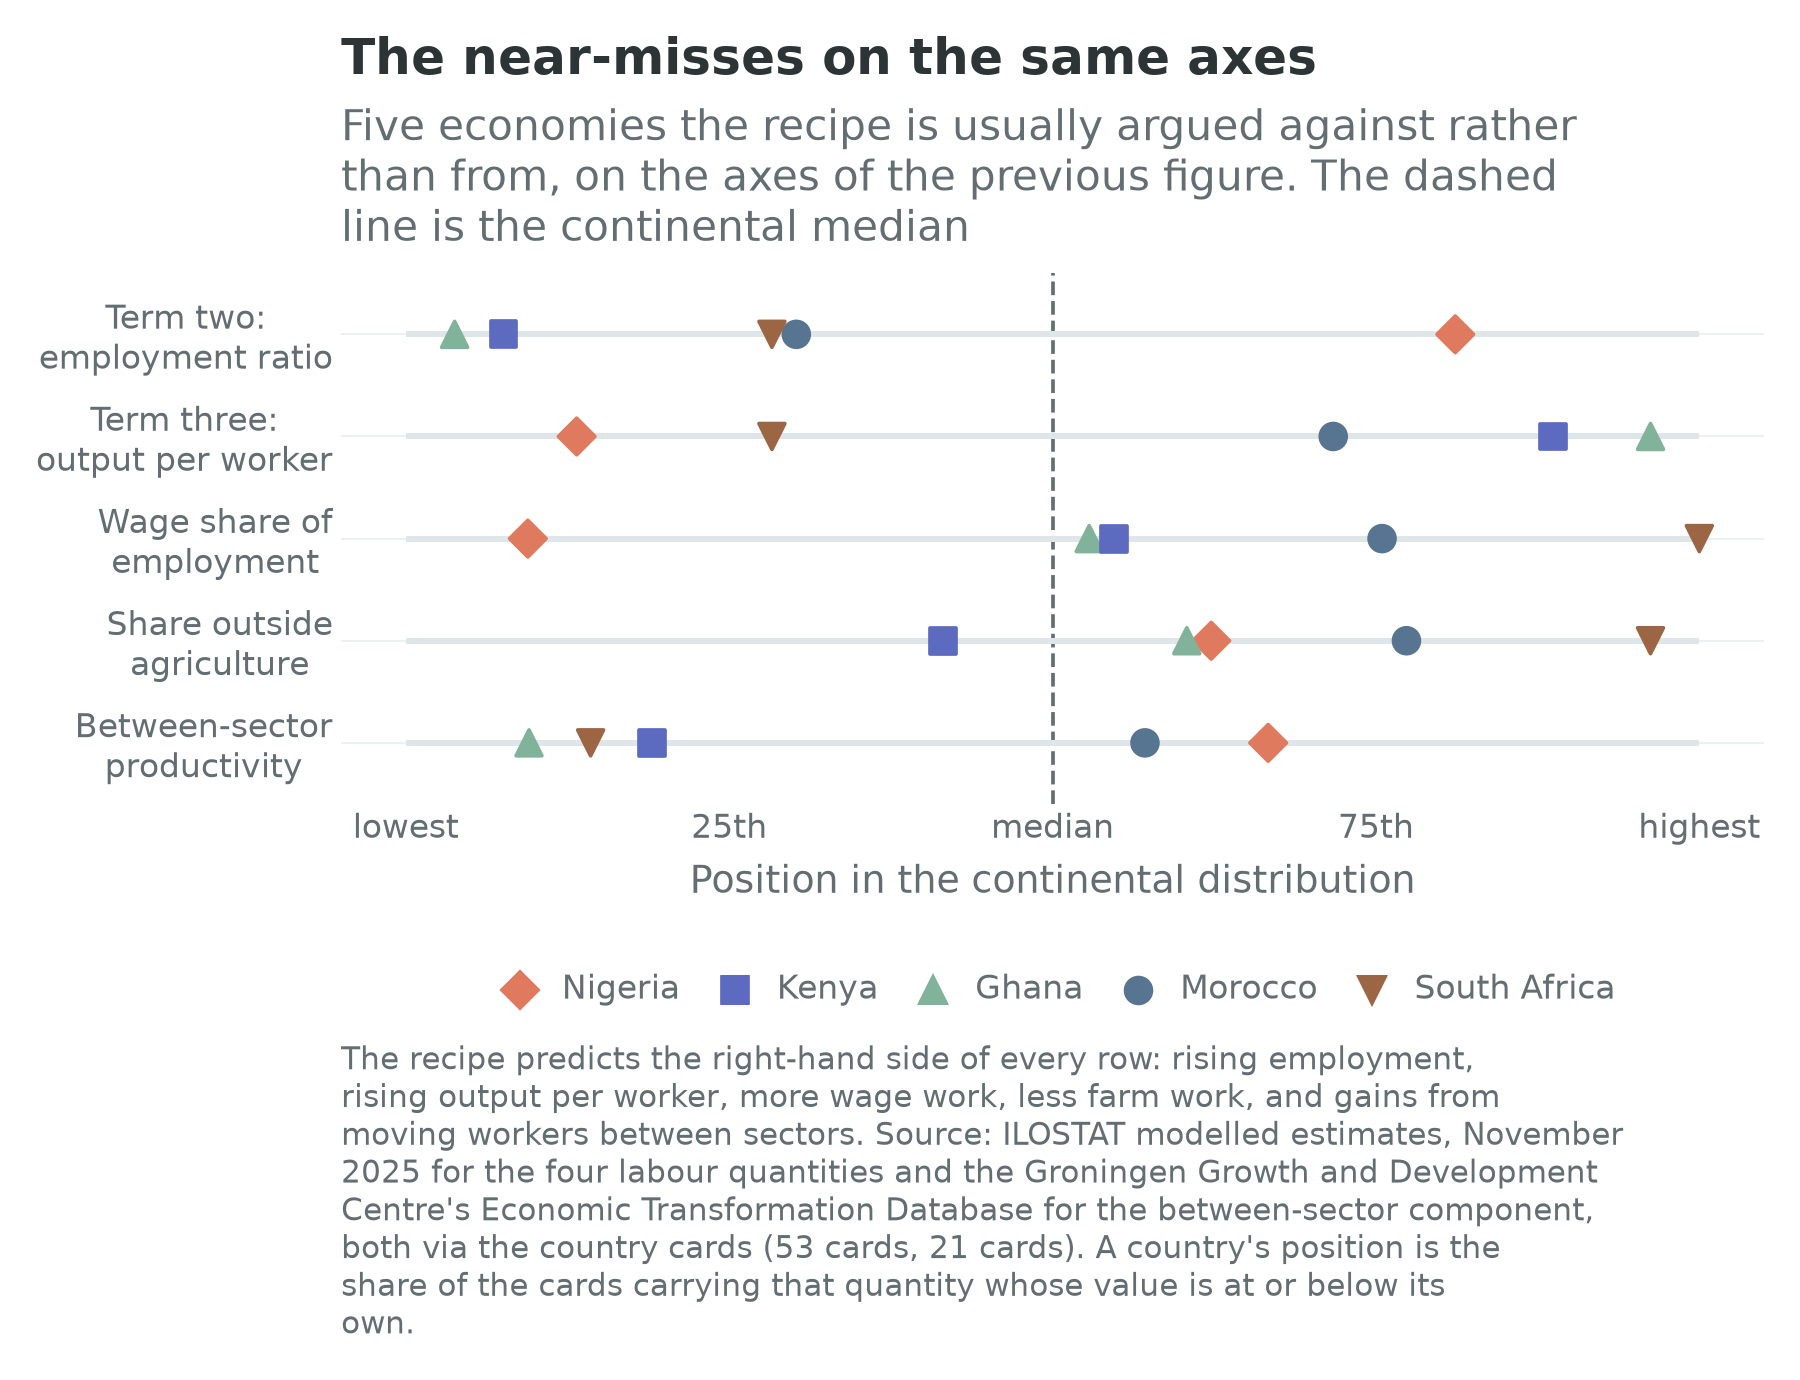
Three readings.
Ghana and Kenya are the sharpest evidence that a services-led route delivers the third term and not the second. Ghana’s output per worker grew at 3.48 percent a year, third of the fifty-three, while its employment ratio fell at 1.56, fifty-second; Kenya’s grew at 2.84, seventh, while its ratio fell at 1.17, fiftieth. Both did it with a negative between-sector component, minus 0.71 and minus 0.07: the movement of workers between sectors subtracted from productivity while firms inside sectors improved. That is the exact opposite of the recipe’s second ingredient, in the two best-measured growth stories in their neighbourhoods.
Nigeria is what happens when the second ingredient is attempted without the export test. Six decades of import-substituting industrial policy, backed by oil rents and an exchange rate that made imports cheap and exports uncompetitive, produced a country whose output per worker fell at 1.94 percent a year over the decade, forty-seventh of fifty-three, while its employment ratio rose at 0.29 and its wage-employment share stands at 13.6 percent, forty-ninth. People worked more and produced less. Chapter 24 carries the pole and Chapter 15 the manufacturing argument; the point here is that Studwell is right about which half of the policy does the work.
Morocco and South Africa are the two African programmes that did apply the export test, and they are the chapter’s most uncomfortable evidence. Chapter 28 calls the Moroccan automotive cluster the clearest African test of manufacturing-led growth: a supplier base built from nothing in twenty years, behind a port fourteen kilometres from the European market, with support conditional on production for export. Chapter 25 calls the South African Automotive Production Development Programme the longest-running export-disciplined industrial policy on the continent, in which an assembler’s credits rise with the value it adds locally. Both raised the third term relative to their neighbours, Morocco to 1.88 percent a year and South Africa, in an economy otherwise contracting per worker, to a within-sector component of 0.39. Neither moved the second term: both post minus 0.45, indistinguishable to two decimal places. If export discipline is the recipe’s active ingredient, the two African economies that have run it longest have bought productivity and not jobs. That is the finding this chapter hands to Chapter 15, and the strongest thing the cards say against the recipe as a jobs strategy.
5. Ingredient one, where there is no landlord to reform against
The first ingredient is the one that travels worst, and the reason is political rather than agronomic. East Asian land reform worked because there was something to reform. Korea, Taiwan and Japan in the late 1940s had dense rural populations, a landlord class holding a large share of the arable land, and tenants paying rents of a size that made redistribution transformative. Breaking that class raised output, because owner-cultivators farm more intensively than tenants, and it removed from politics the group with the strongest interest in blocking industrialization. The second effect is at least as important as the first, and it is the one most readings of Studwell miss.
Most of Sub-Saharan Africa has neither condition. Land is held predominantly under customary tenure, administered by chiefs, lineages and local authorities rather than by title; holdings are already small and comparatively equal among cultivators; and there is no rentier landlord class whose destruction would release either output or political space (Boone, 2014). The binding constraints are yields, inputs, extension and the security a farmer needs before planting a tree, and Chapter 11 takes those up. Where an African state has faced something resembling the East Asian problem, it has been because of settler agriculture rather than indigenous landlordism, in a much smaller set of countries.
The four cases are instructive precisely because none of them ran a Korean land reform.
Ethiopia abolished landlordism in 1975 and has never restored a land market. All rural land is state property, held under usufruct rights that cannot be sold and can be rented only under restriction, with certification programmes since the late 1990s giving households documentary evidence of use rights rather than ownership. The result is genuinely egalitarian and genuinely constraining: no landlord class, no land collateral, and holdings that fragment with each generation. Chapters 22 and 29 carry the consequences. The point here is that Ethiopia has had the recipe’s first ingredient in a strong form for half a century, and its within-sector gains came with the continent’s sharpest fall in the employment ratio.
Rwanda did the nearest thing to a modern first ingredient, and did it administratively. Between 2009 and 2013 the state demarcated and registered essentially every parcel in the country, on the order of ten million of them, in what is generally reckoned the fastest and cheapest national land-registration programme attempted anywhere. Ali, Deininger and Goldstein (2014) evaluated the pilot and found higher investment in soil conservation, with the largest effects among female-headed households, which is the mechanism a tenure programme is supposed to produce. Alongside it ran the Crop Intensification Programme, consolidating fragmented plots into single-crop blocks, and the imidugudu villagization policy that moved dispersed households into grouped settlements. All of this was compulsory in ways a reader should not skate past: Ansoms (2009) documents a rural policy built around an elite vision of a modern farm and imposed on households whose own risk management ran the other way. The between-sector component of 3.43 percentage points a year is that policy working, and the coercion is the price on the ticket.
Kenya ran the continent’s longest individual-titling programme and is the standing warning against expecting too much from it. Registration began under late-colonial policy in the 1950s and has been pursued ever since, and the recurring finding is that title alone did not deliver the credit access or the investment promised for it, because informal and family claims persisted underneath the register and because banks would not lend against smallholdings anyway. Kenya’s second term of minus 1.17 percent a year is not caused by its land policy, but a country that has titled for seventy years and posts the fiftieth-worst employment ratio of fifty-three is evidence that title is not the binding constraint.
Zimbabwe is the one African case with a landlord class to reform against, and it reformed against it. The fast-track programme from 2000 transferred most large-scale commercial farmland, on the order of 150,000 households receiving land, in the only redistribution at African scale in the period. The long-run evidence is more mixed than either the collapse narrative or the vindication narrative allows: Scoones and others (2010) found substantial production and accumulation on the resettled land, alongside an aggregate collapse in commercial output, exports and the banking system’s collateral base. What the case establishes is narrower. Land reform of the East Asian kind is possible in Africa where there is a landlord class, and its economic result depends on whether the state can also supply the inputs, the finance and the market access the displaced system was supplying. Zimbabwe’s could not.
The honest summary is that the recipe’s first ingredient has to be re-specified for this continent, and that Studwell’s African version does re-specify it, as smallholder yields rather than redistribution. That is a fair adaptation, and what it gives up is the political half of the original mechanism, which was doing much of the work.
6. Ingredient two, and the lease it runs on
The second ingredient is where the recipe makes its money and where the objections concentrate.
Start with what is right about it. The mechanism is a subsidy contingent on an outcome that a foreign buyer has to be willing to pay for, which is the only industrial-policy test a state cannot administer to itself. Chapter 25’s automotive programme and Chapter 28’s Moroccan cluster are the two African instances at scale, and Ethiopia’s industrial parks were built on the same logic, with a public estate offering power, customs and serviced land to firms producing for export. Then the three problems.
The first is that the market access is a lease, not a property. The African Growth and Opportunity Act, enacted in 2000, gave duty-free access to the American market for apparel and other goods, and it is the single largest reason there is an African cut-and-sew industry at all. Ethiopia was removed from it on 1 January 2022 over the conduct of a war, and Chapter 29 records what that did to the parks in a single year; the preference then lapsed for every remaining beneficiary at the end of 2025, and Chapter 33 takes up what replaces it. A development strategy whose terminal market is renewed by a foreign legislature every few years is not a strategy in the sense the recipe requires; East Asian exporters had Cold War market access nobody was going to withdraw. This is the sharpest part of the critique Kim (2026) presses.
The second is that the manufacturing rung is lower than it was. Rodrik (2016) showed that manufacturing employment now peaks earlier and at a lower share of the workforce than it did for the early industrializers, so that developing countries begin to deindustrialize at income levels far below those at which Britain or Korea did. Diao, McMillan and Rodrik (2019) put the African version directly: the growth boom of the 2000s was structurally unlike East Asia’s, driven by domestic demand, public investment and reallocation into services rather than by workers moving into tradable industry, which is why it did not compound. Underneath it sits the dual-firm finding that Chapter 6 owns and this chapter will not write twice (Diao, Ellis, McMillan and Rodrik, 2021). The recipe is entitled to one qualifier: Kruse, Mensah, Sen and de Vries (2023) find manufacturing employment shares rising again across the developing world in the 2010s, including in Sub-Saharan Africa, though concentrated in small and largely informal firms.
The third is that there may be substitutes. Newfarmer, Page and Tarp (2018) argue that a set of activities they call industries without smokestacks, horticulture, tourism, transport and logistics, and tradable business services, share manufacturing’s useful properties: tradability, scale economies and technology absorption. If so, the recipe’s second stage is a category rather than a sector, and Kenya’s flower industry is the second stage rather than a substitute for it. The cards give that argument a hard time. Ghana and Kenya are the continent’s clearest services-led growth stories and they hold the fifty-second and fiftieth places of fifty-three on the employment ratio. Tradable services are real, and on this evidence they have not yet been an employment escalator at the scale term two needs.
Set against all of that, one fact should keep the second ingredient on the page. Mauritius did it. From 1970 the island built an export processing zone in textiles and clothing on top of a guaranteed European sugar quota, under a segmented labour arrangement that let export firms hire, overwhelmingly women, at wages below the protected domestic sector, and it converted a monocrop colony into the second-richest economy on the continent (Subramanian and Roy, 2003; Frankel, 2010). The quota system it exported into no longer exists, the wage arbitrage is gone, and its working-age population is now shrinking. It remains the one African case where the second ingredient ran to completion, and the reason the recipe deserves to be taken seriously rather than dismissed.
7. Ingredient three, from directed credit to the offshore centre
The third ingredient asks whether a financial system serves the first two or serves itself. The four cases give four answers, two of which are not the recipe’s.
Ethiopia is the recipe’s version, and it shows the bill. For most of the past two decades the state allocated credit and foreign exchange directly: a development bank funding parks, sugar estates and state enterprises; private banks required from 2011 to buy central-bank bills equal to 27 percent of every new loan they disbursed, at a rate well below inflation, with the proceeds passed to that bank; a closed capital account; and a rationed currency. That is financial repression as a development instrument, in the form the recipe describes. The results are the ones in Table 9.1. The costs are documented in Chapter 29: private firms starved of both credit and dollars, a queue for foreign exchange that became the binding constraint on the parks the same policy had built, and a reversal in 2024 when the currency was floated and the banking system opened. The lesson is not that directed credit failed. It is that a leash has to be attached to the export test, and Ethiopia’s was attached to the plan.
Rwanda points capital without repressing it. The instruments are party-owned and military-linked holding companies that take the anchor position in sectors nobody else will enter, which Booth and Golooba-Mutebi (2012) called developmental patrimonialism: rents centrally managed for growth rather than distributed for loyalty, inside a coalition with a long horizon. The administrative machinery around it, the imihigo performance contracts signed annually by every ministry and district, and the monthly umuganda work day, is what makes the state’s writ run to the hill. Chapters 26 and 31 carry the settlement and its risks, the succession above all. This is the third ingredient achieved by ownership rather than by regulation, and it produced the only fully positive column in Table 9.1.
Mauritius is the anti-recipe, and it worked. After the textile phase the island built a Global Business sector on a network of double-taxation treaties, of which the Indian treaty of 1982 was by far the most valuable, making Mauritius for three decades the largest recorded single source of foreign direct investment into India until the treaty was renegotiated in 2016. That is finance developed as an export industry in its own right, which is exactly what Studwell’s third ingredient warns against, and it is a large part of how Mauritius reached $12,977 a head. Two caveats belong beside it: a treaty-based offshore centre only works if few others copy it, so it is not a recipe, and it is fragile in the way the 2016 renegotiation demonstrated, because the business depends on another sovereign’s tax code.
Botswana is the resource-rent variant, and the case this chapter ends up taking most seriously. Diamonds are mined through Debswana, a joint venture owned in equal shares by the government and De Beers, under agreements that in 2013 moved rough-diamond sorting and sales from London to Gaborone. The revenue, counted in pula, symbol P, the currency whose name is the Setswana word for rain, is governed by a fiscal rule requiring mineral income to be spent on investment rather than recurrent consumption, and the residual accumulates in the Pula Fund, established in 1993, named for the currency and the first sovereign wealth fund in Africa. Over the three decades after independence this arrangement produced growth of close to 9 percent a year, one of the fastest sustained runs anywhere in the world (Acemoglu, Johnson and Robinson, 2003).
Notice what it bought and what it did not. It bought income, at $7,662 a head, and wage employment, at 71.9 percent of all employment, seventh on the continent, in a state whose payroll and parastatals are the largest employer. It did not buy productivity growth: output per worker fell over the decade and the within-sector component over the longer window is the second worst of the twenty-one measured. And it has not solved the youth problem: 38.0 percent of young Botswanans are not in employment, education or training, tenth highest of the forty-eight cards carrying the measure. Botswana is a state that learned to bargain over a rent and to save the proceeds, which is a real and rare achievement, and not the recipe.
8. The critics, and where this book stands
Premature deindustrialization is the shadow, and it is real but not fatal. Rodrik (2016) is about the height of the rung, not its existence, and a ladder with shorter rungs is still a ladder: Mauritius, Morocco and, for a decade, Ethiopia climbed some of it. What the finding does establish is that no African country will employ the share of its workforce in manufacturing that Korea did, so a strategy promising to absorb the annual entrant cohort into factories is promising something the world no longer supplies.
The growth-without-jobs critique is the one the cards support most directly. The correlation of minus 0.27 between terms two and three is what that critique looks like from the inside. Opalo (2026a) states the forward-looking version, that many countries will struggle to turn another year of growth into reliable jobs. Chapter 10 reads the historical record country by country.
Mkandawire’s objection cuts the other way and deserves more attention than it gets. Mkandawire (2001) argued that the African developmental state was declared impossible on the basis of a very short and very unusual sample, and that the conditions under which African states were asked to develop, debt crises and imposed structural adjustment above all, would have defeated the East Asian states too. Korea in 1975 was not being told to liberalize its capital account. The African record is therefore not a clean test of state capacity.
Lin’s new structural economics is the constructive rival. Lin (2012) accepts the case for industrial policy and disciplines it differently: a state should back sectors that are latent comparative advantages given its endowment structure, identified by benchmarking against a country with a similar structure and roughly twice the income, rather than sectors it wishes it had. The flying-geese corollary is that as Chinese wages rise, labour-intensive manufacturing relocates, and Lin has argued at length that the tens of millions of manufacturing jobs China holds are the opportunity African policy should be organized around. Studwell and Lin agree on more than either emphasizes: both want the state to pick, and both want the pick tested against a market. They disagree about whether the test is current comparative advantage or export performance in a sector entered ahead of advantage, and the Ethiopian apparel programme was an experiment in the second.
The Ethiopian scholarship should be read alongside the recipe rather than against it. Oqubay (2015) is the fullest account of Ethiopian industrial policy written from inside it, and the volume he edited with Lin extends the industrial-hub argument across countries (Oqubay and Lin, 2020); the Oxford handbook on the Ethiopian economy (Cheru, Cramer and Oqubay, 2019) is where the sceptical and the sympathetic readings sit together. Cramer, Sender and Oqubay (2020) make the broader argument this book has sympathy with, that the useful questions are about specific sectors, firms and labour markets rather than about models, and their insistence that agricultural wage labour rather than the smallholder household is the underrated engine is a direct challenge to the recipe’s first ingredient.
The complexity view says the recipe understates the distance. Hidalgo, Klinger, Barabási and Hausmann (2007) and the work that followed argue that what a country can produce next is constrained by what it produces now, because capabilities are combinatorial and mostly tacit. African export baskets sit in a sparse region of that space, so the jump from raw commodities to complex manufactures is long and there are few intermediate products to step through (Hausmann and others, 2014). Read one way this is fatalism; read another, it is the strongest argument for exactly the state-coordinated entry the recipe proposes, since a country in a sparse neighbourhood will not walk out of it by improving its business environment.
Where this book stands. Three positions, stated so they can be argued with.
The recipe is right about sequencing and right about the export test, and the export test is the part of it African policy has most consistently failed to apply. Chapter 24’s pole is the demonstration.
The recipe is weakest exactly where its own African cases are weakest, which is the middle ingredient. Two of the four, Botswana and Mauritius, did not run it in the decade this book measures, and the two African economies that have run export discipline longest, Morocco and South Africa, delivered the third term and not the second. A recipe whose active ingredient produces productivity without employment is a productivity recipe, and a continent adding twenty-seven million people of working age a year needs both.
And the four cases are a small and unusual sample: two microstates, and two party-states. That is the transferability objection in its second form, and the right response is not to abandon the recipe but to stop arguing it from four cases when fifty-four cards are available, which is what Table 9.1 and Figure 9.2 are for.
9. What the experiments say
Does export discipline actually teach a firm anything?
The recipe’s second ingredient rests on a mechanism, learning by exporting, that is notoriously hard to identify: good firms export, so exporters look better than non-exporters whether or not exporting made them so. One study broke that.
Atkin, Khandelwal and Osman (2017) worked with rug producers in Fowa, Egypt, and randomly allocated export orders to high-income markets through an intermediary. Treated firms earned profits 16 to 26 percent higher than controls, and the effect was not only a demand effect: the quality of their output rose, measured on rugs made to a common specification, and the improvement persisted. Firms learned to make better rugs because a foreign buyer made them. That is the recipe’s central mechanism, observed under randomization, in the labour-intensive sector the second ingredient is about.
The labour side is not free. Blattman and Dercon (2018) randomized offers of Ethiopian factory work against a cash grant and a control, and Blattman, Dercon and Franklin (2022) followed the same people for five years. Chapter 29 carries the findings into the Ethiopian argument, so they are not restated here. The one sentence that belongs in a chapter about the recipe is that the factory job was not obviously better than what the worker already had, which is a problem for a strategy whose whole promise is that the rung is worth standing on.
Management is a real constraint, and it does not fix itself. Bloom, Eifert, Mahajan, McKenzie and Roberts (2013) gave free management consulting to randomly chosen Indian textile plants and measured productivity gains of about 17 percent within a year, from changes as mundane as recording defects and sweeping the floor. That is the comparison case: a large, cheap gain inside firms in a country that already had a manufacturing sector. The African replications are more sobering. Karlan, Knight and Udry (2015) offered consulting and capital to microenterprise tailors in Ghana and found improvements in practice that firms abandoned once the consultants left, with no lasting effect on profits. McKenzie and Puerto (2021) trained female entrepreneurs in Kenya and found gains in sales and profits that did not come at the expense of untrained competitors in the same markets, the more encouraging African result and a much smaller effect than in India.
Put the four together and the pattern fits the argument above. The mechanism the recipe relies on is real and demonstrable, and the firms that would have to carry it in most of Africa are much smaller than the ones in which it has been demonstrated: what works on an Indian textile plant does not survive contact with a two-person tailoring shop. The recipe needs firms of a size Africa does not yet have, which is the missing middle of Chapter 6 stated as an industrial-policy problem.
10. The recipe in two worlds
Chapter 1 set out the assumption underneath the identity and the world in which it fails: one in which the frontier of production is a stock of machines and energy rather than a stock of workers, so that the marginal worker stops being what growth is made of. No part of this book is as exposed to that assumption as this chapter.
The recipe is a labour-abundant-world recipe in the strict sense: every rung of it is a way of getting somebody to pay for unskilled labour. The first ingredient pays for it in the field, by making a household’s own hours worth more per hectare. The second pays for it in the factory, by selling the embodied hours to a foreign buyer at a price that reflects how cheap they are. The third arranges the financial system so that capital keeps buying those hours instead of buying property. Take away the world’s willingness to pay for unskilled hours and the second rung goes first, because cut-and-sew apparel, the entry-level assembly line and the labelling desk are the tasks a machine takes earliest. Ethiopia has already had that rung removed once, by a political decision rather than by a robot, and Chapter 29 describes the year it took.
The first and third ingredients survive better, for different reasons.
The first survives because food is a physical need that a model cannot satisfy and because the sun, the water and the land it uses are the assets Chapter 1 named as holding their value when the frontier stops needing workers. What changes is the labour intensity: high-yield agriculture in the second world looks more like capital-intensive irrigated production for export than like a household farming two hectares by hand, which converts the first ingredient from an employment strategy into a rent.
The third survives, and arguably matters more, because its subject is who controls the allocation of capital. If productivity is bought rather than built, as Chapter 1 argues it becomes, the question of whether a country can develop turns into the question of the terms on which it can rent compute, licence models and buy machines, and of whether the return stays on an African balance sheet. A state that can point capital is better placed to answer that than one that cannot.
So what would a recipe for the second world contain? Four things, and none of them is a factory. Land, because it feeds people and hosts the panels. Energy, because the binding constraint on compute is turning out to be electricity rather than chips, which is why Chapter 14 is an energy chapter and not a climate chapter. Minerals, because the machines are made of the cobalt, copper and manganese of Chapter 13. And, holding the other three together, the state’s capacity to bargain over the rents they produce and to convert those rents into income for people who are not employed in producing them.
That reads like Botswana, not like Ethiopia, and the comparison is exact rather than rhetorical. Botswana took a single high-value mineral, negotiated an equal-shares arrangement with the world’s dominant buyer, moved a piece of the value chain onshore, wrote a fiscal rule that kept the proceeds out of recurrent spending, and distributed the result through a wage economy, all with a working-age population growing at 1.78 percent a year and output per worker falling. That is the shape of a second-world development bargain: a rent, a fiscal rule and a distributive mechanism, with no productivity growth in it at all.
Two cautions keep the comparison honest. An economy that does not raise output per worker cannot keep raising incomes once the rent stops growing, and 38.0 percent of Botswana’s young people are already outside work, education and training. And a rent economy of this kind is available to a country of 2.5 million people holding a scarce mineral in a way it is not available to one of 233 million. The recipe’s problem in the second world is that its best ingredient stops working; Botswana’s is that its model was never meant to be scaled. Chapter 35 carries both as scenario branches, and Chapter 10 asks the question underneath them, which is what employment is for when output no longer needs it.
Connections to Other Chapters
- Chapter 4 (The Case and the Counter-Case) introduces the recipe and its four cases and hands this chapter the transferability critique; Chapter 5 (States, Political Settlements, and Development Bargains) supplies the vocabulary in which the third ingredient is a question about who controls capital.
- Chapter 6 (The Informal Economy) owns the dual-firm finding and the missing middle that the experiments box ends on; Chapter 10 (Labor, Youth, and Migration) reads the second term country by country with the survey coverage attached.
- Chapter 11 (Agriculture and Agribusiness) carries the yields, inputs and extension that the first ingredient becomes on this continent; Chapter 22 (Land) carries tenure, registration and the urban half.
- Chapter 15 (Manufacturing and the Auto Industry) inherits this chapter’s hardest finding, that the two African export-disciplined programmes delivered the third term and not the second, and Chapters 25 and 28 (Gauteng; Casablanca-Tangier) are those two programmes.
- Chapter 29 (Addis-Djibouti) carries Ethiopia: the parks, the currency, the trade preference and the factory-jobs evidence. Chapter 31 (Where the State Is Thin) carries the Rwandan settlement and its regional costs.
- Chapters 13, 14 and 35 (Critical Minerals; Energy; Scenarios) carry the second-world recipe this chapter sketches: minerals, electrons and the bargaining capacity to hold the rent.
Discussion Questions
The recipe predicts that terms two and three rise together; across the fifty-three cards carrying both they are negatively correlated at about minus 0.27, and the ten fastest term-three economies have the worst median second term. Give the strongest reading of that correlation under which the recipe survives, then the strongest reading under which it does not, and say what a decade of data would have to look like for one to defeat the other.
Botswana ran none of the three ingredients and is the fourth-richest country on the continent; Ethiopia ran two of them with unusual seriousness and has the continent’s lowest employment-ratio growth. A colleague concludes that the recipe is not a recipe but a description of countries that were going to succeed anyway. Construct that argument properly, then answer it using the identity rather than an appeal to history.
This chapter argues that the first ingredient loses its political half when it is re-specified from redistribution to yields, because there is no landlord class to break. Suppose you accept that. Name the group in a specific African country whose interests the recipe’s second stage would have to override, and say what evidence would tell you whether a government had overridden it.
Try It
Open the three cards side by side: Ethiopia, Rwanda and Mauritius, which is the recipe at its start, in its middle and at its end. Read down the identity block first, then the overlays, then the data-quality block. Write one paragraph on a single question: Rwanda’s column looks like the recipe working and Ethiopia’s looks like it failing, and Ethiopia grew faster over the decade than Rwanda did. Which would you rather be governing in 2035, and which field on the cards, rather than which argument in this chapter, is doing most of the work in your answer? Then note that Ethiopia’s confidence flag is low and the other two are not, and say what that does to your confidence in the comparison.
Data Exercise
Download all fifty-four cards from the country cards page on this site, as cards.csv if you work in a spreadsheet and cards.json if you want the release each number came from travelling beside it. Build a table with six columns: identity.employment_to_wa_growth, identity.output_per_worker_growth, overlays.wage_employment_share, overlays.nonag_employment_share, overlays.output_per_worker_between and scale.gdp_per_capita. Then do four things. First, take every card with a wage-employment share above 40 percent, report the median of identity.output_per_worker_growth for that group and for the rest, and say in two sentences whether the answer supports the recipe or fails it. Second, do the same cut on identity.employment_to_wa_growth and explain why the two behave so differently. Third, reproduce this chapter’s four countries with a positive second term and a third term above 2 percent, and see what happens to that list at thresholds of 1 percent and 3. Fourth, rank the twenty-one cards carrying overlays.output_per_worker_between and say whether the countries at the top are the ones the recipe literature writes about. Note which fields are null rather than zero, and never impute a null as a zero.
Data Sources and Further Reading
Key data sources
- UN World Population Prospects 2024, medium variant: term one, ages 15 to 64 throughout.
- ILOSTAT modelled estimates, November 2025: terms two and three and the wage-employment, non-agricultural and youth overlays on 53 of the 54 cards. Term two is modelled employment aged 15 and over divided by the working-age population aged 15 to 64.
- IMF World Economic Outlook, April 2026: output levels, income per head, observed growth and the five-year forecast.
- Groningen Growth and Development Centre, Economic Transformation Database: the within-and-between split of term three, over 2008 to 2018, on the 21 African countries it covers.
- National statistical offices and the book’s data-quality table: census, survey and confidence fields.
Further reading
- Joe Studwell, How Asia Works (2013) and How Africa Works (2026), the argument this chapter tests, with Oliver Kim’s review (Kim, 2026) for the transferability critique in its sharpest form.
- Arkebe Oqubay, Made in Africa (2015), for Ethiopian industrial policy written from inside it, and Christopher Cramer, John Sender and Arkebe Oqubay, African Economic Development (2020), for the case that the useful questions are about sectors, firms and labour markets rather than models.
- Justin Yifu Lin, New Structural Economics (2012), for the comparative-advantage-following rival, and Richard Newfarmer, John Page and Finn Tarp, eds., Industries without Smokestacks (2018), for the services-led alternative.
- Thandika Mkandawire, “Thinking About Developmental States in Africa” (2001), for why the African record is not a clean test.
- Ian Scoones and others, Zimbabwe’s Land Reform: Myths and Realities (2010), for the one African land reform at East Asian scale, and Catherine Boone, Property and Political Order in Africa (2014) for why the East Asian precondition is mostly absent.
- The African Center for Economic Transformation’s African Transformation Report series (ACET, 2021), for the agenda as African institutions have written it.