25. Gauteng and the Southern Cone
Pole type: productivity platform.
Learning Objectives
After reading this chapter, you should be able to:
- Place the Johannesburg, Pretoria and Ekurhuleni city-region in the book’s identity, and explain why South Africa inverts the continental pattern: a modest first term, a negative second, and a third that has to carry the case.
- Read the pole as a hegemon-and-hinterland system rather than a country, using the seven cards of the Gauteng block and the corridors that reach the sea at Durban, Richards Bay and Maputo.
- Say what South Africa’s balance sheet looks like once the currency of the debt is separated from the residence of the creditor, and why the state-owned electricity and freight companies are the fiscal object that matters.
- Run a growth diagnostic on the pole: name the branch this chapter argues binds, the branches it sets aside, and the evidence that would overturn the ranking.
- Explain why South Africa is the one African economy in which the labour-redundant world of Chapter 1 has partly arrived, and what that does to the phrase “productivity platform”.
Prior work: the Maputo Corridor and Trans-Kalahari corridor table, and the regional-hegemon framing used here, are set out at length in the companion volume, The New Regional Economics, chapter 14 (Wilse-Samson, 2026). This chapter cites that table rather than restating it, and adds what the volume does not have: the identity, the balance sheet and the diagnostic.
Gauteng occupies 1.5 percent of South Africa’s land area, holds about 15.1 million people, and produced 33.2 percent of the country’s output in 2024 (Statistics South Africa, 2025). South Africa in turn is the largest economy on the continent, at $427.1 billion, which is 13.6 percent of African output produced by 4.2 percent of African people. Put the two together and you have the fact this chapter is about: roughly one African dollar in twenty is earned on a highveld plateau about 500 kilometres from the nearest port, and it reaches the sea down three corridors, to Durban, to Richards Bay, and east across the Lebombo mountains to Maputo.
That last corridor is the one to hold on to. The Maputo Corridor is the shortest route from the industrial core of Southern Africa to blue water, and it runs through a different country, with a different currency, a different customs administration and, since late 2024, a different order of political risk. A pole that must leave its own jurisdiction to reach the cheapest port makes visible what a national account hides: the platform is regional rather than South African, and the parts of it that work best are frequently the parts the South African state does not run.
The chapter’s argument, stated at the front so a reader can watch it being tested, is this. Gauteng is a productivity platform in the precise sense that its comparative advantage lies in the third term of the identity and not in the first two. It has the deepest capital market, the densest firm population and the highest wage-employment share on the continent. It also has the continent’s most severe employment failure, and its measured output per worker has been falling. The productivity platform is not, at present, producing productivity growth. That is the puzzle, and everything after Section 1 is an attempt to say why.
1. The pole in the identity
The seven cards below are the pole and its hinterland: South Africa as the core, Mozambique as the corridor’s far end, and Botswana, Lesotho, Eswatini, Namibia and Zimbabwe, whose labour, customs revenue, electricity and transport routes are entangled with it. As a block they hold 124.4 million people, 8.2 percent of the continent’s, and produce $545.3 billion, 17.4 percent of its output. South Africa alone is 3.6 times the size of the other six put together. That asymmetry is the pole’s central political fact and Section 4 returns to it.
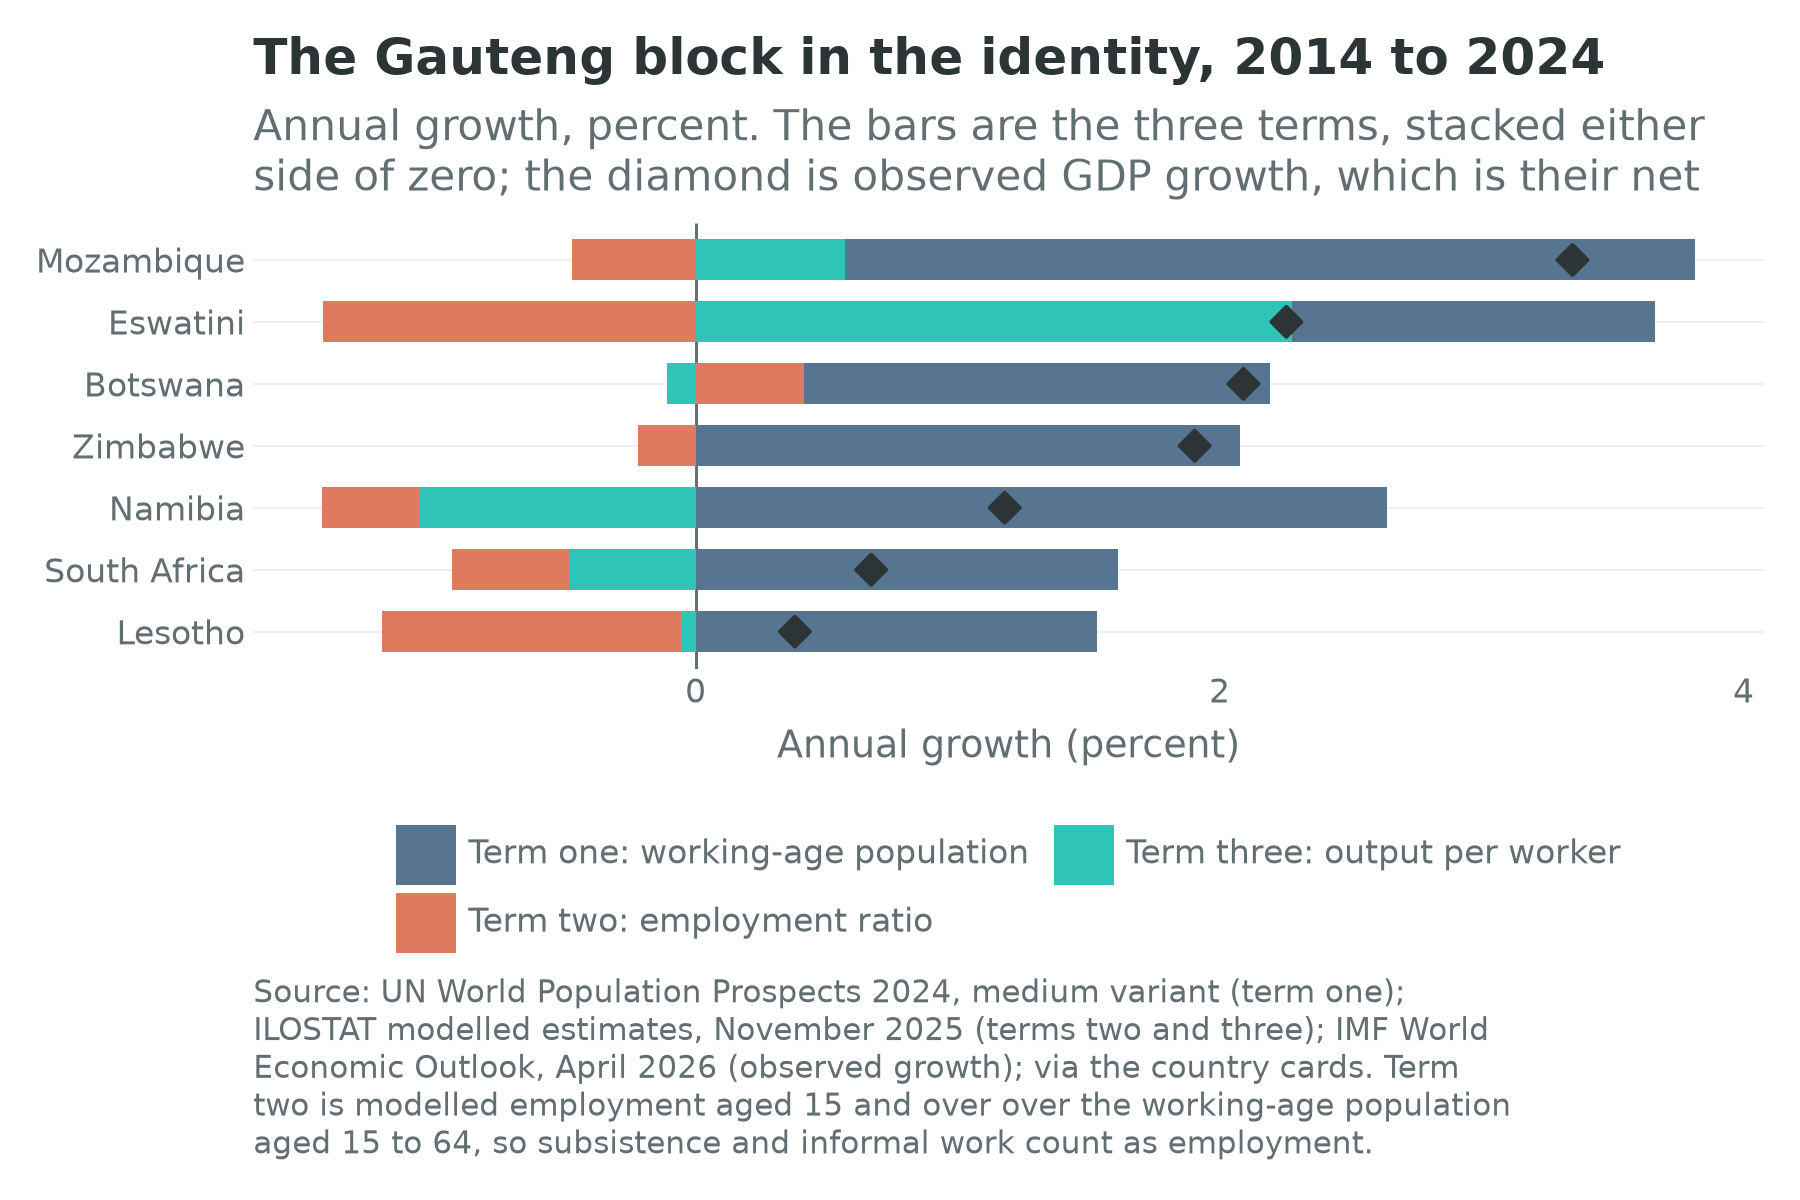
All three terms below are annual growth rates over 2014 to 2024, and they add, to within a rounding error, to observed GDP growth.
| Country | Term one: working-age population | Term two: employment ratio | Term three: output per worker | Implied growth | Observed growth | Gap | Wage employment (percent of employment) | Non-agricultural employment (percent) | Confidence |
|---|---|---|---|---|---|---|---|---|---|
| South Africa | 1.61 | -0.45 | -0.48 | 0.68 | 0.67 | 0.01 | 82.7 | 94.6 | high |
| Mozambique | 3.25 | -0.47 | 0.57 | 3.35 | 3.35 | 0.00 | 14.5 | 26.9 | medium |
| Botswana | 1.78 | 0.41 | -0.11 | 2.09 | 2.09 | 0.00 | 71.9 | 81.9 | medium |
| Lesotho | 1.53 | -1.15 | -0.05 | 0.34 | 0.38 | -0.04 | 61.4 | 68.9 | medium |
| Eswatini | 1.39 | -1.42 | 2.28 | 2.24 | 2.26 | -0.02 | 69.6 | 85.1 | medium |
| Namibia | 2.64 | -0.37 | -1.05 | 1.21 | 1.18 | 0.03 | 63.2 | 77.4 | low |
| Zimbabwe | 2.08 | -0.22 | 0.00 | 1.86 | 1.91 | -0.05 | 29.1 | 44.8 | medium |
Table 25.1. Annual growth rates in percentage points over 2014 to 2024, except the last three columns, which are shares of employment and a flag. The gap is implied growth less observed. Term one is the working-age population aged 15 to 64; term two is modelled employment aged 15 and over divided by that population; term three is the residual output-per-worker series. Sources: UN World Population Prospects 2024, ILOSTAT modelled estimates (November 2025), and the IMF World Economic Outlook (April 2026), via the country cards.
South Africa’s first term ran at 1.61 percent a year, well under the continental median of 2.89 percent across the 54 cards. This is a country whose demographic transition is largely done. Its second term is negative at -0.45 percent, meaning the share of working-age people who are employed shrank over the decade. Its third term is also negative at -0.48 percent. Twelve of the 54 cards carry a negative second term beside a negative third; South Africa is the only one of them that is also the continent’s largest economy. Everything the country produced over the decade in the way of growth came from term one, and term one is the term that requires nothing of anybody.
This is the inversion the chapter’s title is about. In Chapter 24 the demographic engine has a jobs problem because the cohort arrives faster than the firms do; here the cohort has almost stopped arriving, the firms exist, and the jobs still are not there. The two failures look alike in the identity and have nothing in common underneath.
Now the overlays, which stop the second term being read as a compliment. Term two is built from a modelled employment count that includes subsistence agriculture and informal trade, and Chapter 1 warned that the series flatters every country on the continent. It flatters South Africa least, because South Africa has the least informal employment to flatter it with. Of the 53 cards carrying the wage-employment overlay, South Africa’s 82.7 percent is the highest and its non-agricultural share of 94.6 percent is third. Mozambique, across a single border post, records 14.5 percent and 26.9 percent.
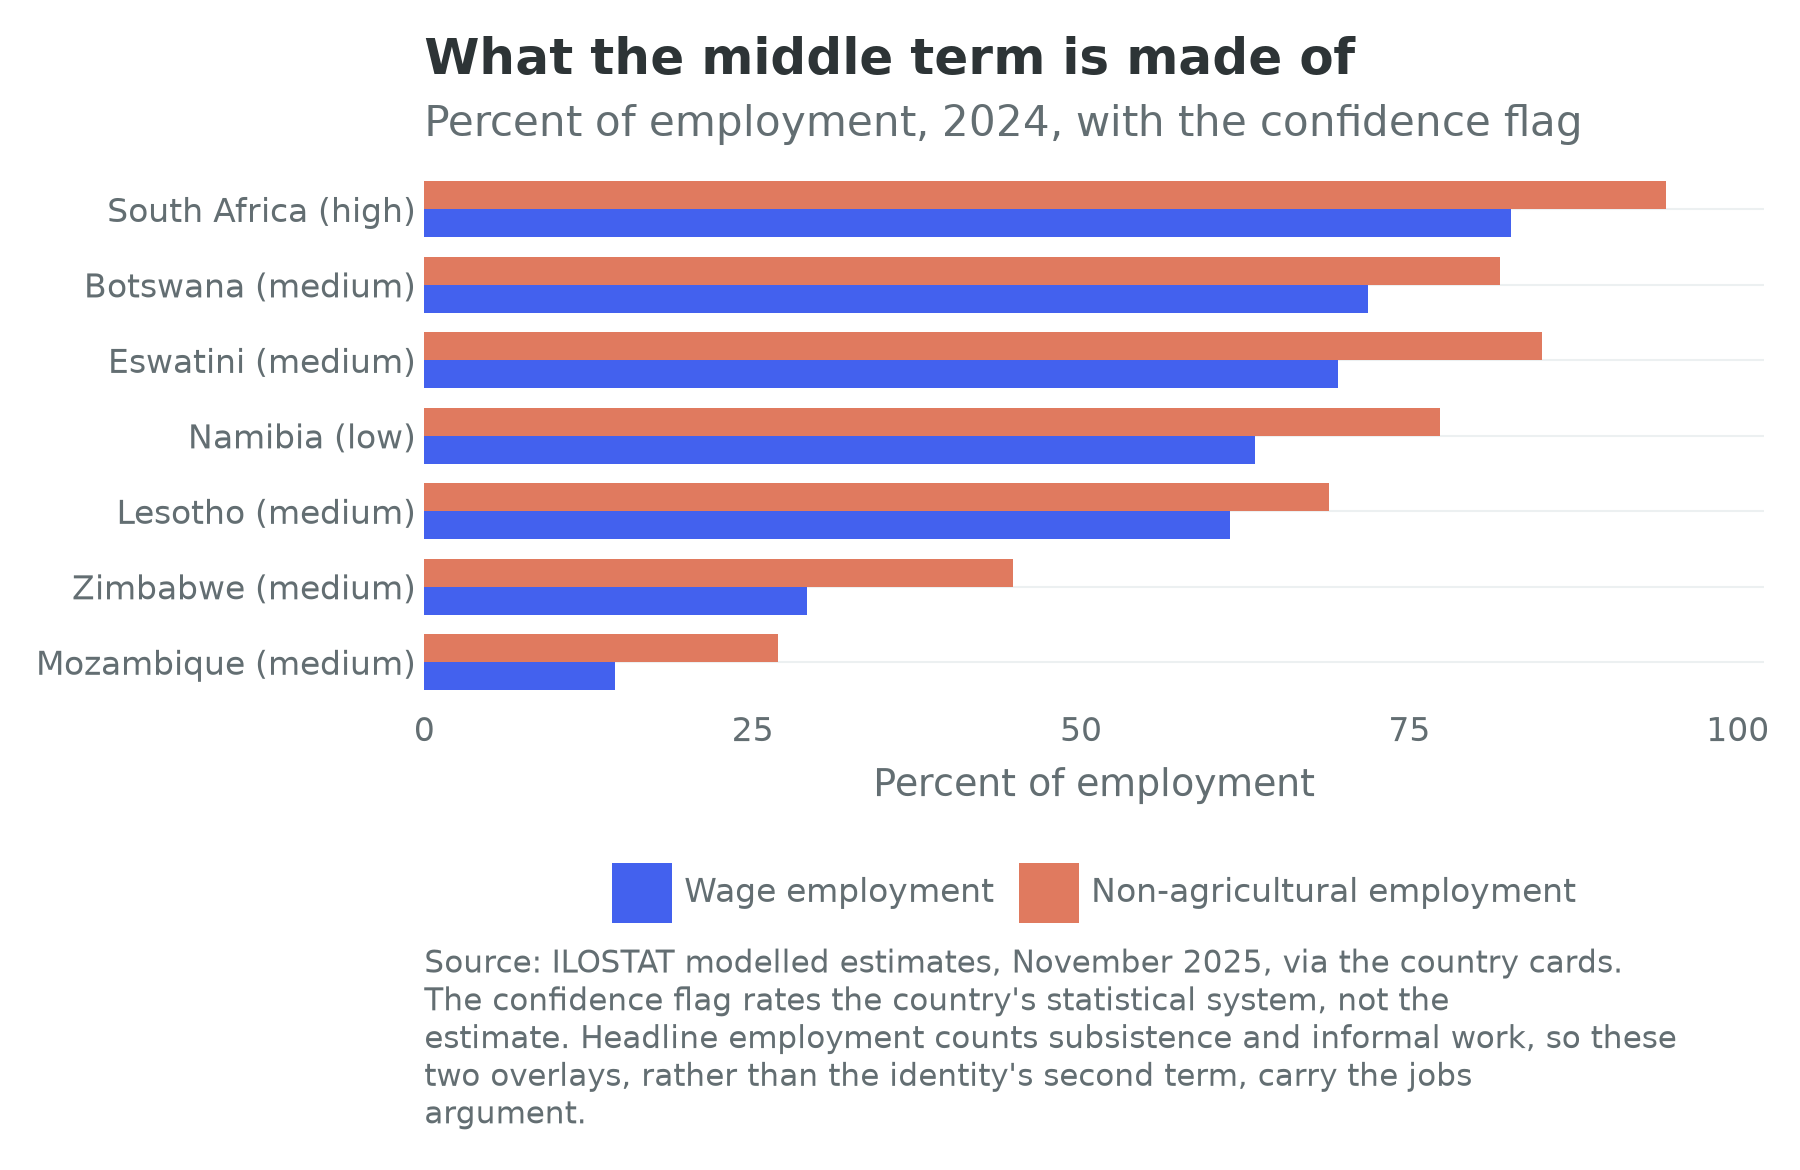
The second term is therefore measuring different objects at the two ends of one corridor. In Mozambique a falling employment ratio says how many people are counted as working on their own land. In South Africa it says how many hold a job with a payslip, and the answer declined for a decade while the working-age population grew. The official unemployment rate was 33.2 percent in the second quarter of 2025, the expanded rate 42.9 percent and the youth rate 46.1 percent (Statistics South Africa, 2025). Those are not informality numbers. They are the numbers of an economy whose unemployed are unemployed in a way a survey can see.
Term three splits, following Chapters 6, 9 and 10, into the part from firms in a sector getting better and the part from workers moving between sectors. On the cards that split runs over 2008 to 2018 and exists for five of the seven. South Africa records within-sector growth of 0.39 percent a year and between-sector growth of minus 0.21 percent. The reallocation term is negative: workers moved on net from higher-productivity activities into lower-productivity ones, the mirror image of the East Asian pattern and the most damning number in this chapter. Mozambique records 2.99 percent within and 0.24 between, which is what an economy looks like when a gas project and a port raise output inside sectors that employ almost nobody. Botswana records minus 1.62 within against 0.38 between, Lesotho 1.41 against 0.38, and Namibia 0.84 against minus 1.12. Eswatini and Zimbabwe carry no split, because the transformation database does not cover them. Two of seven rows in the block’s structural-change story are blank, and the chapter says so rather than filling them.
What “productivity platform” means, in two worlds
Chapter 1 set out the assumption under the identity and the world in which it fails: a world in which the frontier of production is a stock of machines rather than a stock of workers, so that the marginal worker stops being the thing growth is made of. South Africa is the one African economy for which that world is already partly here.
Operationally, that means three things at once. A third of the working-age population that wants work cannot get it, and has not been able to for three decades. The two sectors that dominate the export bill and the market capitalization, deep-level mining and financial services, can raise output without raising employment, and over the past decade they did. And the wage-employment share is the highest on the continent precisely because the informal sector that absorbs the unemployed everywhere else is thin here, a legacy of apartheid-era controls on township enterprise that outlived the regime that wrote them. Output per worker and employment substitute for one another instead of rising together: the dual-firm structure Diao, Ellis, McMillan and Rodrik (2021) found in Tanzania and Ethiopia, arrived at from the other direction, since the problem here is not that the large firms are too productive to hire but that they are almost the only firms.
In the labour-abundant world, “productivity platform” is a strategy: the workers are next door, in Zimbabwe and Mozambique and Lesotho, and the capital, the courts, the electricity and the ports are here, so put them together and the third term compounds. Sections 5 and 6 describe the infrastructure that would take.
In the labour-redundant world the same phrase is a warning. It says: this is what an African economy looks like when the ladder’s middle rungs have gone, when a mine automates a face and the graduates who would have taken the tradable service jobs of the 2010s find those jobs answered by a model. South Africa is not a preview of the whole continent, since no other African economy has its capital stock, but it is the closest thing to a natural experiment in what happens to the second term when the first stops growing and the third is carried by machines. Chapter 35 takes that as a scenario axis; this chapter takes it as a reason to be careful with the word platform.
2. The pole on the balance sheet
The country cards record South Africa’s external debt stock at $175.9 billion, split between $77.4 billion of bonds, $84.1 billion of other private credit, $9.2 billion owed to multilateral institutions and $4.6 billion to bilateral creditors other than the Paris Club. At face value that is among the largest external debts on the continent, and at face value it misleads in two ways.
The first is that “external” here is a statement about where the creditor lives rather than about what the debt is denominated in, and it covers every sector rather than the government alone. The second is that South Africa’s sovereign borrowing is overwhelmingly domestic and in rand. Gross national government debt was about 78.9 percent of GDP in 2025/26, and foreign-currency debt has run at roughly 10 percent of gross loan debt (National Treasury, 2026). A country that borrows in its own currency from its own pension funds and insurers cannot have the kind of crisis Chapter 21 describes for Zambia or Ghana. It can have a slower one, in which debt-service costs crowd out everything else in the budget and the yield curve prices a default that never arrives.
What the correction does not soften is the second-order exposure: non-residents held as much as 42.8 percent of domestic government bonds at the peak, down to about 28 percent by the end of 2021, and borrowing in rand moves the currency risk to the lender without stopping the lender leaving (South African Reserve Bank, 2021).
The China line shows what the book’s debt tracker exists for. South Africa’s card carries $3.3 billion outstanding to creditors in China against $5.5 billion of cumulative commitments in the loan-level database, most of the latter to the electricity utility rather than to the sovereign directly. That is a Chinese claim almost exactly equal to what South Africa owes the twenty-two members of the Paris Club, $3.3 billion, on a card whose external debt is otherwise overwhelmingly private. Mozambique carries $1.4 billion outstanding to China against $2.4 billion of commitments, and Zimbabwe $2.0 billion against $3.2 billion on a total external stock of $14.4 billion, where the Chinese line is 38 percent of everything Zimbabwe owes under a government guarantee. Commitments are not a stock, and Chapter 32 is careful about the difference. In this block the gap between the two sits on the balance sheets of state-owned enterprises rather than of ministries of finance, which is also why the China line and the bilateral column beside it cannot be added: the first is grouped by the lender’s country and the second by the lender’s type, and a utility’s creditor lands in a different column from a ministry’s.
Which brings us to the two companies that are the real fiscal story. Government guarantees are extraordinarily concentrated: the electricity utility accounts for 73.6 percent of total guarantee exposure and the freight and ports company for 17.3 percent (National Treasury, 2026). Nine tenths of the state’s contingent liability sits in two firms that supply the pole with power and move its exports to the sea. In 2023 the Treasury announced R254 billion of debt relief for the utility, R168 billion of it capital and R86 billion interest, of which R140 billion had been advanced by 31 March 2025; in July 2025 the arrangement was restructured to R230 billion over five years (National Treasury, 2023; National Treasury, 2025). That is the largest single allocation of South African fiscal capacity in the democratic era, and it bought neither generation nor track. It bought a balance sheet.
Set beside it the corridor’s counter-example. Mozambique borrowed about $2 billion in 2013 and 2014 through state-owned companies, for a tuna fleet and patrol boats, without the parliamentary approval its constitution required, and concealed it; when the loans surfaced in 2016 donors suspended support, the currency collapsed and the country defaulted (Williams, 2018; Open Secrets, 2021). External public and publicly guaranteed debt went from 61 percent of GDP in 2016 to 104 percent in 2018 (Gebregziabher and Pijuan Sala, 2022), and the 2019 exchange pushed the surviving bond to 2031 (AIM, 2023). The card records an external stock of $69.8 billion against output of $22.3 billion, a ratio above three to one dominated by private borrowing behind the northern gas project rather than by the sovereign. Its creditor breakdown accounts for only about $10 billion of that, so the composition of the rest is a question the official statistics do not answer.
The hidden-debt episode is usually told as a corruption story, and it is one. For this chapter it is also a balance-sheet story about a corridor: the port at the eastern end is one of the better-run pieces of infrastructure in Southern Africa, and it is run by a concession company rather than by the state that defaulted. Ownership is the variable, not nationality.
3. The binding constraint
Growth diagnostics, in the form Hausmann, Rodrik and Velasco (2005) gave them, ask a question with a definite answer: of the many things wrong with an economy, which one, fixed first, would produce the largest increase in activity? The method walks down a tree and tests each branch by whether its shadow price is high rather than by whether it is bad. If finance binds, credit is rationed and firms with cash grow fastest; if human capital binds, the skill premium is rising; if infrastructure binds, firms pay above the regulated price to supply themselves. Figure 25.3 draws the tree and marks the path this chapter argues for.
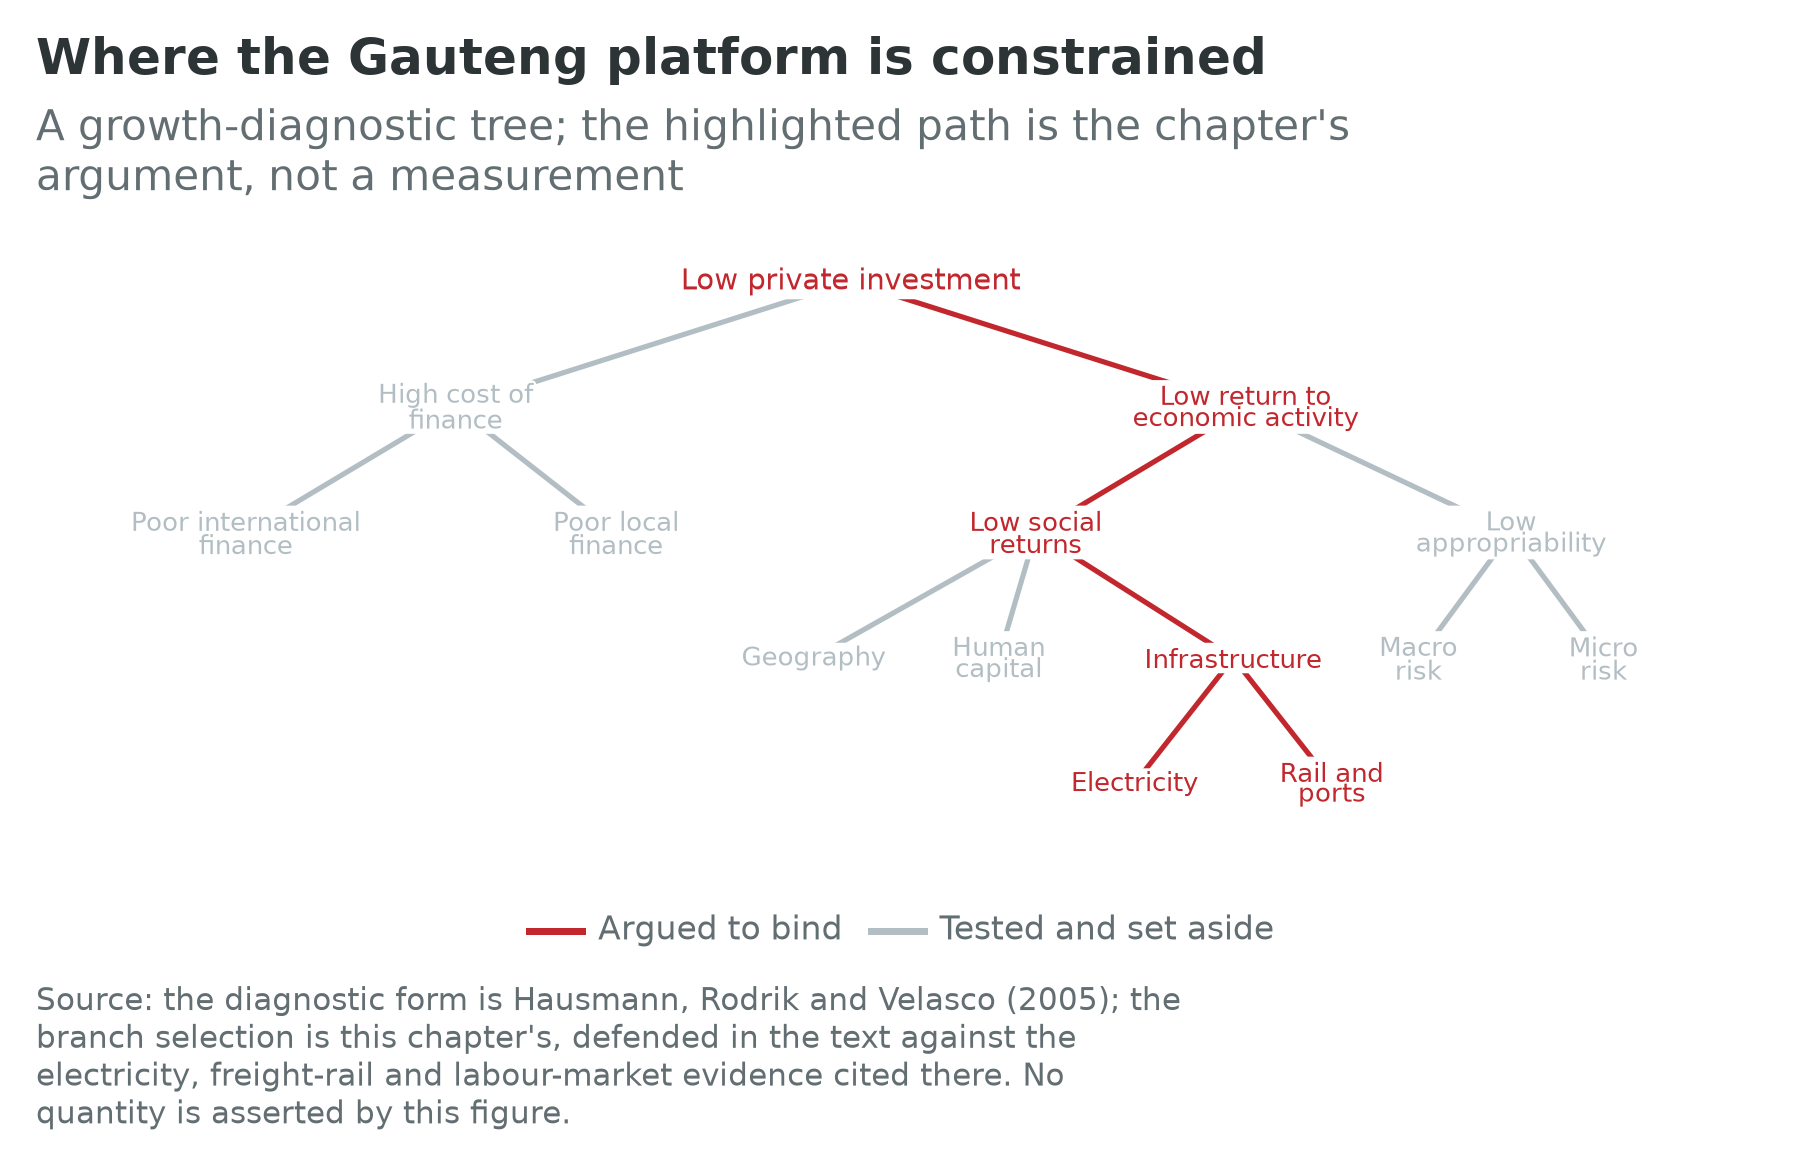
Start with the branches the chapter sets aside, because a diagnostic that finds everything binding has found nothing.
The cost of finance does not bind. South Africa has the deepest capital market on the continent, a bond market that funds the sovereign in its own currency at long maturities, a pension industry large enough to absorb that issuance, and a banking system that came through two decades without a systemic failure. Firms are not credit-rationed; the large corporates’ complaint through the 2010s was the opposite, that they held cash they could not find projects for. Both finance branches fail their shadow-price test.
Human capital binds later rather than first. The skills complaint is real, loud and old, and the artisan pipeline in particular is thin. But an economy in which a third of the labour force cannot find work at all, and in which the youth rate is 46.1 percent, is not primarily an economy short of workers (Statistics South Africa, 2025). Skills constrain the composition of what gets built; they do not explain why so little gets built. Chapter 20 carries the next decade’s version of the argument.
Macroeconomic risk is real but second order: inflation targeting has held, the currency floats, and the central bank is independent in practice as well as in law. What is left is the branch marked in the figure: low social returns through infrastructure, and specifically two networks and the state that runs them.
Electricity. The shadow-price test is unambiguous here, because firms and households paid it in public. In 2023 the country shed almost 25,000 gigawatt hours of demand across 287 days of rotational blackouts; in 2024 it shed just over 4,100 gigawatt hours across 69 days, and effectively none after March (CSIR, 2025). That improvement is the most important economic event in this pole in five years, and it came from raising the availability of the existing coal fleet rather than from building anything new; coal still supplied 83 percent of generation in 2024 (CSIR, 2025). The diagnostic evidence is what firms did during the bad years: they installed their own generation well above the regulated tariff, which is what a binding infrastructure constraint looks like written as a first-order condition. One caveat belongs beside the good news. Availability recovered by better maintenance of thirty-year-old coal stations has a shelf life, and grid capacity to connect new renewable generation is the constraint behind the constraint.
Freight rail and ports. The second network failed over a longer timescale and has recovered less. Freight-rail volumes fell from 226.3 million tonnes in 2017/18 to 149.5 million tonnes in 2022/23, and were about 152 million tonnes in 2023/24 against a 2030 target of 250 million tonnes (Transnet, 2025). Coal through Richards Bay, the network’s largest single use, ran at 47.2 million tonnes in 2023, 52.1 million in 2024 and 57.7 million in 2025 (McKay, 2026). The recovery is real and it is not yet a restoration. On the ports side the humiliation was public: Durban ranked last of 403 container ports in the World Bank’s 2024 index (World Bank and S&P Global Market Intelligence, 2024). The 2025 index named it the most improved port in the world, with the share of a ship’s time spent at a berth rising from about 52 percent to about 76 percent, and a 25-year concession awarded in December 2025 targets 2.8 million containers a year (World Bank and S&P Global Market Intelligence, 2025).
Both networks tell the same story, and it is not about money. The state had the fiscal capacity to write off R254 billion of one utility’s debt. What it lacked was the capacity to procure, maintain and staff two technical monopolies. That is what this chapter means by the network state: not the absence of infrastructure, which was built, and not the absence of finance, which exists, but the administrative capability to keep a network running and to let somebody else run the parts it cannot. The Durban concession, the private generation on factory roofs and the third-party access now being written into the rail network are versions of one answer.
One branch is left unresolved. The labour-market settlement, meaning centralized bargaining, the extension of council agreements to non-parties and the national minimum wage, is where South African economists divide most sharply, and it sits on the appropriability side of the tree. For treating it as binding: it raises the cost of hiring the least productive worker in an economy whose distinctive problem is that such workers are not hired at all. Against: countries with very similar bargaining institutions do not have a 33.2 percent unemployment rate (Statistics South Africa, 2025). This chapter does not settle it; Section 8 reports what the experiments found instead.
4. The political settlement
Chapter 4 set out the test the book applies to a country rather than a continent: has the elite, meaning the people who actually hold power, bet on growth rather than on dividing what exists? Chapter 5 supplies the vocabulary: Khan (2010) on institutions working only when they fit the underlying distribution of organizational power, Pritchett, Sen and Werker (2018) on the world of rules against the world of deals, and Dercon (2022) on whether the bargain is on growth. South Africa is an unusually clean case for all three, because its formal institutions are strong and its settlement is contested in the open.
The 1994 settlement was, in the political-settlement vocabulary, a trade: political power transferred completely, economic ownership almost not at all. The constitutional order that resulted is one of the most admired in the world and it sits on a distribution of assets that the transition did not disturb. Levy, Hirsch, Naidoo and Nxele (2021) put that tension at the centre of their account: strong institutions and massive inequalities in one country, with the institutions asked to do work the settlement was never designed to do. Seekings and Nattrass (2005) had already made the structural version of the argument, that the new order inherited a labour market organized around the exclusion of the poorest, and that the exclusion outlived its authors.
Black economic empowerment is what the settlement built to resolve that tension, and it is best read as an instrument of the settlement rather than as a policy that succeeded or failed on its own terms. It converts political power into asset ownership through the only mechanism available where the state does not own the assets: procurement scoring, licensing conditions and equity requirements. The mining charter is the sharpest case, because mining is where the licence is the asset. The 2018 charter set ownership thresholds the industry challenged, and in September 2021 the High Court held that the charter was policy rather than law, set aside the contested provisions and confirmed that a company once empowered stays empowered; the department did not appeal (Fasken, 2021). Read through Pritchett, Sen and Werker (2018), that is a court pushing a deals environment back towards a rules environment, which few middle-income countries can do.
The event that matters most here is recent. In the election of 29 May 2024 the governing party took 40.18 percent of the vote, losing its majority for the first time since 1994, and a government of national unity was formed in June with the main opposition and several smaller parties inside it (Electoral Commission of South Africa, 2024). Applying Dercon’s test to it is the live question of South African political economy, and the answer is unresolved. For a bargain on growth: the electricity crisis ended, the rail and port networks were opened to third parties, and the state stopped pretending it could run them alone. Against: the fiscal room went into a utility’s balance sheet rather than into capacity, the coalition rests on one arithmetic in Parliament, and the local governments that deliver water and electricity to the pole are in worse shape than the national departments.
The hinterland is governed by a different arithmetic entirely. Botswana, Lesotho, Eswatini and Namibia sit inside a customs union whose transfers are the largest single line in the smaller members’ budgets: roughly 40 percent of government revenue in Lesotho and Eswatini and roughly 30 percent in Botswana and Namibia (SACU, 2024). A hinterland whose fiscal base is a share of the hegemon’s tariff revenue does not have an independent development bargain; it has an interest in the hegemon’s imports. That has no parallel in the other seven poles, and it is why this chapter presents the block as a block.
Mozambique’s settlement was tested to destruction over the same period. The presidential election of October 2024 produced a declared result the leading opposition candidate rejected, and the protests that followed ran into March 2025 with at least 411 deaths by the count of the Mozambican monitor Plataforma Decide (Club of Mozambique, 2025). Ressano Garcia, the eastern gate of the Maputo Corridor, was burned in November 2024 and closed in part or in full for eight days, at a cost the tax authority put at about 400 million meticais (AIM, 2024). A corridor is an institution as much as a road, and one that closes whenever the election count is disputed has told its users what risk premium to charge it.
5. Geography and infrastructure
The pole’s geography is why it exists and why it is expensive. Gold was found on the Witwatersrand in 1886, roughly 500 kilometres from the coast and 1,750 metres above it, and every decision about rail, water and power since has been about serving an industrial concentration in the wrong place for a port and the wrong place for a river.
The corridor table in the companion volume gives the numbers for the two cross-border routes and this chapter does not repeat them: the Maputo Corridor’s growth from roughly 1.5 million to more than 20 million tonnes a year after the N4 toll concession and the port concession, the enclave risk the aluminium smelter at its eastern end represents, and the Trans-Kalahari route to Walvis Bay, whose throughput rose from about 2 million to more than 8 million tonnes (Wilse-Samson, 2026). What belongs here is what has happened since.
Maputo. The port handled a record 32 million tonnes in 2025, up 3.4 percent on the year, with rail volumes rising from 9.7 million to 11.7 million tonnes (Venter, 2026); the concession, due to run to 2033, was extended at the start of 2024 to 2058 (Grindrod, 2024). Two things follow. The shortest route to the sea is now also the most reliable, inverting the old logic under which Maputo was where South Africa went to escape its own congestion. And the concession is a partnership between the Mozambican state railway and a consortium of South African, Emirati and Mozambican companies, so a South African export moving through Maputo uses capacity neither state owns alone.
Durban and Richards Bay. Durban is the pole’s default outlet and carries the container trade; Richards Bay carries the coal. Both depend on the freight-rail network whose volumes Section 3 gave. The collapse and the recovery in the rankings show that a port is a queueing system rather than a quantity of quay: the gain between the 2024 and 2025 indices came from ships spending more of their time at a berth rather than at anchor, an operational variable and not a capital one (World Bank and S&P Global Market Intelligence, 2025).
The Trans-Kalahari and the western option. The route west to Walvis Bay is the pole’s hedge, and matters more to Botswana than to Gauteng: a landlocked economy whose exports are diamonds does not need bulk capacity, but one that wants to export anything else does. The book’s map classifies the corridor as under reform rather than reformed, the honest description of a route with good road, thin volume and a rail link that keeps being announced.
Power. The Southern African Power Pool is the institutional layer that makes the block a block, giving South Africa access to Mozambican hydropower from Cahora Bassa, Botswana and Namibia access to South African coal generation, and Zimbabwe and Zambia a market for Kariba when the water is there. During the worst of the blackouts the pool transmitted the crisis as well as the electricity: a hegemon that cannot generate enough for itself does not export. Chapter 14 carries the generation numbers; the point here is that the pole’s electricity constraint is a regional constraint with a South African cause.
6. Megaprojects and cities
A note on the city figures first, because this book labels a number with what it measures. The South African card carries an agglomeration population, Johannesburg at 11.0 million and 20.3 million in 2050, beside the national 64.0 million. Every metropolitan figure below is still labelled with its own source, because a census figure and a built-up-area figure are not the same object. Gauteng’s population at the 2022 census was about 15.1 million, in a province of three metropolitan municipalities that have grown into one another (Statistics South Africa, 2025). The city-region is the closest thing on the continent to a polycentric conurbation of the European or American kind, and its megaprojects are accordingly about movement rather than founding.
Gautrain. The rapid-rail link between Johannesburg, Pretoria and the airport is the pole’s flagship and its cautionary tale. Ridership fell from 13.9 million passengers in 2019/20 to 7.9 million in 2023/24 and has not recovered, because the commuting pattern it was built for did not survive the pandemic (Gautrain Management Agency, 2025). In February 2025 the province announced a R120 billion expansion taking the network from 80 kilometres to 230 kilometres, including lines to Soweto and Lanseria (Gauteng Provincial Government, 2025). A network carrying half its pre-pandemic ridership proposing to triple its length deserves the discipline this book applies to every megaproject: what is the traffic forecast, who bears the demand risk, and what happens to the provincial budget if it is wrong.
Lanseria. The smart-city plan north-west of Johannesburg, announced as a new urban centre around the second airport, is the pole’s version of the new-capital projects Chapters 24 and 27 describe. As of early 2026 the visible progress on the site amounted to an incomplete boundary fence (MyBroadband, 2026). New cities are the most legible form of government ambition and the least legible form of delivery; the book’s position, developed in Chapter 22, is that the housing deficit inside the existing built-up area is the more serious object.
The Tshwane auto cluster. North of Pretoria, at Rosslyn and Silverton, sits the densest concentration of vehicle assembly on the continent, with its supplier parks and a special economic zone attached to the largest plant. It is the part of the pole that most nearly answers the recipe’s description of what a middle-income economy should be doing, and Section 7 takes it up.
Maputo’s concession. The megaproject at the corridor’s far end is not a building but a contract. Extending the port concession to 2058 commits a private consortium to a capital programme in a country that defaulted within living memory, and is the clearest available test of whether a well-structured concession can be insulated from a weak sovereign (Grindrod, 2024).
7. Firm profiles
Discovery, Sandton
Discovery is a Johannesburg insurance and health company built on a behavioural mechanism rather than an underwriting one: Vitality prices risk down for policyholders who exercise, buy tracked groceries and submit to screening, and licenses that mechanism to insurers on other continents. For the year to 30 June 2025 the group reported normalised operating profit of R15,210 million, up 29 percent, of which the South African composite contributed R12,005 million, and normalised headline earnings of R9.78 billion (Discovery Limited, 2025).
Two things make it a useful profile. It is a genuine export of intellectual property from an African firm to rich-country markets, and one that requires no port. And its productivity comes from an actuarial and software capability employing a few thousand highly paid people: exactly the kind of firm a productivity platform produces, and exactly the kind that cannot absorb a 46.1 percent youth unemployment rate. The pole’s best companies and its worst statistic are two views of one structure.
Toyota South Africa Motors, Prospecton
The assembly plant at Prospecton sits beside the Durban port rather than in Gauteng, and that is the point: the pole includes the route to the sea and the industry on it. The plant builds pickups, vans and small crossovers for the domestic market and for export, and anchors the country’s largest automotive supplier network.
It is also the book’s clearest instance of climate risk arriving as an industrial event. In April 2022 the KwaZulu-Natal floods put the plant under half a metre to two metres of water, scrapped about 4,000 finished vehicles and stopped production until the lines reopened on 17 August 2022 (Toyota South Africa Motors, 2022). It has since taken R10.4 billion of new investment for a pickup line (Toyota South Africa Motors, 2025).
The auto programme, and why it is the recipe’s clearest African test
The Automotive Production Development Programme is the longest-running industrial policy in Africa disciplined by exports. Its mechanism is the one Studwell (2026) argues for and Chapter 9 tests: support is granted against production for sale abroad rather than against a promise, and the credits an assembler earns rise with the value it adds locally, so the subsidy is tied to an outcome a foreign buyer has to be willing to pay for. In 2025 the country exported a record 414,268 vehicles, 5.9 percent more than the 391,128 of 2024, amounting to 70.3 percent of light-vehicle production and R229.8 billion of a total automotive export bill of R291.0 billion; the industry is counted at about 5.3 percent of national output and supports over 500,000 jobs across the value chain (naamsa, 2026).
The counter-case belongs on the page too. The programme is expensive per job; domestic content is lower than the headline export value suggests, because an assembled car carries a great deal of imported componentry; and the industry depends on trade preferences into Europe and the United States that are political rather than earned. What makes it the clearest African test of the recipe is not that it has worked, but that it is the one African industrial policy old enough, large enough and measured enough to be argued about with numbers. Chapter 15 carries that argument.
8. What the experiments say
Box 25.1: What the experiments say about South African unemployment
South Africa is the most heavily experimented-on labour market in Africa, the one place where the jobs question can be argued with randomization rather than with priors. Three findings matter here.
Information about workers is scarce, and supplying it works. Abel, Burger and Piraino (2020) gave job seekers a standardized reference letter from a former employer. Applications that carried a letter received about 60 percent more callbacks, the effect was driven by women, and the mechanism was informational: the letters told employers something true that they had no other cheap way of learning. Carranza, Garlick, Orkin and Rankin (2022), working with a Johannesburg job-matching organization, assessed workseekers’ skills and gave them the results in a form they could show to employers. Employment and earnings rose, search strategies improved, and, tellingly, giving people the same information in a form they could not credibly share moved beliefs and search without moving employment. The friction is not that workseekers do not know their own skills; it is that they cannot prove them.
Cheaper search is not the same as more jobs. Banerjee and Sequeira (2023) subsidized the bus fare from Soweto into central Johannesburg for randomly selected job seekers. Search intensity rose and beliefs updated. Employment and job quality did not, and some participants lowered their reservation wages. The subsidy relaxed a real constraint and revealed a binding one behind it: there were not enough vacancies at the end of the search.
A wage subsidy at the scale actually tried did not move employment. The Employment Tax Incentive, introduced in 2014, cut the payroll cost of employing young workers. Ranchhod and Finn (2016) found no statistically significant effect on youth employment probabilities in the first six months, and Ebrahim, Leibbrandt and Ranchhod (2017) reached the same conclusion with firm-level tax data, reporting precise nulls rather than noisy ones.
Together the three say something specific about the diagnostic in Section 3. Interventions that reduce the friction between a worker and a vacancy work, in the modest way matching interventions work; interventions that assume the vacancies exist and only the price is wrong do not. That is evidence for a demand-side constraint rather than a labour-cost one, and it is why this chapter puts the network state ahead of the labour-market settlement while conceding the second is unresolved.
9. Climate exposure
Two climate risks bind on this pole, and neither of them is the one a reader expects.
Water. Gauteng is the largest concentration of people and industry in the world sitting on no major river. An inter-basin scheme carries water from the Lesotho highlands through tunnels into the Vaal system and supplies roughly 60 percent of Johannesburg’s water; the royalties are worth around R4 billion a year to Lesotho, about 15 percent of that government’s budget (The Conversation, 2026). The second phase, centred on the Polihali dam and a 38-kilometre tunnel, will lift the total transfer from 780 million to more than 1.27 billion cubic metres a year (SMEC, 2022). One of the poorest countries in the block holds a physical option on the largest economy’s industrial core, and is paid a fee for not exercising it.
The lesson to apply is Cape Town’s. In early 2018 that city came within weeks of a municipal water failure, with dam levels down to about a quarter of capacity and residents asked to live on 50 litres a day; tariffs, restrictions, pressure management and rain averted it (WWF, 2018). The lesson usually drawn is about drought. The more useful one here is about a dry year meeting a leaking network, because that is Gauteng’s exposure. Johannesburg Water lost 46.2 percent of the water it bought in 2023/24 and 48.4 percent by May 2025, and the bulk supplier loses about 2.5 billion of the 5.2 billion litres a day it delivers to Gauteng municipalities to leaks, ageing pipes and theft (ISS Today, 2026). A city that loses half its water does not need a drought to run out; it needs an ordinary year and one more percentage point of loss. That is the failure of Section 3 in a third guise: the asset was built and the capability to maintain it was not.
Coal. The pole runs on coal, which supplied 83 percent of electricity generation in 2024 and comes from Mpumalanga, immediately east of Gauteng and directly on the Maputo Corridor (CSIR, 2025). The Just Energy Transition Partnership agreed at the 2021 climate conference was the international attempt to finance the exit: initially $8.5 billion, with pledges since reaching about $13.7 billion once the development banks are counted, against a plan whose own requirement is far larger, and with the United States withdrawing in 2025 (The Presidency, 2023; Mail and Guardian, 2026). The binding difficulty is neither money nor technology. It is that Mpumalanga’s coal complex is a regional employment system of mines, a rail line, a port terminal and towns, in a country with a 33.2 percent unemployment rate whose settlement cannot absorb a region-sized job loss (Statistics South Africa, 2025). Chapter 34 carries the climate-finance argument; the point here is that South African decarbonization is a labour-market problem in an energy costume.
10. Data quality
The seven cards of this block sit at the top of the continent’s statistical distribution and still disagree about how much weight they will bear.
South Africa has one of the strongest statistical systems in Africa: a census in 2022, a rebasing in 2021, a labour-force survey in 2025, a Statistical Performance Indicators score of 81.3, and the block’s only high confidence flag. It also produced the census with the largest measured undercount on record: the post-enumeration survey put the shortfall at about 31 percent, some 10 percentage points above the highest previously reported to the United Nations, and a group of demographers argued publicly that the result was not fit for official use (Statistics South Africa, 2023; Dorrington and others, 2024). Both statements are true, and the second is why the first is credible: the undercount is known because the agency measured it and published the measurement. The book’s anchor for South African labour is therefore the quarterly labour-force survey, and every population figure in this chapter comes from the projections on the cards rather than from the census count.
The neighbours: Mozambique censused in 2017 and surveyed in 2022, at 66.7; Botswana censused in 2022 and surveyed in 2024, at 64.2; Lesotho censused in 2016 and surveyed in 2024, at 58.2; Eswatini censused in 2017, rebased in 2023 and surveyed in 2023, at 61.0; Namibia censused in 2023 but has not run a labour-force survey since 2018, at 55.7. Namibia is the block’s low flag, and the reason is the survey gap rather than the census.
Zimbabwe is the counter-anchor. Its card carries a 2022 census, a 2025 labour-force survey and a score of 66.8, all respectable, and no rebase year at all. What the card cannot show is the currency history behind the series: an economy that dollarized, de-dollarized, re-dollarized and introduced a new gold-backed unit in April 2024 has a national-accounts deflator doing something no other card’s deflator is doing. Its identity terms are reported because the series exist and they add; they should be read as an order of magnitude, and any comparison of Zimbabwean output per worker across the decade is a comparison across at least three monetary regimes.
What the numbers here can bear, then: the decomposition for South Africa is as solid as anything in the book; Mozambique, Botswana, Lesotho and Eswatini are good for the direction and the rough magnitude; Namibia’s should be quoted with the survey gap attached and Zimbabwe’s with the currency attached. The within-and-between split exists for five of the seven and ends in 2018, so it describes the decade before the electricity crisis rather than the one during it.
11. Data sources
- UN World Population Prospects 2024, medium variant: term one and the population levels, ages 15 to 64 throughout.
- ILOSTAT modelled estimates, November 2025: terms two and three, and the wage-employment, non-agricultural, youth and informality overlays.
- Groningen Growth and Development Centre, Economic Transformation Database: the within-and-between split of term three, for the five cards it covers, over 2008 to 2018.
- IMF World Economic Outlook, April 2026: output levels, output per head and observed growth.
- World Bank International Debt Statistics and the Boston University Chinese Loans to Africa database: the external debt stock, the creditor composition, and the Chinese lending the official statistics do not carry.
- Statistics South Africa: the labour-force survey, the provincial output estimates, and the 2022 census with its post-enumeration survey.
- National Treasury of South Africa, Budget Review, and the South African Reserve Bank: the debt stock, its currency composition, the guarantees, the utility debt relief and non-resident bond holdings.
- Transnet, Richards Bay Coal Terminal, the Maputo Port Development Company and the World Bank Container Port Performance Index: freight and port volumes. CSIR: the load-shedding record and the generation mix. naamsa: vehicle production and exports.
- The corridor table in The New Regional Economics, chapter 14, for the Maputo and Trans-Kalahari series this chapter cites rather than repeats.
12. Exercises
Discussion questions
This chapter argues that the binding constraint on the Gauteng pole is the state’s capability to run two technical networks, rather than finance, skills or macroeconomic risk. Make the strongest case for a different branch of the tree in Figure 25.3, then name the observation, available within five years, that would decide between your branch and this chapter’s. A diagnostic that no future observation could falsify is a preference, not a diagnosis.
South Africa records the highest wage-employment share on the continent and one of its worst employment outcomes. Explain how both can be true at once, using the identity rather than an appeal to inequality. Then say what a policy that raised the wage-employment share by five percentage points would have to do to the second and third terms, and whether any experiment in Box 25.1 suggests such a policy exists.
The Maputo Corridor’s port is run by a concession company, its border post was burned in a post-election crisis, and its throughput has never been higher. Argue for one of two readings: that the concession shows how to insulate infrastructure from a weak state, or that the crisis shows no contract can insulate infrastructure from the politics around it. Use Section 2, and say what evidence from another pole in Part VI would strengthen your case.
Try it
Open the three cards side by side: South Africa, Mozambique and Botswana, in that order. Read down the identity block, where the three columns share one scale, and then down the data-quality block. Write one paragraph on a single question: handed the three columns without the country names, which would you say has the most serious employment problem, and does your answer change when you learn which of them is the largest economy on the continent? Then swap Zimbabwe in for Botswana, read its header note, and say what you would need to know about its monetary history before comparing its output-per-worker term with South Africa’s.
Data exercise
Download the cards as cards.csv or cards.json from the country cards page on this site and build a table of the seven countries here with eight columns: the three identity terms, implied and observed growth, the two employment overlays, and the confidence flag. Then do four things. First, reproduce the gap between implied and observed growth for each country and confirm it is small enough for the decomposition to be quoted. Second, rank the seven by observed growth and again by output-per-worker growth, and write two sentences on why the rankings differ. Third, add the within-sector and between-sector fields, identify which countries have them, and say which of those has the reallocation pattern structural-transformation theory predicts and which has its opposite. Fourth, repeat the exercise restricted to cards whose confidence flag is not low, note which country drops out, and say whether any conclusion in this chapter depended on it. Treat nulls as nulls: a missing within-and-between split is a country the database does not cover, not a country with no structural change.