6. The Informal Economy
Learning Objectives
After reading this chapter, you should be able to:
- Say where the word “informal” came from, distinguish the informal sector from informal employment, and say what the statistical standard adopted in 2023 changed about both.
- Read the informal-employment field on a country card: what it measures, which nine cards do not carry it, and why a modelled share and a survey number are different objects that look identical in a table.
- Split the identity’s third term into its within-sector and between-sector components for the 21 countries where that can be done, and say what the split does and does not establish about structural change.
- Set out the four competing accounts of African informality, the tax net, the productivity view, exclusion against exit, and networks, and name the evidence that would separate them.
- State what the informal economy is in each of the book’s two worlds, and why the answer to “does formalization raise productivity or only registration” changes between them.
Prior work: informal cross-border trade and the consumption-city argument are developed at length in the companion volume, The New Regional Economics, chapters 13 and 14 (Wilse-Samson, 2026). This chapter cites them rather than repeating them.
In the median African country for which an estimate exists, 89.1 percent of everybody at work is informally employed. Weight those 45 countries by population and the figure is 85.4 percent; nineteen of them are at or above 90 percent and only five are below 50. This is not a margin, a residual or a transitional stage. On this continent the informal economy is the economy, and the formal sector is the exception that most statistical systems are nevertheless organized to measure.
Stand somewhere concrete and the number stops being abstract. On the east bank of the Niger at Onitsha sits what is usually described as the largest market in West Africa, a grid of lock-up shops and streets specialized by trade with satellite markets spread across the metropolis. How many people earn a living there is a matter of assertion: one local account puts the traders and their support workers above two million, with more than half a million further jobs sustained indirectly (Pulse Nigeria, 2025). That looseness is not incidental. Nobody registered them, nobody licenses most of them, no payroll records them, and the figure is a boast rather than a count because counting was never anybody’s job.
This chapter owns the measurement and the structure of that economy, not the jobs thesis, which Chapter 10 carries. It asks what the word means and who decided, what the cards record when they record an informal share, how the identity’s third term splits into productivity gained inside sectors and productivity gained by moving workers between them, and what all this looks like from inside a market, a workshop and a savings circle.
Where the word came from
The term entered economics in one place at one time. Keith Hart, an anthropologist working in the Nima district of Accra at the end of the 1960s, described the income-earning activities of migrants from northern Ghana who, on the official view, were unemployed and were in fact working continuously at a shifting portfolio of trades: petty trade, transport, brewing, tailoring, moneylending, casual labour and a quantity of activity the state would have called crime (Hart, 1973). His point was not that these people needed help. It was that the category the statistics were using did not fit what they were doing, and that a labour force described as having an unemployment problem in fact had a measurement problem. The International Labour Organization’s employment mission to Kenya adopted the term for a whole sector in 1972, a year before Hart’s account appeared in print, defining it by the characteristics of the enterprise: ease of entry, family ownership, small scale, adapted technology, skills acquired outside the school system, unregulated competitive markets (ILO, 1972). That is where the informal sector became an object of policy rather than an ethnographic observation, and the mission’s framing, that the sector was efficient and held back by regulation rather than by poverty, has been argued about ever since.
Two definitions descend from that origin and both are on the page whenever anybody quotes a number. The informal sector is a set of production units, made statistical at the 15th International Conference of Labour Statisticians in 1993 as unincorporated household enterprises that are unregistered or below a size threshold (ILO, 1993). It counts the workshop rather than the worker, and it misses a large category of people: a cleaner employed by a subcontractor at a formal bank, with no contract and no social insurance, works in a formal enterprise and has an informal job. Informal employment is the job-based concept the 17th Conference issued guidelines for in 2003, counting a job as informal if it carries no social protection, no paid leave and no contract, wherever the enterprise sits (ILO, 2003). It is the larger category and the one the cards carry.
Both have now been superseded. The 19th Conference in 2013 rewrote the definitions of work and employment, most consequentially by excluding subsistence production for own use from employment (ILO, 2013), and the 21st, in October 2023, adopted a single resolution on statistics of the informal economy replacing the 1993 and 2003 standards (ILO, 2023). Offices are only now implementing it, so every number here rests on the older standard and the series will break when the new one arrives. That is the kind of discontinuity that produces false findings: a country that appears to have formalized between two surveys may only have changed its questionnaire.
The scale of the thing on the older standard is not in dispute. The ILO’s first global estimates put two billion people, 61.2 percent of the world’s employed population, in informal employment, and 85.8 percent of employment in Africa (ILO, 2018). The continent has the highest informality rate in the world and the fastest-growing labour force in the world, which is the arithmetic that makes this a chapter rather than a footnote.
What the cards measure
Every country card carries a field for the informal share of employment, and 45 of the 54 have a number in it. It is the ILO’s modelled estimate of informal employment as a percentage of total employment, on the job-based 2003 definition. Modelled means what it means everywhere else in this book: the agency assembles whatever national observations exist, harmonizes them, and fits a model that fills the years and countries where nobody asked anybody anything. Where a country has run a recent labour-force survey with an informality module the estimate is close to a measurement; where it has not, it is an interpolation that inherits the authority of its typography rather than of its evidence. Thirty-two of the 45 have a labour-force survey within five years, and 13 do not. Chapter 10’s rule about survey coverage applies here unmodified.
The distribution is compressed at the top and long at the bottom. The middle half of the 45 runs from 77.8 to 94.5 percent and nine cards sit at or above 95. At the top, Niger records 98.5, Burundi 98.0 and Chad 97.6; at the bottom, Seychelles 14.2, Mauritius 23.5 and South Africa 34.8. Table 6.1 sorts them into bands with the other overlays beside them.
| Informal share of employment | Cards | Median income per head ($) | Median wage employment (%) | Median non-agricultural employment (%) | Share of continental population (%) | High-confidence cards |
|---|---|---|---|---|---|---|
| 95 percent and above | 9 | 871 | 14.7 | 30.5 | 20.7 | 3 |
| 90 to 95 percent | 10 | 1,220 | 23.0 | 46.0 | 33.0 | 0 |
| 80 to 90 percent | 14 | 1,853 | 38.7 | 64.7 | 13.0 | 3 |
| 50 to 80 percent | 7 | 4,442 | 63.2 | 81.9 | 19.2 | 1 |
| Below 50 percent | 5 | 6,769 | 78.4 | 94.8 | 5.2 | 3 |
The 45 cards carrying an informal-employment estimate, in five bands. Income per head is 2025; the two overlays and the informal share are the latest modelled year; the population share is of all 54 countries, so the bands sum to 91.1 percent rather than 100. Sources: ILOSTAT modelled estimates (November 2025) for the employment columns, the IMF World Economic Outlook (April 2026) for income, UN World Population Prospects 2024 for population, and the book’s confidence rule for the last column.
Two features of that table matter before anything else. The first is the middle row: the band from 90 to 95 percent holds a third of the continent’s population and not one high-confidence card. It contains Nigeria, Tanzania, Uganda, Sudan, Mali and Côte d’Ivoire, a large part of the Africa this book’s thesis is about, measured by systems the book’s own rule declines to rate highly. The second is that the bands are not a ladder anybody is visibly climbing. They are a cross-section of income, and Figure 6.1 shows how tight it is.
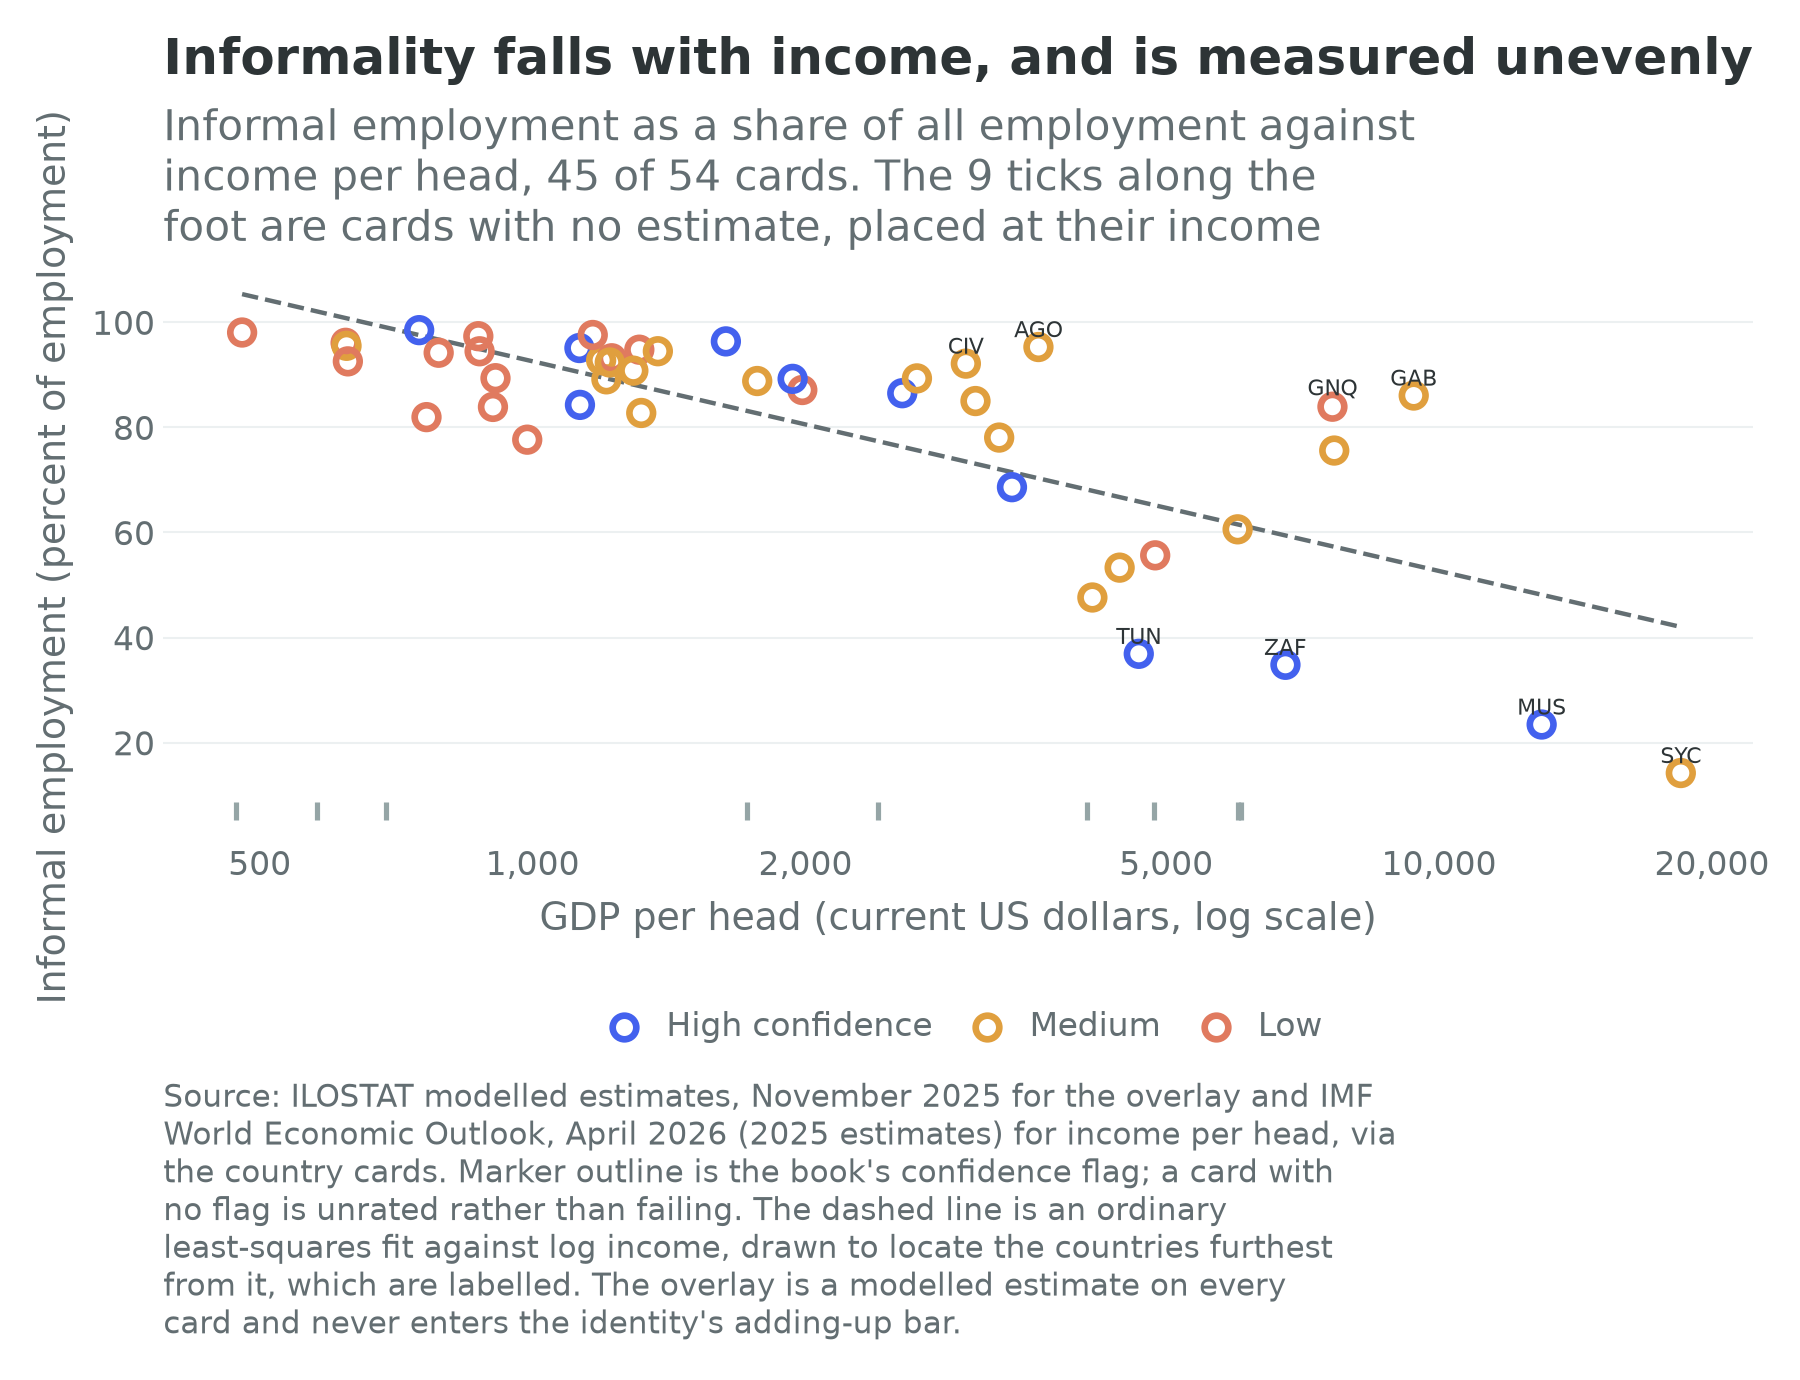
Chapter 10 reads the slope of that line and this chapter will not read it twice. What belongs here is the scatter around it. The four countries furthest above the line, the most informal given their income, are Gabon, Equatorial Guinea, Angola and Côte d’Ivoire, at 86.1, 83.9, 95.3 and 92.1 percent on incomes per head of $9,376, $7,628, $3,614 and $3,006. Three of the four are oil economies; the four furthest below the line are Tunisia, Seychelles, Mauritius and South Africa.
An economy whose income arrives as a rent can post a middle-income figure per head while almost none of its people work in anything the rent finances: it employs very few of them, and the rest are absorbed by the urban service economy its spending creates. That is the consumption-city argument arriving through the labour statistics rather than the urban ones, and this chapter returns to it below. Income per head does not measure how an economy employs people, and a country can buy a respectable income without building an economy that employs anyone formally.
The nine cards that carry nothing
Nine cards carry no informal-employment estimate at all: the Central African Republic, the Republic of the Congo, Algeria, Eritrea, Guinea, Libya, Morocco, South Sudan and São Tomé and Príncipe.
It would be convenient if that were a list of collapsed statistical systems. Four of the nine are: the Central African Republic and South Sudan have never run a labour-force survey, Eritrea’s last was in 2015 and Libya’s in 2012. But Morocco ran a census in 2024, runs a continuous quarterly labour-force survey, carries a high confidence flag, and still has no informal share on its card. It measures informality carefully and by a definition of its own: the planning commission counts informal production units, and the OECD reports more than two million of them, with the share of employees working without a contract at 51.2 percent in 2022 against 67.2 percent in 2000 (OECD, 2024b). Those are real numbers about a real phenomenon and they are not the ILO’s series.
A gap in an international series is therefore sometimes ignorance and sometimes a definitional refusal, and the two look identical from outside. The book’s rule is to leave the field empty and name the countries rather than impute, because an imputed rate for Morocco would be used in a regression by somebody who did not read this paragraph.
A wage is not the opposite of informality
The most useful thing the cards say about informality is something the literature states in words and rarely quantifies. Informal employment and wage employment are not complements. They overlap, and the overlap is large.
Both overlays are shares of the same denominator, everybody in employment. On 44 cards both are present, and on 42 of those they sum to more than 100, with a median excess of 16.0 percentage points. Since neither share can exceed 100, that excess is a floor under employment that is both waged and informal: a person working for somebody else, for a wage, with no contract and no social protection. The floor is 56.7 points in Equatorial Guinea, 53.6 in Gabon, 50.5 in Lesotho and 47.7 in Sudan, and even South Africa, the continent’s most formalized labour market on this measure, has one of 17.5.
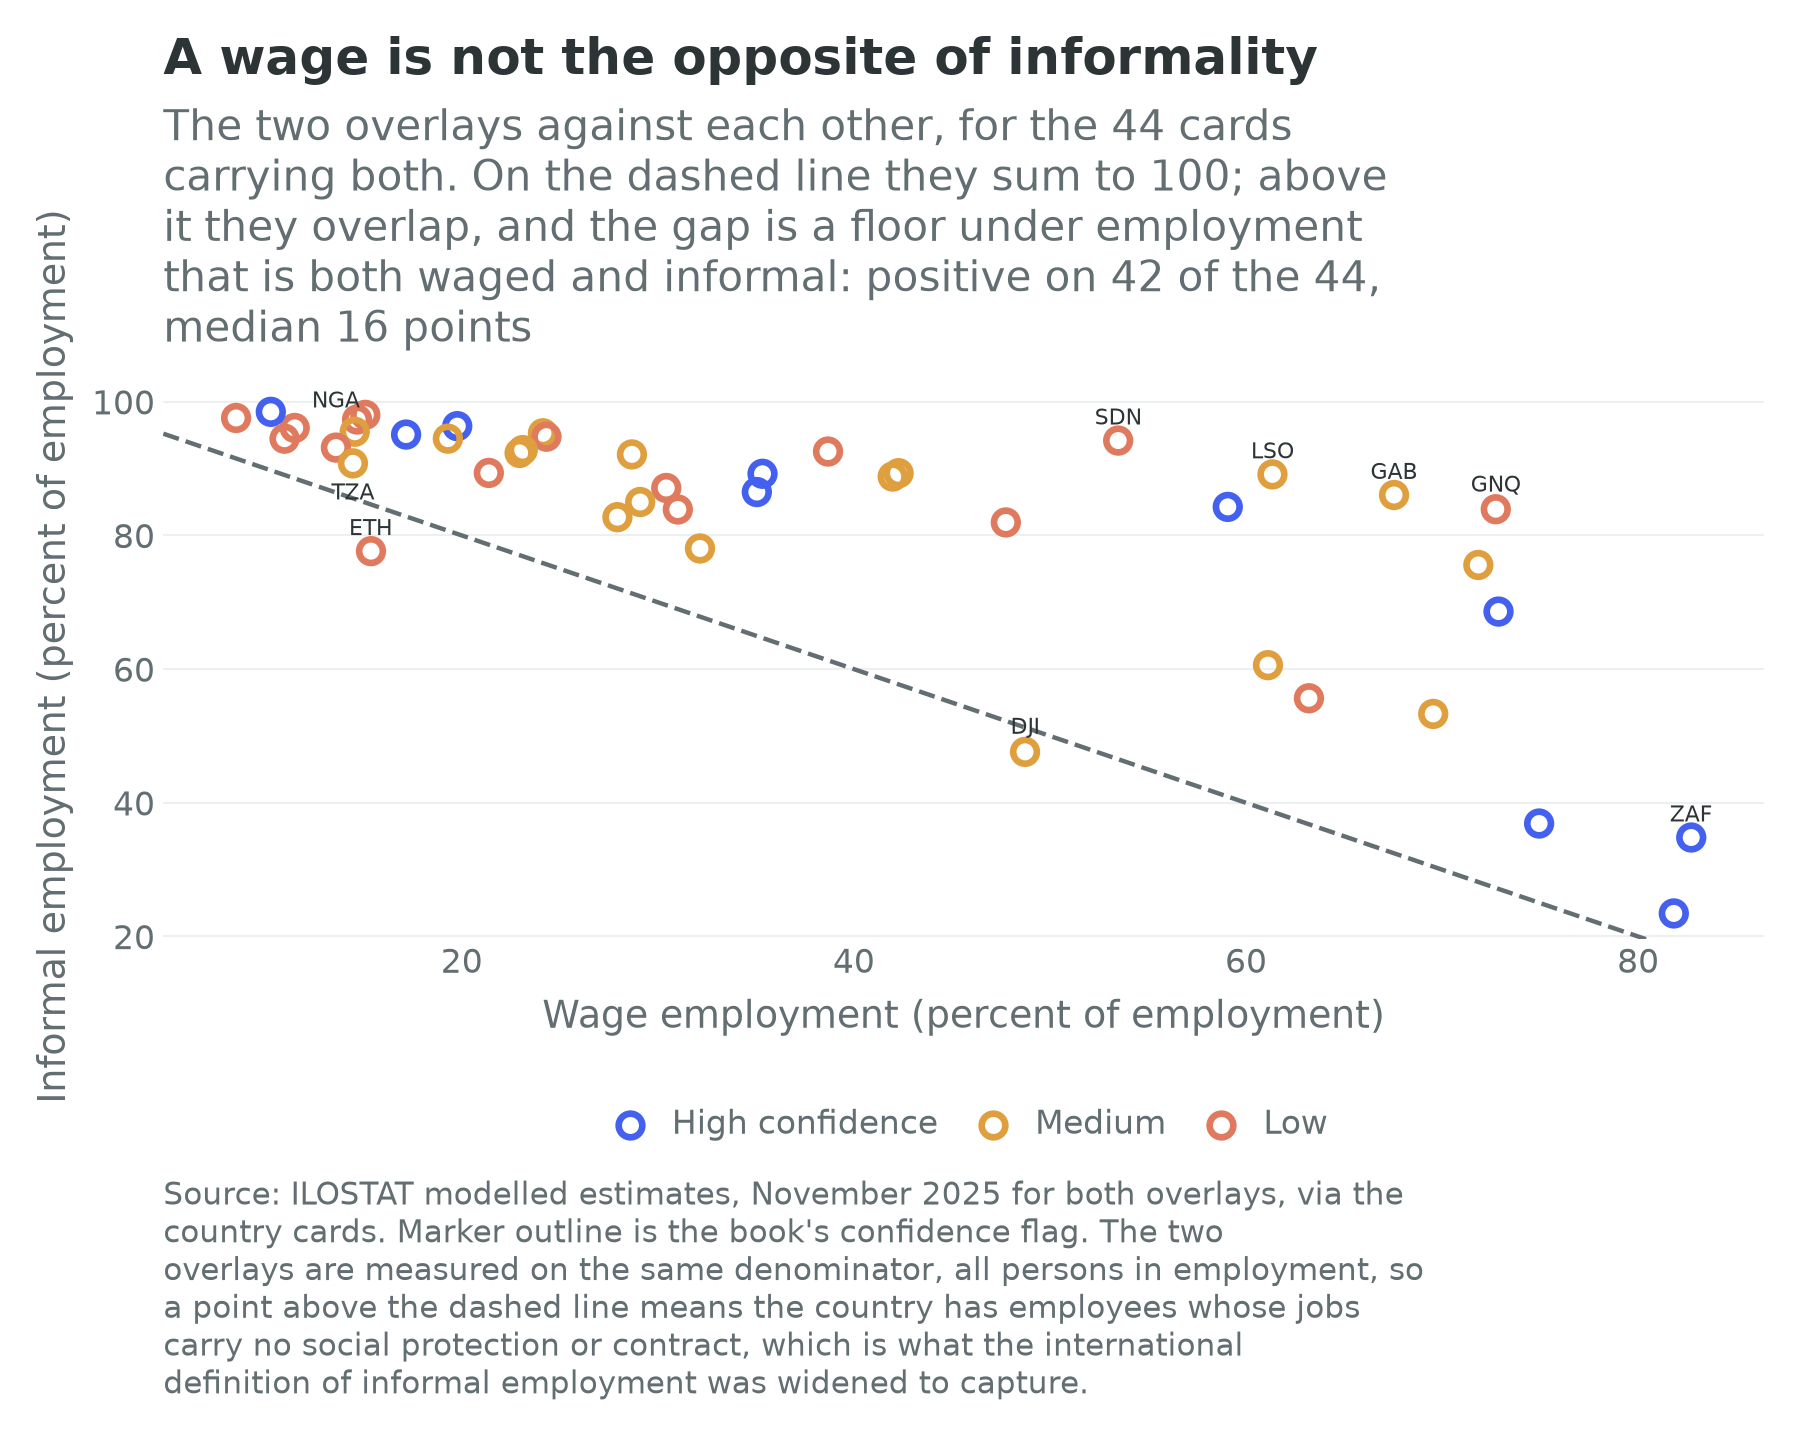
This matters for the book’s argument. Chapter 10’s wage-employment overlay is the closest thing the international statistics have to a measure of what a finance minister means by a job, and Figure 6.2 says that in most African countries a large part of it is jobs without the protections the word is supposed to carry. A rising wage share is good news with an asterisk, and the asterisk is the vertical gap on the card. The two exceptions are Ethiopia and Djibouti, and in Ethiopia’s case the reason is that so little employment is waged in the first place, at 15.4 percent.
Two kinds of near-total informality
The 19 cards reporting informality at or above 90 percent divide into two economies. In 13, non-agricultural employment is below half, so the informality is the informality of the farm: Niger at 26.5 percent non-agricultural, Mozambique at 26.9, Chad at 28.1. In the other six it has moved to town: Nigeria at 65.9 percent non-agricultural, Togo at 61.7, Sudan at 60.2. The second group is the one this book worries about. A country whose informality is agricultural has not yet had its structural transformation; a country whose informality is urban has had one, and it did not lead where the theory said it would. Which of the two a country is in is the question the identity’s third term answers.
Splitting the third term
Recall the arithmetic from Chapter 1. GDP growth is approximately the growth of output per worker, plus the growth of the employment-to-working-age ratio, plus the growth of the working-age population, and all three are growth rates. The third term is the structural-transformation term, and it hides a distinction that decides what kind of economy a country is becoming.
Output per worker rises within sectors when farms, workshops and factories get better at what they already do, and between sectors when workers move from low-productivity activities to higher-productivity ones, which in practice means from the farm to somewhere else. Write aggregate productivity as the employment-share-weighted average of sector productivities and the change decomposes exactly into a term that holds shares fixed and moves productivities and a term that holds productivities fixed and moves shares. That is the decomposition McMillan and Rodrik (2011) made the standard tool of the field and McMillan, Rodrik and Verduzco-Gallo (2014) applied to Africa.
The two components have different policy owners: the within term is what agricultural extension, electricity, management practice and competition policy move, the between term what cities, roads, ports, migration and industrial policy move. And the sign of the between term is the whole African question. McMillan, Rodrik and Verduzco-Gallo (2014) found it negative for Africa over 1990 to 2005 and positive for Asia over the same period, which is to say that workers were, on balance, moving from higher-productivity activities to lower-productivity ones.
What 21 cards say
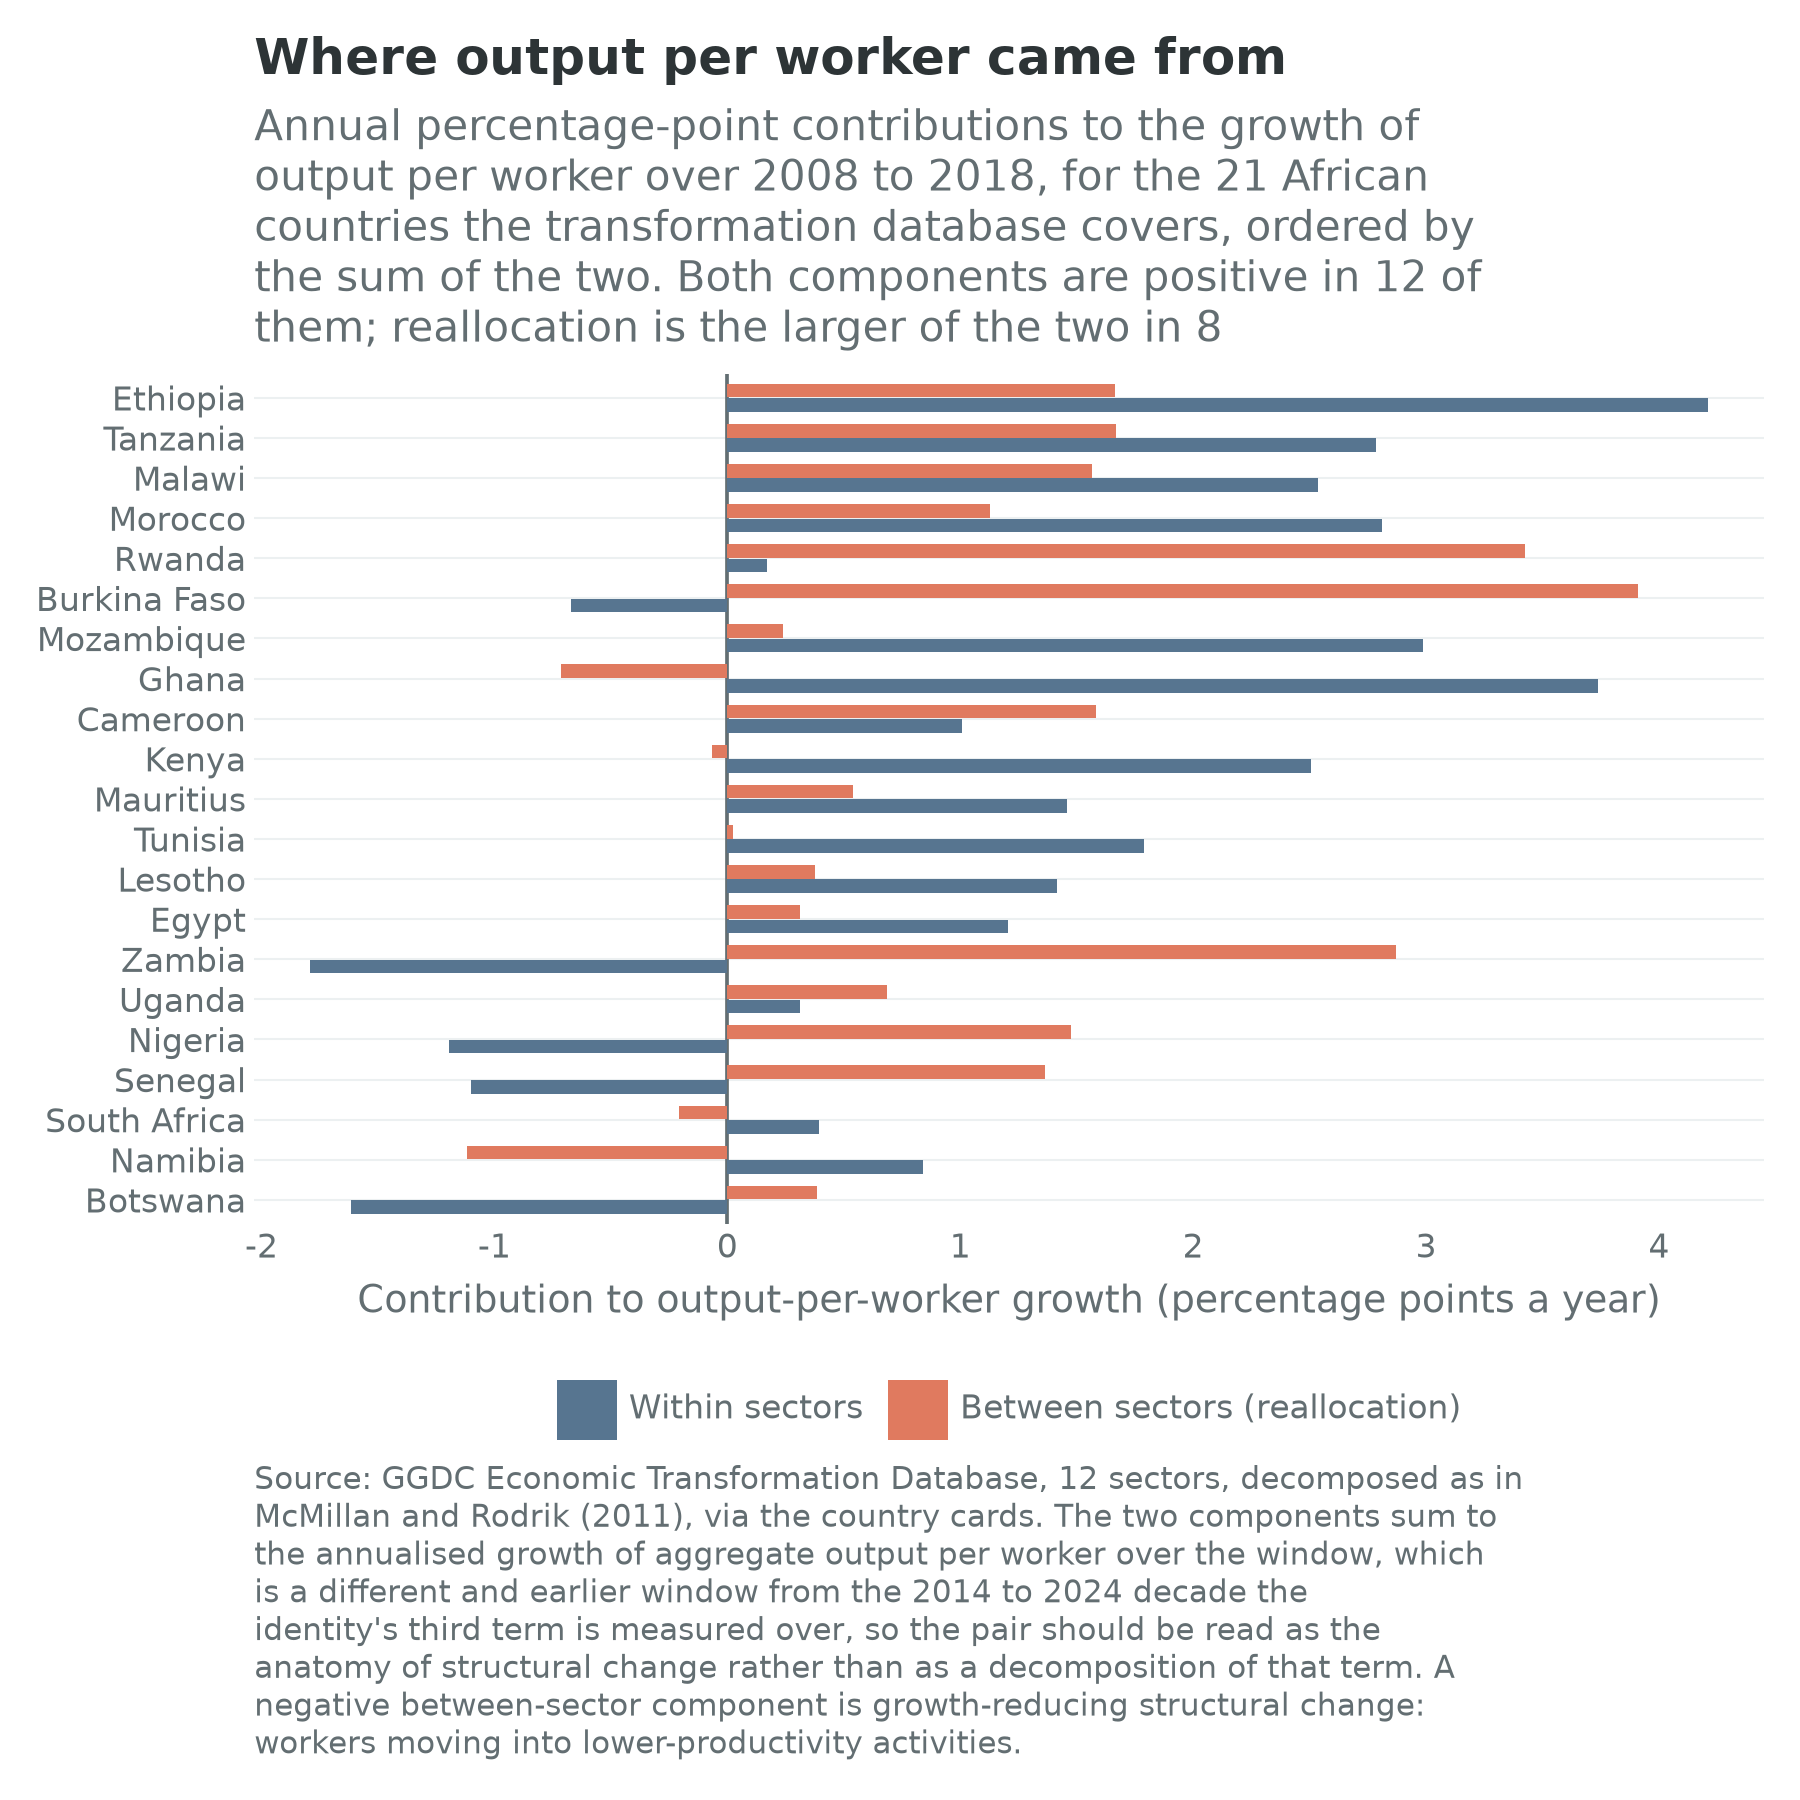
The split is available for 21 of the 54 countries, from the Groningen transformation database, over 2008 to 2018 on a twelve-sector breakdown. Those 21 hold 64.6 percent of the continent’s population and produce 66.8 percent of its output, so coverage is better by weight than by count. Nine carry a high confidence flag, seven medium and five low, and 19 have a labour-force survey within five years, which makes this the best-measured subset in the book. Table 6.2 reports all 21.
| Country | Within sectors (pp a year) | Between sectors (pp a year) | Sum (pp a year) | Term three, 2014 to 2024 (percent a year) | Informal employment (percent) | Confidence |
|---|---|---|---|---|---|---|
| Ethiopia | 4.21 | 1.67 | 5.88 | 5.91 | 77.7 | low |
| Tanzania | 2.79 | 1.67 | 4.45 | 1.92 | 90.8 | medium |
| Malawi | 2.54 | 1.57 | 4.10 | 0.25 | 92.6 | low |
| Morocco | 2.81 | 1.13 | 3.94 | 1.88 | not on card | high |
| Rwanda | 0.17 | 3.43 | 3.60 | 3.26 | 84.3 | high |
| Burkina Faso | -0.67 | 3.91 | 3.24 | 2.47 | 95.1 | high |
| Mozambique | 2.99 | 0.24 | 3.23 | 0.57 | 95.5 | medium |
| Ghana | 3.74 | -0.71 | 3.03 | 3.48 | 78.1 | medium |
| Cameroon | 1.01 | 1.59 | 2.59 | 1.31 | 87.1 | low |
| Kenya | 2.50 | -0.07 | 2.44 | 2.84 | 86.5 | high |
| Mauritius | 1.46 | 0.54 | 2.00 | 2.02 | 23.5 | high |
| Tunisia | 1.79 | 0.02 | 1.81 | 0.48 | 36.9 | high |
| Lesotho | 1.41 | 0.38 | 1.79 | -0.05 | 89.1 | medium |
| Egypt | 1.20 | 0.31 | 1.51 | 2.26 | 68.6 | high |
| Zambia | -1.79 | 2.87 | 1.08 | -0.93 | 82.7 | medium |
| Uganda | 0.31 | 0.69 | 1.00 | 0.22 | 94.5 | medium |
| Nigeria | -1.19 | 1.48 | 0.28 | -1.94 | 93.1 | low |
| Senegal | -1.10 | 1.37 | 0.27 | 0.27 | 89.2 | high |
| South Africa | 0.39 | -0.21 | 0.19 | -0.48 | 34.8 | high |
| Namibia | 0.84 | -1.12 | -0.28 | -1.05 | 55.6 | low |
| Botswana | -1.62 | 0.38 | -1.23 | -0.11 | 75.6 | medium |
| Median of the 21 | 1.20 | 0.69 | 2.00 | 0.57 | 85.4 |
The two components are annual percentage-point contributions to the growth of aggregate output per worker over 2008 to 2018, on a twelve-sector breakdown, and they sum exactly to that growth. The fifth column is the identity’s third term over 2014 to 2024, a later window, shown for comparison rather than as the thing decomposed. The median row is taken column by column and is not a country. Sources: GGDC Economic Transformation Database, decomposed as in McMillan and Rodrik (2011), and ILOSTAT modelled estimates (November 2025) for the third term and the informal share; the confidence flag is this book’s own rule.
The plain reading
Six statements, in order of how much weight they bear.
Reallocation is adding to African productivity, not subtracting from it. The between-sector component is positive in 17 of the 21, with a median of 0.69 percentage points a year. That is not what the structural-change pessimism of the 2010s predicted, and it is a change from the negative continental average McMillan, Rodrik and Verduzco-Gallo (2014) reported for the two decades before. Workers are moving, and on average to somewhere more productive than where they were.
The within-sector component is doing at least as much work. It is positive in 16 of the 21, with a median of 1.20 percentage points a year, and is the larger of the two in 13. The image of African growth as pure reallocation, people pouring off farms and the arithmetic doing the rest, is not what these countries recorded. Firms and farms got better too.
Both components are positive in 12 of the 21, and in none are both negative. The twelve are Cameroon, Egypt, Ethiopia, Lesotho, Morocco, Mozambique, Mauritius, Malawi, Rwanda, Tunisia, Tanzania and Uganda. No country here had structural change and firm-level improvement fail at once, which is a more cheerful sentence than most of this book contains.
Where reallocation dominates, it is usually because the within term went negative. In eight of the 21 the between component exceeds the within, and in five of those the within component is below zero: Burkina Faso at minus 0.67, Zambia at minus 1.79, Nigeria at minus 1.19, Senegal at minus 1.10 and Botswana at minus 1.62. Zambia is the sharpest case: a within-sector component of minus 1.79 points a year against a between-sector component of plus 2.87, so the whole of a modest 1.08 points of productivity growth, and rather more besides, came from moving people while the sectors they left and the sectors they joined were both getting worse at what they did. Chapter 30 takes up Zambian copper over the same decade; Nigeria is the same pattern at continental scale, and its third term over 2014 to 2024 is minus 1.94 percent a year.
Four countries had genuinely growth-reducing structural change: Namibia at minus 1.12 points a year, Ghana at minus 0.71, South Africa at minus 0.21 and Kenya at minus 0.07. Ghana is the instructive one, with a within-sector component of 3.74 points a year, the second highest in the sample, against that minus 0.71. Ghanaian firms improved and Ghanaian workers moved in the wrong direction at the same time. That is the dual economy in one row of a table.
And the reallocation is happening where informality is highest. Across the 20 countries carrying both the split and an informal share, the between-sector component correlates with the informal share at plus 0.45 and the within-sector component at minus 0.06, which is nothing. Crudely: the five countries with the largest between-sector components, Burkina Faso, Rwanda, Zambia, Tanzania and Ethiopia, have a median informal share of 84.3 percent against 55.6 for the five with the smallest, Namibia, Ghana, South Africa, Kenya and Tunisia. Reallocation is not a formalization machine. It is fastest in the economies that are almost entirely informal, so the destination is overwhelmingly informal too.
What the split does not say
Four cautions, because a decomposition this clean invites more weight than it can carry.
The window is 2008 to 2018 and the identity’s third term is measured over 2014 to 2024. They overlap by half and are not the same measurement, which is why Table 6.2 keeps them in separate columns. On several cards the disagreement is large: Malawi’s components sum to 4.10 points a year against a third term of 0.25, and Mozambique’s to 3.23 against 0.57. Some of that is the window and some the different employment series; none of it is an error, and all of it warns that a country’s structural transformation before 2018 says less than you would like about its productivity after.
The sample is not random. It is the countries with usable sectoral national accounts, which correlates with everything else this book worries about: the Democratic Republic of the Congo, Angola, Niger, Chad, Mali and Sudan are all absent, and every one is a place where the between term would be most interesting.
Twelve sectors is a coarse grid, and the between term is defined relative to it. Moving a worker from smallholder maize to a market stall counts as reallocation from agriculture to trade services; moving her from an unproductive stall to a productive one does not show up at all, since both sit inside trade services. Most of what the next sections describe is invisible to the decomposition by construction, which is the reason the chapter does not stop here.
And it is accounting, not causation. A positive between term says workers ended up in higher-productivity sectors; it does not say the move raised output, because a sector’s productivity is an average and the marginal worker joining it is not.
Where the workers went
The puzzle is now stateable in one sentence. Reallocation is positive, informality is nearly universal, and both are true of the same countries at once. So what are people moving into?
In most of the continent, urban informal services. That is what Diao, Ellis, McMillan and Rodrik (2021) established at the firm level for Tanzania and Ethiopia, in the form this book has cited since Chapter 1: an economy split in two, where large firms raise productivity without adding employment and small firms add employment without raising productivity. Their evidence is written once, in their paper. Table 6.2 adds the aggregate signature of the same structure: a country whose between term is positive and large while its informal share sits above 90 percent, which describes Burkina Faso, Tanzania and Uganda, is one whose workers are leaving agriculture for the half of the dual economy that absorbs labour without raising productivity.
Reallocation into informal urban services and reallocation into formal manufacturing are both positive between terms, and they are not the same event. The first raises measured productivity once, when the worker arrives, and then stops, because a market stall does not learn. The second raises it on arrival and keeps raising it, because a factory does. That difference is the whole of the East Asian record, and it is why Rodrik (2016) named premature deindustrialization as the shadow over the recipe: manufacturing now peaks earlier and lower as a share of employment than it did for the early industrializers, so the sector that used to convert reallocation into compounding is smaller when African workers reach it. Kruse, Mensah, Sen and de Vries (2023) add the qualifier that cuts both ways, finding manufacturing employment shares rising again in the 2010s but concentrated in small and largely informal firms. A manufacturing renaissance made of unregistered workshops is a between term that behaves like a service sector.
The urban destination has a name. Gollin, Jedwab and Vollrath (2016) distinguish production cities, which grow because tradable output grows, from consumption cities, which grow because a resource rent is spent in them; the companion volume works the case through for Lagos, Luanda and Libreville and against Nairobi, and Chapter 22 carries this book’s version (Wilse-Samson, 2026). That is why Figure 6.1 has oil economies at the top of its residuals. A consumption city’s informal service sector is not a stage on the way to something. It is what the rent’s spending calls into existence, and it lasts as long as the rent.
Four ways of reading the same fact
Everyone agrees that most Africans work informally. What the fact means has four incompatible answers, each implying a different intervention.
The tax net
The first reading is fiscal. Informality is what a state cannot see and therefore cannot tax, regulate or protect, so the problem is the size of the net.
The sharpest African statement of this view also complicates it most. Benjamin and Mbaye (2012) surveyed informal firms in Dakar, Cotonou and Ouagadougou and found the sector is not one thing. Beside the multitude of tiny operators sits a category they call large informal firms: enterprises whose sales rival those of large formal firms, concentrated in food imports, pharmaceuticals, cement, construction and trucking, run as family businesses with few permanent employees and a large temporary workforce, and seldom surviving the owner’s death or a falling-out with a political patron. These firms are not informal because they are poor but because informality is profitable and enforcement is selective: their competitors pay tax and they do not, a competitive advantage granted by the state’s decision not to look. The revenue foregone from a million street traders is small; from these firms it is not, and it is politically protected. The question is not how to register the woman selling tomatoes but whether the state will register the importer.
The productivity view
The second reading is that informal firms are simply bad firms, which is a fact about firms rather than rules. La Porta and Shleifer (2014) assembled the cross-country evidence and reached a conclusion that is unpopular and hard to dismiss: informal firms are permanently small, permanently unproductive, and do not become formal firms as they grow. Formal firms are started by different people, more educated and with more capital, and they compete informal firms out of existence rather than absorbing them. Informality withers as growth proceeds; it is a symptom rather than a cause.
Figure 6.1 is consistent with that, and every rich country was once as informal as Niger. The uncomfortable implication is that most policies aimed directly at informality treat a symptom, and that the only reliable formalization programme in history is growth. The counter-argument is the one Chapter 10 makes with the wage-employment overlay and this chapter with Table 6.2: a decade of measured growth ought to have moved the informal share and did not. La Porta and Shleifer describe a long-run regularity; the question is whether the mechanism that produced it is still running.
Exclusion and exit
The third reading asks why a firm or a worker is informal, and gives two answers with opposite implications. Perry and Maloney (2007), in the World Bank study of Latin America that framed the debate, distinguish exclusion from exit. Some people are informal because they are shut out: the licence is unaffordable, the credential unobtainable, the formal employer will not hire them. Others are informal by choice, having compared what formality costs with what it delivers and concluded that the state’s offer is not worth the price. Maloney (2004) made the stronger version: much informal self-employment is a destination rather than a holding pen, chosen for autonomy by people who could have taken a formal job.
The African evidence sits between the two, and the balance depends on what the state is offering. Where formality buys nothing, no pension worth having, no enforceable contract, no credit, exit is rational and formalization campaigns fail, which is what the experiments below found. Where it buys something concrete, take-up rises and so, sometimes, do profits. The question is not whether informality is exclusion or exit but what the state is selling and at what price.
Networks, and the missing middle
The fourth reading is that the informal economy is not an absence of institutions but a different set of them. Meagher (2010), working on the Igbo trading and manufacturing networks of southeastern Nigeria, describes an economy governed by apprenticeship obligations, hometown associations, kinship and reputation, which do the work that contracts and courts do elsewhere: enforcement, credit, entry control, dispute settlement. Fafchamps (2004) reaches the same place from the economics side, showing how African firms substitute relationships for legal enforcement and what that costs in the size of the market a firm can safely trade in. The strength of this reading is that it explains why informal sectors are not chaotic; the weakness is that networks which enforce contracts also ration entry, and a system in which trading rights are inherited or earned through years of unpaid apprenticeship is not obviously more open than a licensing regime.
Alongside it sits the oldest stylized fact in the field, the missing middle: many tiny firms, a few large ones and almost nothing between, the gap explained by regulatory thresholds that punish growth. The fact is contested. Hsieh and Olken (2014) looked for it in Indian, Indonesian and Mexican manufacturing and found firm-size distributions smooth, with no bunching below the thresholds where regulation bites. Ulyssea (2018), on Brazil, offers the reconciliation: informality has several margins, so a policy that closes one pushes firms onto another. Benjamin and Mbaye’s large informal firms are the African version of the point, and the missing-middle story says they should not exist.
How it actually works
Four institutions carry most of the informal economy here, and none appears in the national accounts as itself.
The market. The large West African markets are institutions with governance, not places with stalls. Onitsha, Kumasi’s Kejetia, Lagos’s Alaba, Dakar’s Sandaga: each has traders’ associations that allocate space, arbitrate disputes and bargain with the state over tax and eviction. Prices are set in a network of dealers whose information is expensive, which is why Aker (2010) could show that mobile telephony in Niger reduced grain-price dispersion across markets. That is the informal economy’s productivity story in miniature: not a new technology of production but a cheaper technology of information.
The road. Urban transport is almost everywhere informal, owner-operated and route-organized: the danfo of Lagos, the matatu of Nairobi, the tro-tro of Accra, the chapa of Maputo, the taxi-brousse between towns, and above all the motorcycle taxi, the boda boda of East Africa and the okada of Nigeria. Kampala’s fleet shows what informality does to measurement: published estimates of riders in the city run from about 145,000 to several hundred thousand, and officials have quoted figures above a million for the country, with no register able to settle it (Observer, 2025). Every one of those riders is employed on the international definition, most own or hire a machine and work without insurance, and all would appear in Chapter 10’s middle term as a success.
The workshop and the apprentice. Informal manufacturing happens in the open-air yards Kenyans call jua kali and in the roadside sheds of every West African city, and its training system is the apprenticeship. In Ghana it trains on the order of four times as many young people as all the formal technical and vocational alternatives combined, concentrated in tailoring, carpentry, hairdressing, welding and mechanics (Darvas and Palmer, 2014), and the ILO’s guidance for the continent treats it as a system to be upgraded rather than replaced (ILO, 2012). It typically involves a fee paid by the apprentice or the family, several years of low or unpaid work, and a graduation at which the master helps the apprentice set up: a credit market and a labour market at once, in which the fee runs in the direction that says which side is scarce. The trainee pays the firm. The North African version is the workshop economy of Cairo, where small unregistered producers of furniture, garments, metalwork and car parts sit outside a banking system that lends overwhelmingly to the state and a handful of large firms, the mechanism Adly (2020) puts at the centre of Egypt’s failure to build a middle tier of firms.
The savings circle. Almost no informal enterprise here is financed by a bank. It is financed by retained earnings, family, supplier credit and rotating savings and credit associations: the esusu of the Yoruba, the adashi of the Hausa, the tontine of francophone Africa, the susu collector of Ghana, the chama of Kenya, the stokvel of South Africa. A fixed group contributes a fixed sum on a fixed cycle and the pot goes to each member in turn. What they supply is less credit than commitment: a way of saving that the household cannot easily raid and the extended family cannot easily claim. That is a reason to be careful with the assumption that the binding constraint on a small African firm is the interest rate.
Two further pieces are owned elsewhere. Informal cross-border trade is a large share of what actually crosses African borders and is conducted overwhelmingly by women, with regional simplified trade regimes built to accommodate it; the companion volume documents the shares and Chapter 19 carries this book’s version (Wilse-Samson, 2026). And mobile money is the interface between the two economies, the first formal financial product most informal workers have held and the thing that turns a cash business into a business with a record a lender or a tax authority could read: about $1.4 trillion moved through it in Sub-Saharan Africa in 2025, roughly two thirds of the global total (GSMA, 2026). The point here is that the cost of making an informal firm legible has collapsed and legibility has not produced formalization, which is the puzzle the next box is about.
What the experiments say
Does formalization change productivity, or only registration?
Formalization is one of the most heavily randomized questions in development economics, which is fortunate, because it is one where intuition and evidence point in opposite directions.
Registration is cheap to buy and does nothing on its own. De Mel, McKenzie and Woodruff (2013) offered informal firms in Sri Lanka, at random, information about how to register and reimbursement of the direct costs. Nothing happened. Payments worth half to one month of the median firm’s profits registered about a fifth of them, and two months registered about half, so the demand curve is real and steep. The consequences were the interesting part: mean profits rose, but almost entirely through a few firms that grew fast, and the most common reason for not registering turned out to be a land-ownership problem rather than a fee. That is the comparison case for everything below.
The African replications agree. Benhassine, McKenzie, Pouliquen and Santini (2018) evaluated Benin’s entreprenant status, a simplified legal form created precisely to lower the cost of formality, in treatments that added, in steps, training, a bank account and tax mediation. The fullest package raised tax formalization by about 16 percentage points, the lighter ones by about 10 and 13. None raised revenues or profits, and the fullest cost more per firm formalized than the tax revenue it produced. Campos, Goldstein and McKenzie (2023) ran the sharpest version in Malawi, with about 3,000 firms and three arms: costless business registration, registration plus tax registration, and registration plus a bank information session ending in the offer of a business account. Take-up of business registration was high and of tax registration low, which tells you what firms think they are buying, and profits rose only in the arm that came with a bank account, for both men and women.
The systems answer is therefore specific. Formalization is not a productivity intervention but a distribution channel for something else, and it works when that something else is a financial relationship the firm could not otherwise get. A registration certificate is a piece of paper; a bank account is a claim.
What did move small African firms was labour and capital, not paperwork. Hardy and McCasland (2023) offered small Ghanaian firms an apprentice at no cost, across 32 districts and five trades, and found that each placement offered raised firm size by about half a worker and profits by about 10 percent. That design is why this is the book’s named experiment for the subject: a firm constrained by the wage should gain little beyond the subsidy, while a firm that cannot find and screen a trainee should gain a great deal. The missing employment in Chapter 10’s middle term is therefore partly a matching problem, which is cheaper to fix than a productivity problem. And McKenzie (2017), evaluating Nigeria’s business-plan competition, in which grants of about $50,000 went to young entrepreneurs by a partly randomized procedure, found substantial effects on firm survival, size and employment. The small-firm sector is capital-constrained at the top of its distribution and not at the bottom.
Put them together and the shape is consistent. Making it easier to be formal does not make firms better. Giving firms a worker they could not find, or capital at a scale nobody would lend them, sometimes does. The policy question is not how to move firms across the line but what sits on the other side of it worth crossing for.
Informality in two worlds
Chapter 1 set out the assumption underneath the identity, that the marginal worker still matters, and asked what each term becomes if it fails. The question is sharpest here, because informality is the mechanism through which African labour markets have absorbed everybody the formal economy did not want.
In the labour-abundant world, informality is a waiting room with a productivity problem. It is where the cohort goes while the formal economy is too small to take it, and the programme follows: raise the productivity of the work people already do, since Filmer and Fox (2014) established that the African youth problem is earnings rather than joblessness; build the formal sector fast enough to pull people out; and do not destroy the waiting room meanwhile, because it is the only social protection most of these countries have.
In the labour-redundant world, informality is the residual claimant on a labour force the frontier does not need. If output at the frontier becomes a function of installed compute, energy and capital, with labour a complement at best (Acemoglu and Restrepo, 2019), the formal sector stops being the destination and the waiting room stops being temporary. Two readings of that are both defensible.
The pessimistic one is that informality becomes a holding pen with no exit, and Table 6.1 stops being a snapshot of a transition and becomes the steady state. The between-sector term in Table 6.2 would then be measuring the last reallocation these economies ever make, out of agriculture into urban services, with nowhere further to go. Chapter 10 makes the fiscal version: a continent whose median informality rate is 89.1 percent has almost no payroll to tax, so any serious transfer system would have to be financed from rents rather than wages.
The optimistic one is that the informal economy is the last place employment persists, because it is cheap, local and hard to automate. A machine that answers a call in Nairobi does not repair a motorcycle in Kampala, cut cloth in Dakar or carry a headpan in Onitsha. On the ILO’s estimates the continent is the least exposed place on earth to the first wave of automation, for the uncomfortable reason that so much of its employment is agricultural and informal (Gmyrek, Berg and Bescond, 2023). If the frontier removes formal, tradable, graduate-absorbing work first, the last jobs standing in Africa are the ones described above, and the informal economy will have gone from the thing development was supposed to eliminate to the thing that survived it.
Both readings share a conclusion. The box’s question changes meaning between the worlds. In the first, formalization is worth doing if it is a route to the formal sector’s higher productivity. In the second there may be no formal sector to route anybody into, and the only defensible reasons to formalize are the ones the Malawi experiment found: a bank account, an enforceable claim, a record that entitles somebody to a transfer. Registration would stop being a step towards a job and become an entry in the register of who is owed something, which is the distributional question Chapters 23 and 35 take up.
Connections to Other Chapters
- Chapter 1 (Africa in Numbers) states the identity this chapter splits and the data-quality layer that decides how hard to lean on any of its numbers; Chapter 4 (The Case and the Counter-Case) stages premature deindustrialization and the dual-firm finding as objections.
- Chapter 5 (States, Political Settlements, and Development Bargains) supplies the vocabulary for a state that chooses not to see a sector, which is what the tax-net reading describes.
- Chapter 10 (Labor, Youth, and Migration) owns the identity’s middle term and the jobs thesis; the overlap measured here is the asterisk on its central overlay.
- Chapter 16 (Finance and Fintech) owns mobile money and the credit question the savings circles raise; Chapter 20 (Human Capital) owns the apprenticeship as training rather than as employment.
- Chapter 22 (Land) carries the urban half and the land-title problem that turned out to bind on registration in Sri Lanka; Chapter 23 (Inequality, Social Protection, and Health) prices a transfer system in an economy with no payroll.
- Chapter 24 (Lagos-Abidjan) is the pole where the urban informal economy is largest and Chapter 27 (Cairo-Suez) the one where informal workshops sit inside a state with wide statistical reach; Chapters 30 and 35 carry the Zambian decade behind this chapter’s most extreme decomposition and the labour-redundant world as a scenario axis.
Discussion Questions
On 42 of the 44 cards carrying both overlays, the informal and wage-employment shares sum to more than 100, with a median excess of 16 percentage points. A colleague proposes a single “good jobs” indicator equal to wage employment minus that excess. Set out what it would and would not measure, name two countries where it would change the ranking most, and say whether a single number is the right answer to a two-dimensional question.
Zambia’s within-sector component was minus 1.79 percentage points a year against a between-sector component of plus 2.87, and output per worker still grew at only 1.08 points a year. Write down what sequence of events inside a copper economy would produce that pair, then say which component you would expect to reverse first and what evidence would tell you it had.
The randomized evidence says that making formality cheaper does not make firms more productive, and that only the arm bundling registration with a bank account raised profits. One conclusion is that formalization policy wastes money; another is that it is a delivery mechanism attached to the wrong product. Argue for one, then say what a government with a fixed budget should do instead for the woman in Table 6.1’s top band, whose country has 14.7 percent wage employment at the median.
Try It
Open the three cards side by side: Burkina Faso, Ghana and Zambia, in that order. Each has one of the three shapes in Table 6.2: reallocation carrying everything while the within term is negative, within-sector gains against reallocation that subtracts, and the first shape again in its most extreme form, where the sectors got worse by more than the move was worth. For each, read the two decomposition fields, then the informal, wage-employment and non-agricultural shares, then the last labour-force survey year and the confidence flag. Write one paragraph on a single question: which of the three would you describe to a minister as having had a structural transformation, and what would you have to add to the card to make that description defensible?
Data Exercise
Download all fifty-four cards from the country cards page on this site, as cards.csv or as cards.json if you want the release each number came from travelling beside it. Build a table with six columns: overlays.output_per_worker_within, overlays.output_per_worker_between, identity.output_per_worker_growth, scale.informal_employment_share, overlays.wage_employment_share and data_quality.confidence_flag. Then do four things. First, restrict to the cards carrying both decomposition fields, confirm there are 21, and count how many have both components positive; check your count against this chapter’s twelve and name the countries. Second, rank the 21 by the between-sector component, take the top five and the bottom five, and compare the median informal share of the two groups; the chapter reports 84.3 percent against 55.6, and you should be able to say in two sentences what that gap means for the claim that reallocation is a route out of informality. Third, compute the correlation between the between-sector component and the informal share across the cards carrying both, then the same for the within-sector component, and explain why the answers differ. Fourth, for every card carrying both employment overlays, compute scale.informal_employment_share plus overlays.wage_employment_share minus 100, sort it, and write two sentences on what the countries at the top have in common. Note which fields are null rather than zero, and never impute a null as a zero.
Data Sources and Further Reading
Key data sources
- ILOSTAT modelled estimates (November 2025): the informal-employment share on 45 of the 54 cards, with the wage-employment and non-agricultural overlays beside it. The share is informal employment as a percentage of total employment on the 2003 job-based definition, modelled rather than surveyed; the survey year on each card says how much of the model rests on a national observation.
- GGDC Economic Transformation Database: the within-sector and between-sector split, over 2008 to 2018 on a twelve-sector breakdown, for the 21 African countries it covers. The components sum to the annualised growth of output per worker over that window, not to the third term as the cards measure it.
- IMF World Economic Outlook, April 2026 for income per head, and UN World Population Prospects 2024 (medium variant, ages 15 to 64) for the population weights.
- ILO statistical standards: the 1993, 2003, 2013 and 2023 resolutions of the International Conference of Labour Statisticians, and Recommendation No. 204 (2015) on the transition to the formal economy, the framework most African labour ministries now write against.
- National statistical offices publishing their own informality series on their own definitions, the Haut-Commissariat au Plan above all, which is why the Moroccan card carries no ILO share.
Further reading
- Keith Hart (1973) and the ILO’s Kenya mission report (1972), for where the term came from and what it was meant to do.
- Nancy Benjamin and Ahmadou Aly Mbaye, The Informal Sector in Francophone Africa (2012), for large informal firms and the selective enforcement that sustains them.
- Rafael La Porta and Andrei Shleifer (2014), for the case that informal firms do not become formal firms, with Guillermo Perry and co-authors, Informality: Exit and Exclusion (2007), and William Maloney (2004), for the debate about why anybody is informal.
- Kate Meagher, Identity Economics (2010), and Marcel Fafchamps (2004), for the informal economy as a set of institutions rather than an absence of them; Chang-Tai Hsieh and Benjamin Olken (2014) and Gabriel Ulyssea (2018) for why the oldest stylized fact in this field may not be a fact.
- Margaret McMillan and Dani Rodrik (2011) and McMillan, Rodrik and Verduzco-Gallo (2014) for the decomposition, with Diao, Ellis, McMillan and Rodrik (2021) for the firm-level structure underneath it and Kruse, Mensah, Sen and de Vries (2023) for the qualifier.