20. Human Capital
Nine of every ten ten-year-olds in Sub-Saharan Africa cannot read and understand a simple written text, on the measure the World Bank and its partners maintain (World Bank and partners, 2022). Almost all of them are in school. That pair of sentences is what this chapter is about, and the second half of the pair is the part that has changed: a continent that in 1990 could not get its children into classrooms has very largely got them in, and the classrooms are not doing what the enrolment statistics were taken to imply they were doing.
Learning Objectives
After reading this chapter, you should be able to:
- Place human capital inside the book’s identity: why it is an input to the third term rather than a term of its own, how it reaches the second term through participation, and why it therefore cannot be read off a growth rate.
- State the diagnostic test the growth-pole chapters apply to skills, say what those chapters find, and set out the puzzle that follows: poor schooling outcomes in economies where the price of skill is not being bid up.
- Describe how an African school system works as a labour market, with teacher pay, teacher absence, time on task and the examination at the centre, and say which of those a ministry can actually move.
- Distinguish the three candidate constraints on learning, inputs, pedagogy and the system that delivers them, and say which one the randomized evidence points at.
- Say what schooling is for in each of the book’s two worlds, and why a continent of young people is an asset in one and a liability in the other.
Prior work: the mutual-recognition arrangements for professional qualifications, and the cross-border mobility of doctors, nurses, engineers and accountants inside the regional communities, are set out in the companion volume, The New Regional Economics, chapter 14 (Wilse-Samson, 2026). This chapter cites that material rather than repeating it.
Where human capital sits in the identity
The identity this book runs on has three terms and human capital is not one of them. GDP growth is approximately the growth of output per worker, plus the growth of the employment-to-working-age ratio, plus the growth of the working-age population. Schooling and health enter as inputs to the third term, because a better-educated worker produces more per hour, and they reach the middle term through participation, because a girl who stays in school to eighteen is not employed at sixteen and is more likely to be employed at twenty-five. What they never are is a term. There is no growth rate of human capital in the decomposition, which is why this chapter cannot be written the way Chapter 10 was, by reading a number off fifty-four cards and sorting it.
That is not a technicality. It is why human capital arguments in development are so hard to settle. A country can double its years of schooling and see nothing happen to output per worker for twenty years, and two entirely different explanations fit: the schooling was worthless, or the schooling was fine and there was nothing for the schooled to do. Distinguishing them means looking at prices rather than quantities, and that is where the growth-pole chapters have already been.
What the pole chapters found
Every chapter in Part VI runs a growth-diagnostics tree in the form Hausmann, Rodrik and Velasco (2005) gave it, and each reaches the human-capital branch and eliminates it. The reasoning matters here because this chapter’s puzzle is its consequence. The test for a binding skill constraint is not whether schooling outcomes are bad. It is whether the return to skill is being bid up: whether firms are paying more, and more each year, for workers they cannot find. If skills bind, employers bid, wages for the educated rise faster than everyone else’s, and graduates are scarce. That is a price test, and prices are observable.
Every pole failed that test in the same direction. Graduates in Lagos, Accra and Dakar are not scarce and positions for them are (Chapter 24). A third of Gauteng’s labour force cannot find work at all (Chapter 25). Nairobi has the best-educated labour force in its region and a wage-employment share that has not risen (Chapter 26). Cairo has an offshoring industry that exists precisely because Egyptian graduates can be hired cheaply (Chapter 27). Addis Ababa expanded its universities faster than their staff and absorbs its young labour force into agriculture rather than into a queue (Chapter 29). The Copperbelt imports the handful of specialists it cannot find locally and fills everything else without difficulty (Chapter 30). Eight poles, eight eliminations, and in every case the chapter added that Chapter 20 takes the schooling problem seriously.
This chapter takes it seriously. It also has to explain the thing the pole chapters kept handing forward, which is a genuine puzzle and not a rhetorical one: a continent with among the worst schooling outcomes in the world, in which the price of skill is not rising. Both halves are true. The rest of the chapter is an attempt to hold them together.
What the measures say
Start with the supply side, the half everybody agrees about.
The headline measure is learning poverty, the share of ten-year-olds who cannot read and understand an age-appropriate text. In Sub-Saharan Africa it stands at 89 percent against 70 percent for low- and middle-income countries as a group, with pre-pandemic figures of 86 and 57 percent, which says the pandemic did comparatively little damage here because there was less left to damage and schools reopened sooner (World Bank and partners, 2022). A measure at 89 percent is close to its ceiling and therefore close to useless for ranking countries, which is why this chapter leans on a second one.
The second is the World Bank’s Human Capital Index: what fraction of her potential productivity a child born today can expect to reach, given the schooling and health she can expect to receive, against a benchmark of complete education and full health. It is a stock rather than a flow, runs from zero to one, and averaged 0.56 worldwide on the 2020 round (World Bank, 2020b). This chapter assembles it for nineteen African countries, one brief at a time, and it should be read as that: a nineteen-country series, not a continental average, whose members are systematically better measured than the thirty-five outside it. Its median is 0.40 and its range runs from 0.32 in Niger to 0.62 in Mauritius, the only country in the series above the world average (World Bank, 2020b).
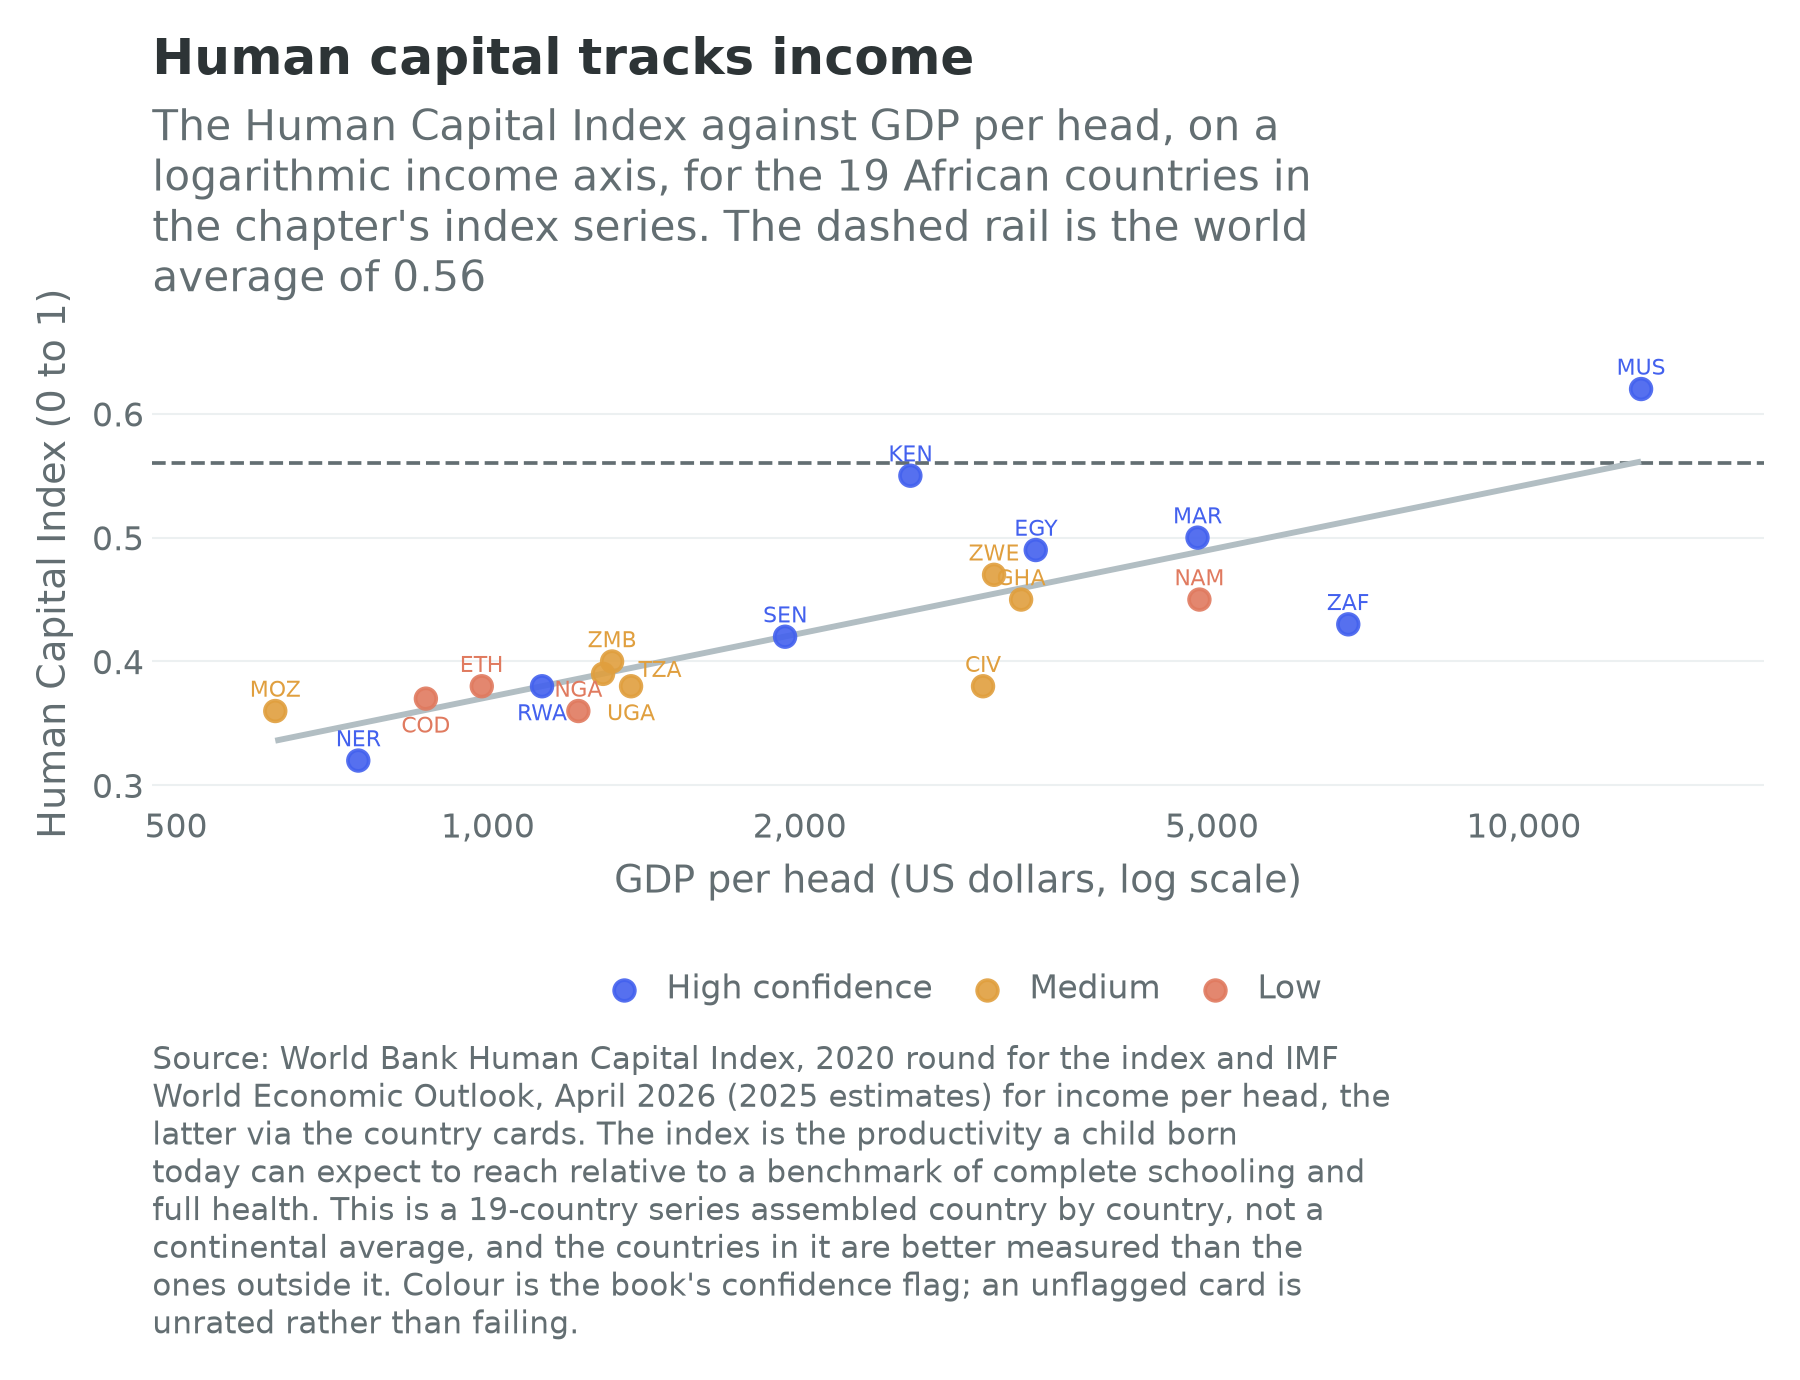
Figure 20.1 is the first useful thing the index does, and it is a caution rather than a finding. Across the nineteen it correlates with the logarithm of income per head at 0.82, about as tight as any cross-country relationship in this book. Human capital in Africa is, to a first approximation, a restatement of income. Kenya at 0.55 sits well above its income line and Côte d’Ivoire at 0.38 well below, and those residuals are worth arguing about, but the dominant pattern is the slope: a reader who takes the index for a measure of how hard a government has tried is reading mostly how rich the country is.
The quantity measures add the shape of the problem. The gross tertiary enrolment ratio in Sub-Saharan Africa is about 9 percent against a world average of about 43 percent, the lowest of any region, and it rose by about five percentage points over the two decades to 2020 even as the count of higher-education institutions grew by roughly 153 percent between 2006 and 2018 (UNESCO, 2022). More institutions, barely more of the cohort: that is the university story below, in one line. At the other end, 273 million children and young people were out of school worldwide in 2024, more than half of the out-of-school children and adolescents were in Sub-Saharan Africa, and the low-income out-of-school population has risen by about 29 percent since 2015 while staying broadly flat elsewhere (UNESCO, 2024). That rise is not a failure of enrolment rates. It is population growth outrunning classrooms, which is Chapter 2’s arithmetic arriving where it was always going to.
Years of school and years of learning
The index’s most useful internal distinction is between the years a child spends in school and the years of learning those years are worth. A Kenyan child can expect about 11.6 years of schooling by age eighteen, worth about 8.5 learning-adjusted years; a Ghanaian child can expect the same 11.6 years, of which about 5.7 are lost to how little is learned in them, leaving roughly 5.9 (World Bank, 2020b). Two countries with identical school careers and a gap of two and a half years of actual learning between them. The Sub-Saharan average expected duration is about 8.6 years (World Bank, 2020b), so the average African child is now in school for most of a full primary and lower-secondary career.
That is the finding under all the others. The enrolment battle of 1990 to 2015 was substantially won. The learning battle was not fought, because the instrument that won the first one, abolishing fees and building classrooms, does nothing for the second and in the short run makes it worse.
What the cards can and cannot say
The country cards carry no education field at all. There is no schooling variable, no literacy variable and no learning measure on any of the fifty-four, which is a real limit on this chapter and one it states rather than works around. What the cards carry is the labour-market side: the three identity terms, the wage-employment share, and the share of young people not in employment, education or training.
| Country | Term one: working-age population | Term two: employment ratio | Term three: output per worker | Wage employment (percent of employment) | Youth not in work, school or training (percent) | Confidence |
|---|---|---|---|---|---|---|
| Nigeria | 2.90 | 0.29 | -1.94 | 13.6 | 11.9 | low |
| Ethiopia | 3.46 | -1.58 | 5.91 | 15.4 | 17.5 | low |
| Egypt | 1.96 | 0.07 | 2.26 | 72.9 | 23.8 | high |
| Tanzania | 3.55 | 0.03 | 1.92 | 14.5 | 12.8 | medium |
| Kenya | 2.94 | -1.17 | 2.84 | 35.1 | 18.5 | high |
| South Africa | 1.61 | -0.45 | -0.48 | 82.7 | 34.6 | high |
| Uganda | 4.17 | 0.33 | 0.22 | 19.3 | 13.8 | medium |
| Morocco | 1.10 | -0.45 | 1.88 | 59.6 | none | high |
| Mozambique | 3.25 | -0.47 | 0.57 | 14.5 | 19.2 | medium |
| Ghana | 2.52 | -1.56 | 3.48 | 32.2 | 23.9 | medium |
| Côte d’Ivoire | 2.88 | 0.11 | 2.90 | 28.7 | 18.8 | medium |
| Niger | 4.01 | 0.81 | 0.84 | 10.3 | 15.7 | high |
| Zambia | 3.70 | 0.59 | -0.93 | 27.9 | 26.7 | medium |
| Senegal | 3.51 | 1.50 | 0.27 | 35.3 | 35.2 | high |
| Rwanda | 2.83 | 0.65 | 3.26 | 59.1 | 25.9 | high |
| Continental median | 2.89 | -0.15 | 0.74 | 31.0 | 24.4 |
The first three columns are annual growth rates in percentage points over 2014 to 2024; the next two are shares; the last is the book’s own flag. Term one is the working-age population aged 15 to 64, term two modelled employment aged 15 and over divided by that population, term three the residual output-per-worker series. The youth measure is on 48 of the 54 cards and Morocco is one of the six without it. The median row is taken column by column and is not a country. Sources: UN World Population Prospects 2024, ILOSTAT modelled estimates (November 2025) and the IMF World Economic Outlook (April 2026), via the country cards.
Those fifteen hold 62.1 percent of Africa’s population and produce 63.8 percent of its output, and by 2050 they rise from 941 million people to 1,481 million on the medium variant. Seven of the fifteen carry a high confidence flag, six medium and two low, so this is the better-measured end of the continent and the table should be read as such.
The price of skill
Now the demand side, where the puzzle lives.
Begin with the fact that seems to settle the argument the other way. On the most comprehensive comparable estimates available, from 139 economies and more than 800 harmonized household surveys, the private return to an additional year of schooling averages about 10 percent a year worldwide and is highest in Sub-Saharan Africa at about 13 percent, with the five highest-return economies in the world all African: Botswana, Ethiopia, Rwanda, South Africa and Tanzania (Montenegro and Patrinos, 2023). If schooling pays 13 percent a year, why is anyone arguing?
For two reasons, and they are the chapter’s argument. The first is that a Mincerian return compares educated with uneducated workers; it does not say whether the price of skill is rising. Where a secondary certificate is the entry ticket to a small formal sector, the gap between those who hold one and those who do not can be enormous and stable for decades, because the certificate rations access to a fixed number of positions rather than being paid for what it produces. A high, flat return is exactly what you would see if education were a queue-position good, and also what you would see if it were productive and scarce. The level does not distinguish them; the trend does, and the trend in the countries this book covers is not one of skill premia opening up. The second reason is simpler: the return accrues to those who get the job, and says nothing about how many do.
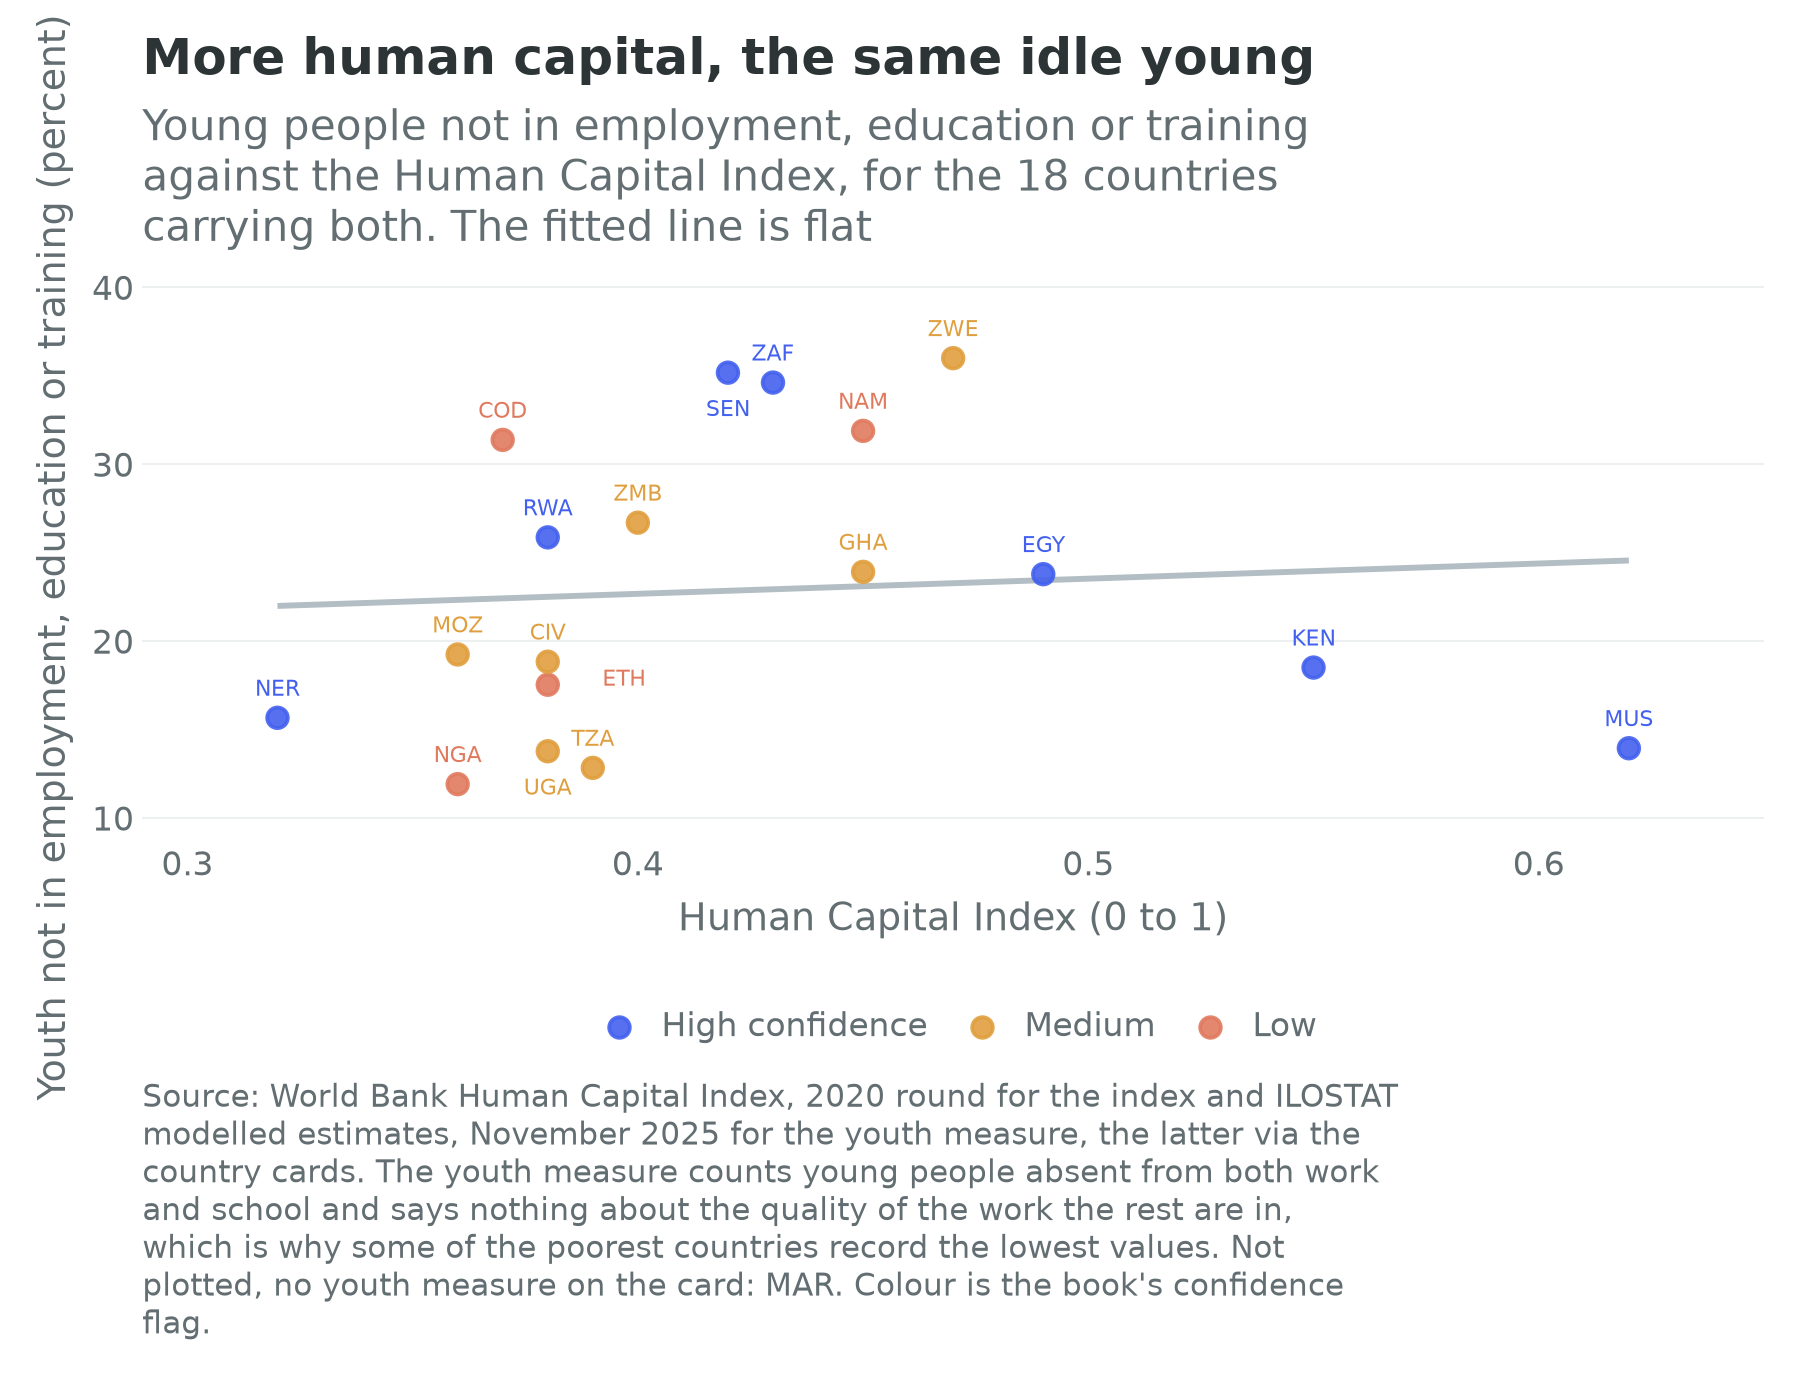
Figure 20.2 puts the two together, and the result is the chapter’s first hard finding. Across the eighteen countries carrying both, the correlation between the Human Capital Index and the share of young people not in employment, education or training is 0.08, which is nothing at all. Kenya, with the highest index in the series at 0.55, records a youth measure of 18.5 percent; Zimbabwe, at 0.47, records 36.0; Nigeria, at 0.36, records 11.9. Whatever determines how many young Africans are neither working nor studying, it is not how much human capital their country has built.
That could still be read charitably. Chapter 10 showed that this overlay is not an income measure either, correlating with the logarithm of income per head at about minus 0.04, because in a subsistence economy a young person without a job is not idle but on the farm. So a flat line against human capital might only mean the measure is too blunt to see anything. The next figure is harder to explain away.
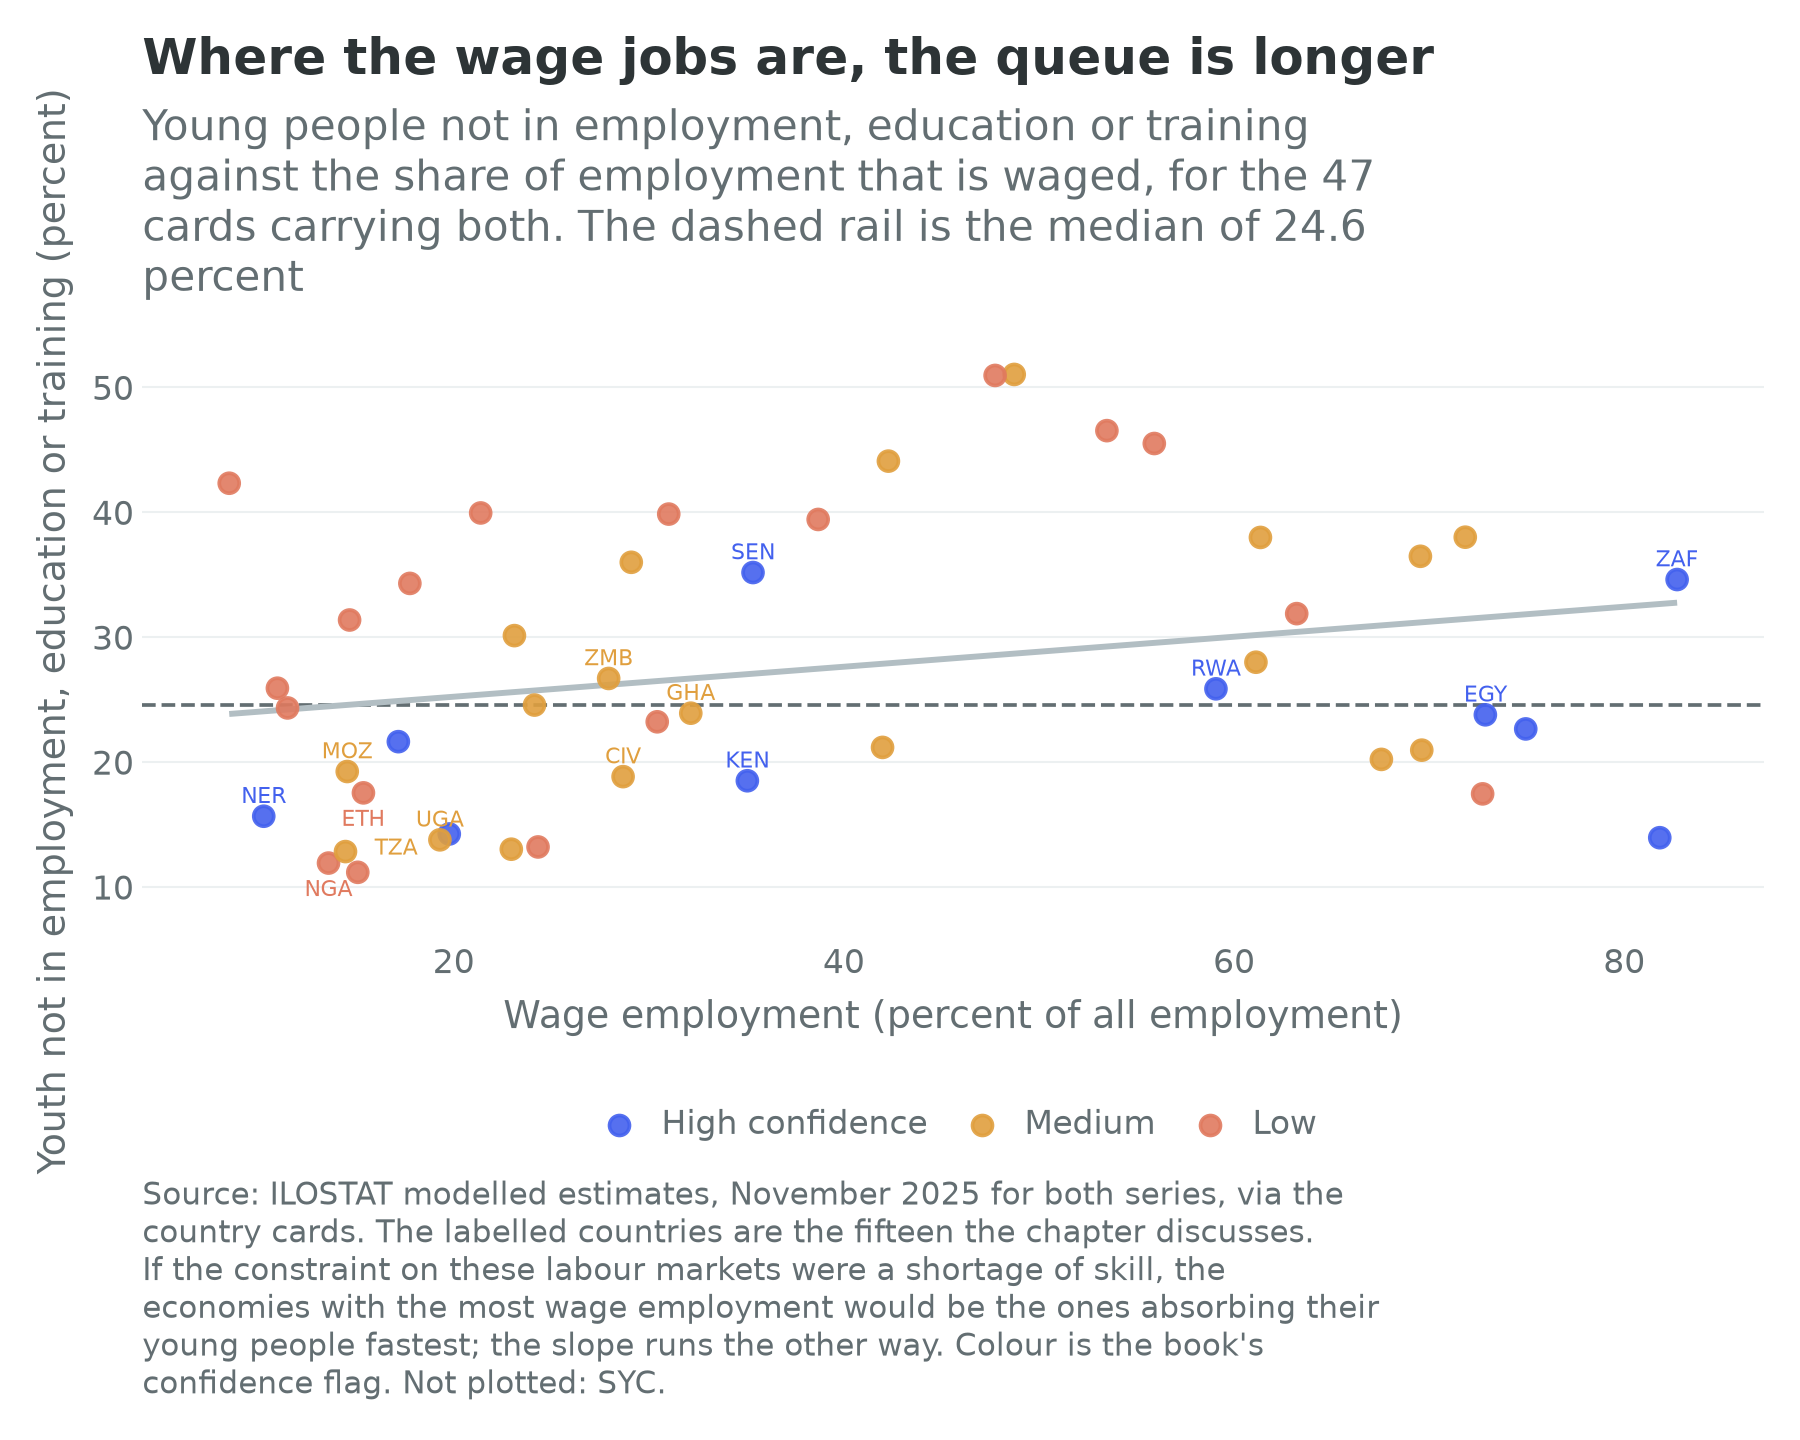
Figure 20.3 plots the youth measure against the wage-employment share for the 47 cards carrying both. If skill were the binding constraint, the economies with the most wage employment, which are the economies where a certificate is worth most and where employers most need trained workers, should be the ones absorbing their young people fastest. The correlation runs the other way, at plus 0.24. South Africa has the continent’s highest wage-employment share at 82.7 percent and a youth measure of 34.6; Botswana runs 71.9 and 38.0; Lesotho 61.4 and 38.0; Eswatini 69.6 and 36.5; Namibia 63.2 and 31.9. At the other end, Niger runs a wage share of 10.3 percent and a youth measure of 15.7, and Nigeria 13.6 and 11.9.
The mechanism is not mysterious, and it is why the pole chapters kept eliminating the skills branch. In an economy with no wage sector an unemployed young person is a contradiction in terms: there is nothing to be unemployed from, so she farms, trades or minds a stall, and counts as employed. In an economy with a real wage sector, waiting for a job in it is a rational use of a year, so young people wait, and the waiting registers as idleness. The Southern African cluster is the extreme case and the mechanism generalizes. What the figure shows is queueing, and the queue lengthens where there is something worth queueing for, not because the queuers are unqualified.
One more card fact completes the picture. Across the nineteen countries in the index series, the correlation between the index and the decade’s growth of output per worker is 0.14. Ethiopia, with an index of 0.38, posted the fastest output-per-worker growth of the fifty-three at 5.91 percent a year, nearly three times the 2.02 percent of Mauritius, which holds the highest index in the series; Zimbabwe, third in the series at 0.47, saw output per worker go nowhere at all over the decade. Over a decade and nineteen countries that is not evidence that human capital does not matter for productivity, and it could not be. It is evidence that over the horizon a government works on, something else was doing the moving.
Resolving the puzzle
Put the two halves together and the resolution is the one Chapter 10 reached about employment generally, arriving one step earlier in the sequence. Schooling outcomes are bad and the price of skill is not rising, and both are true because the demand side is missing. Firms that would bid for skill are not there in the numbers that would make bidding happen: the missing middle of Chapter 6, the dual-firm structure of Diao, Ellis, McMillan and Rodrik (2021), the small firms that add employment without raising productivity and the large firms that raise productivity without adding employment. A graduate in Accra faces an economy in which the number of jobs that use a degree is small, fixed in the short run, and largely in the public sector or in the enclaves attached to it. Filmer and Fox (2014) put the general version of this in the form that has held up: the African youth employment problem is not mainly one of joblessness but one of earnings, and the question is not how to occupy young people but how to raise the productivity of the work they already do.
This is not a counsel of despair about schools and emphatically not an argument for spending less on them. It is an argument about sequence and expectation. A school system that taught better would raise output per worker over twenty-five years. It would not, on this evidence, create the vacancy missing next year, and a government that sells education reform as a jobs programme is arranging to be disbelieved by the cohort it disappoints.
How the school system actually works
A school system is a labour market, and most of what is wrong with African schooling is a fact about that labour market rather than about pedagogy.
The teacher
Teachers are the largest professional workforce most African states employ and, in several countries, the largest single line in the recurrent budget. Whether they are well paid has been argued badly for twenty years, because the two natural comparisons give opposite answers: against national income per head African teacher salaries look generous, often several times average income; against what a similarly educated worker earns in the formal private sector they look thin. The most careful attempt to settle it, using household surveys from fifteen African countries, finds teachers earning less than comparable formal-sector workers in seven of the fifteen, but working significantly fewer hours, so that hourly earnings are lower for teachers in only one (Evans, Yuan and Filmer, 2022). The paradox of loud strikes and apparently high pay dissolves into a statement about hours, security and the alternative.
That tells you what the job selects for. A post that pays a multiple of national income, cannot easily be lost and demands fewer hours than the alternatives is a good job in a poor country, and it will be rationed, competed for and, in places, sold. It is also a post whose holder has limited reason to fear the consequence of not turning up.
Absence and time on task
The single most important body of evidence about African classrooms is the service-delivery survey work, which sends enumerators to schools unannounced and looks. Across seven Sub-Saharan countries, covering about 2,600 schools, more than 21,000 teachers and 24,000 students, 44 percent of teachers were absent from the classroom, either from the school altogether or in the school and not teaching; students received about two hours and fifty minutes of teaching a day, a little over half the scheduled time (Bold, Filmer, Martin, Molina, Rockmore, Stacy, Svensson and Wane, 2017). The same survey tested the teachers on the material they teach. Only about 7 percent of language teachers reached its threshold for minimum subject knowledge, answering at least 80 percent of a lower-primary language test correctly; in mathematics about 40 percent did, ranging from about 75 percent in Senegal to about half that share in Nigeria (Bold, Filmer and others, 2017).
Read the two together and the arithmetic is brutal. If a child gets half the scheduled hours from a teacher with a better-than-even chance of not having mastered the lower-primary curriculum, then eleven years of expected schooling worth six learning-adjusted years is not a mystery; it is what you would predict. It also locates the problem: not in the number of children in school, not in the number of teachers hired, but in what happens between the two, which is the hardest thing for a ministry to change and the easiest for a donor to fund around.
The examination and the private tutor
Every African school system this chapter touches is organized around a terminal examination: the certificates that determine who continues and who stops. It is the system’s only credible signal and, being the only one, it absorbs everything, so that teaching becomes examination preparation from the middle of primary school. Where the examination is high-stakes and the school day short, a parallel private market appears: paid tutoring after hours, frequently supplied by the same teachers whose absence the surveys record, which converts a public entitlement into a private good, most efficiently for the households best able to pay.
This is not an African peculiarity; the same market exists in Seoul and in London. What is specific here is the combination of a very short effective school day, a teaching force with weak subject knowledge, and an examination that rations the next stage. That combination guarantees that the private tutor is where a great deal of the instruction actually happens, and it means measured public spending per pupil understates what households spend on schooling by an unknown but large margin.
Language
An African child is frequently taught in a language nobody at home speaks. The colonial languages remain the medium of instruction across much of the continent, often from the earliest grades, and the evidence that this is costly is now reasonably strong: children taught in a familiar language are on the order of 30 percent more likely to read with understanding by the end of primary school. Just over half of African countries, 31 of 55, have adopted bilingual or multilingual policies, and 23 of those switch to the second language before grade five, early enough to lose most of the benefit (UNESCO, 2025).
The reason policy and practice diverge is not ignorance. Parents want their children taught in the language that gets jobs, and they are not wrong about which language that is. That is the chapter’s demand-side logic arriving in the classroom: households invest in the credential the labour market rewards, and where it rewards English or French, mother-tongue instruction reads to a parent as a cheaper version of the thing. Language policy is not a technical question about reading acquisition. It is a distributional question about who gets access to the queue.
The fee question, and the cohort arriving
The great achievement of the period is the abolition of primary fees, and it is worth being precise about what it did. Uganda abolished them in 1997 and gross primary enrolment rose from 77 percent in 1996 to 137 percent in 1997, net enrolment from 57 percent to 85 percent, while the pupil-teacher ratio went from 37.6 to 59.4 in a single year (Deininger, 2003). Kenya abolished them in 2003 and enrolment rose about 18 percent, from 5.9 million children in 2002 to 7.2 million in 2004 (Abuya, Admassu, Ngware, Onsomu and Oketch, 2015). Those are among the largest and fastest expansions of access in the history of schooling anywhere, and they were bought at a measurable price in quality, because the children arrived and the teachers, classrooms and books did not.
That trade was probably worth making, and the honest description of the last thirty years is that Africa made it and is living in the second half of it. The fee abolitions demonstrated that access responds enormously to price. They did not demonstrate, and were never going to, that learning does.
And the arithmetic is not finished. Sub-Saharan Africa needs to roughly double its teaching force, from about 8 million teachers to about 15 million, to meet its 2030 commitments, one in three of a global shortfall of about 44 million, and about 9.4 million of its requirement is for new posts rather than replacements (UNESCO, 2024). Set that beside the fifteen countries in the table, whose populations rise from 941 million to 1,481 million by 2050. A system that must hire millions of teachers in a decade, from a thin graduate pool, will hire at the margin of quality, and the service-delivery findings above describe what that looks like.
After school
The university expansion
The 2000s were Africa’s university decade. Ethiopia is the clearest case: a country with two universities for most of the twentieth century built more than forty public ones inside twenty years, with tertiary enrolment rising from tens of thousands to several hundred thousand (Saint, 2004; World Education News and Reviews, 2018). Nigeria’s expansion ran through federal, state and, above all, private institutions; in 2025 about 2.03 million candidates registered for the national university entrance examination and about 1.96 million sat it, against a materially smaller number of places (Channels Television, 2025; Adeyemi, 2025).
Two readings are available and both are correct. The first is that this was right and was done too fast: staff, libraries and laboratories did not keep pace, and a system that triples its student body in a decade produces a degree whose meaning has changed without anybody announcing it. Chapter 29 says exactly this about Ethiopia. The second is that the expansion answered demand rather than being a supply-side error. Households wanted the credential because the credential is the queue ticket, and the private university sectors of Nigeria, Ghana, Kenya and Uganda exist because families will pay for it, the alternative being not a worse degree but no degree. The pole chapters’ finding that graduates are not scarce and positions are is the same fact seen from the employer’s end.
Technical and vocational training, and the apprentice
The standard policy answer to graduate unemployment is technical and vocational education, and the standard African finding is that its formal version is small, expensive and weakly connected to employers while the informal version is large, cheap and where the training actually happens. Chapter 6 owns the apprenticeship as an institution: in Ghana it trains on the order of four times as many young people as all formal technical and vocational alternatives combined, and the trainee or the family pays the master rather than the other way round, which tells you which side of that market is scarce (Darvas and Palmer, 2014); the international guidance treats it as a system to be upgraded rather than replaced (ILO, 2012).
What belongs here is the apprenticeship as training, and the sharpest evidence is Ugandan. Alfonsi and others (2020) randomly offered young workers either six months of formal vocational training or six months of training inside a firm, following about 1,700 workers and 1,500 firms for four years. Both arms raised skills, employment and earnings; the firm-trained gained quickly and faded, the vocationally trained gained slowly and lasted, and ended ahead. The reason is certification: a worker trained inside one firm cannot prove to a second firm what she knows, so her skill is not portable and its price is captured by the firm that trained her. The missing institution is neither a school nor a firm but a credential both sides trust, and that is the strongest argument in this chapter for a specific and cheap intervention.
The body
Human capital is not only schooling. The index above is built from survival and health as well as learning, and on this continent the health inputs bind early and hard. The country cards carry no health field, and the book’s demographic benchmark table carries population and working-age totals rather than health series, so every number here is cited to a source outside them.
Three channels matter for the identity. The first is stunting: more than 150 million children under five were stunted worldwide in 2024, prevalence in Africa runs at roughly 31 percent, and Africa is the only region where the absolute number has been rising rather than falling (UNICEF, WHO and World Bank, 2025). Stunting is a proxy for chronic early-childhood undernutrition and its consequence is not only height; the literature linking early-life nutrition to later cognitive attainment is one of the more robust in development, and its implication here is that a meaningful share of the deficit measured at age ten was determined before the child reached a classroom. The second is malaria, which in the high-transmission belt costs school days, costs concentration on the days attended, and costs a household its savings when a child is hospitalized. The third is child survival itself, which Chapter 2 treats as the precondition for the fertility transition and which belongs here because a household that expects to lose children invests less per child.
The practical point is a budgeting one. A ministry of education asked why its ten-year-olds cannot read is being asked a question whose answer partly lies in another ministry’s budget, five years earlier. Chapter 23 carries the health system; what this chapter needs from it is that the cheapest available improvements in learning may not be interventions in schools at all.
The exit
The final feature of an African human-capital system is that its best output leaves.
The health workforce is the sharpest case because it is the best documented. The World Health Organization maintains a list of countries whose health-workforce shortfalls are severe enough that others should not actively recruit from them, and it includes Nigeria, Ghana and Zimbabwe. By November 2024 roughly one in eleven doctors in the English National Health Service held the nationality of a country on that list; over one in ten new registrants to the British nursing register in 2022 and 2023 had trained in such a country, more than half of them in Nigeria; and since 2018 the British nursing workforce trained in Nigeria has risen by about 46 percent, in Ghana by about 21 percent and in Zimbabwe by about 16 percent (Health Foundation, 2025).
There are two honest readings and the chapter declines to choose, because the balance depends on parameters nobody has measured well. The pessimistic one is that a poor country trains a doctor at public expense and a rich country gets the doctor, a transfer from the poorest health systems in the world to some of the richest. The optimistic one is that the prospect of emigration is itself what induces the training, so that more train than leave, and that remittances flow back. Both mechanisms are real. What is not in doubt is the fiscal accounting: the training is a public cost and the earnings are a private and foreign benefit, and no African government has found an instrument that recovers the difference without destroying the incentive.
Chapter 10 owns migration and its proportions, and its correction belongs here too: more Africans move to another African country than to Europe, by better than two to one. The mutual-recognition arrangements that would let a Kenyan engineer practise in Kigali are the companion volume’s subject (Wilse-Samson, 2026). The diaspora is a human-capital asset held offshore, and Chapter 21’s balance sheet is where to record it.
Three institutions
NewGlobe, and what a contract can buy
The most consequential and most contested education firm on the continent began as Bridge International Academies, a chain of low-fee private primary schools in Kenya, Uganda and Nigeria built on a standardized model: scripted lessons delivered to teachers on tablets, daily monitoring, centralized construction and finance. Its evidence is unusually strong. A randomized evaluation exploiting a nationwide scholarship lottery in Kenya found that two years at Bridge raised test scores by the equivalent of about 0.89 additional years of schooling for primary pupils and about 1.48 for pre-primary pupils, above the 90th percentile of the studies the authors compared them against, alongside reduced dispersion and less grade repetition (Gray-Lobe, Keats, Kremer, Mbiti and Ozier, 2022).
Its politics are equally strong and run the other way. Ugandan and Kenyan courts upheld government decisions to close Bridge schools for failing to meet registration and standards requirements; teacher unions documented the model’s reliance on staff without formal teaching qualifications and on a centrally written curriculum; and Kenyan enrolment fell from more than 100,000 pupils in 2015 to about 70,000 by the end of 2016 (Education International, 2016; Right to Education Initiative, 2017).
What the firm did next is the interesting part for this book. Rebranded as NewGlobe, it moved from selling schooling to households to selling delivery to governments: EKOEXCEL in Lagos, covering more than 350,000 pupils in more than 1,000 public primary schools, every one in the state, with more than 14,000 serving government teachers retrained (Ogundare, 2023); EdoBEST in Edo State, where enrolment reached more than 388,000 pupils across all 1,289 state primary and junior secondary schools in 2024 (ThisDay, 2024); and comparable programmes in Kwara and Bayelsa.
That is the systems question in commercial form. If the gains are real and transfer to public schools under a government contract, this is the largest single lever available to an African education ministry. If they do not transfer, the model is an argument for private provision that governments cannot use, and the state has bought scripting rather than learning. The next section is about exactly that transfer, and the Kenyan contract-teacher evidence there is not encouraging.
Andela and ALX, or skills without a market
The second institution is the skills-to-jobs pipeline, whose history is a cautionary tale about the demand side. Andela was founded on a clean thesis: train African software engineers to a global standard, place them with firms in North America and Europe, and let the placement fee fund the training. By its own count at its tenth anniversary in 2024, about 110,000 technologists had been trained through its programmes (Aimuengheuwa, 2024). In September 2019 it laid off more than 400 junior developers in Nigeria, Uganda and Kenya and closed its training programmes outside Rwanda, because, its chief executive said, most of the demand was for more experienced talent (TechCabal, 2019); another 135 staff went in May 2020 (Bright, 2020). The model survived by becoming a marketplace for engineers who were already good. ALX, out of the group that built the African Leadership University, took the volume route instead, targeting hundreds of thousands of learners a year across software, data and cloud credentials, 750,000 in 2024 alone (ITWeb, 2024).
The two together frame the chapter’s puzzle at firm level. Both are competent organizations solving the training problem. Neither creates the vacancy. Where the vacancy existed, as it did for senior engineers selling into a global market, the pipeline worked spectacularly; where it did not, no amount of training converted into employment, and the trainee was left holding a certificate and a queue position.
Carnegie Mellon Africa, and the top of the pyramid
The third is small and worth a paragraph because it is a different bet. Carnegie Mellon University established a graduate engineering campus in Kigali in 2011, with the government of Rwanda, teaching master’s degrees in information technology and in electrical and computer engineering; by 2019 it had taught more than 300 students from eighteen African countries (Carnegie Mellon University, 2019).
Its economics are the opposite of ALX’s: expensive per student, tiny in absolute numbers, and irrelevant to the ten-year-olds in this chapter’s opening sentence. What it produces is the thin layer of people who can run a national research programme, supervise the next generation of engineers, or negotiate a data-centre contract on the state’s behalf. If Chapter 1’s second world arrives, that layer determines whether a country rents its productivity on decent terms or bad ones, and Rwanda’s decision to buy it rather than build it over thirty years is a legible piece of industrial policy.
What the experiments say
Is the constraint inputs, pedagogy, or the system that delivers them?
Education is the most heavily randomized field in development economics, which is fortunate, because the aggregate data in this chapter cannot separate the three candidate constraints.
Pedagogy beats inputs, and the demonstration is a matching problem. Duflo, Dupas and Kremer (2011) randomly tracked pupils by initial attainment across 121 Kenyan primary schools. The theoretical prediction was ambiguous: tracking removes the high-achieving peers that weaker pupils benefit from, but it lets a teacher aim at one level instead of at a distribution. Pupils at every point of the initial distribution gained, including the weakest, because the teacher could finally teach to the class in front of her. The finding is not about tracking. It is that instruction aimed at the wrong level is most of what is wrong with the classroom, which is a statement about pedagogy and not about resources.
The scaled version of that insight is the field’s most successful pedagogy programme. Banerjee, Banerji, Berry, Duflo, Kannan, Mukerji, Shotland and Walton (2017) describe ten years and several rounds of trials taking Pratham’s “teaching at the right level” method, which groups children by what they can actually do rather than by grade, from proof of concept to a government-run programme. The paper is unusual in being mostly about the failures on the way, and its lesson is that the version that works inside a non-governmental organization is not the version that works inside a ministry. The African replications are substantial: Zambia’s Catch Up programme, evaluated by randomized trial, raised literacy by 0.10 standard deviations and numeracy by 0.15 over two years (de Barros and Lubozha, 2026). The approach has reached more than seven million African children (Shulman, 2026). Botswana is one of the countries, and there, by its implementer’s account, the ministry has taken the method to national coverage in government primary schools (Angrist et al., 2026).
The technology comparison shows how large the pedagogy prize is. Muralidharan, Singh and Ganimian (2019) evaluated a personalized computer-aided instruction programme in urban India by lottery. Winners scored about 0.37 standard deviations higher in mathematics and 0.23 in Hindi after four and a half months, with the largest relative gains for the weakest pupils. The mechanism is the one Duflo, Dupas and Kremer identified: the software’s contribution is that it meets each child at her level. It is a comparison case rather than an African result, and it is here to size the prize available from teaching the right thing to the right child.
And then the system swallows it. Bold, Kimenyi, Mwabu, Ng’ang’a and Sandefur (2018) embedded a randomized trial inside a nationwide Kenyan reform of teacher hiring. New teachers offered a fixed-term contract by an international non-governmental organization raised test scores significantly. Teachers offered contracts on identical written terms by the Kenyan government produced no effect at all. The difference lay in implementation and interpretation: the contract features that generated the gains were not the ones the government adopted outside the experimental sample, and organized opposition shaped how identical clauses were applied. This is the most important result in the chapter. A proven intervention is not a policy, the delivering institution is part of the treatment, and the external-validity failure runs from non-governmental to governmental delivery, which is the direction every scale-up must travel.
Two results from elsewhere in the book close the loop. Hardy and McCasland (2023), in Chapter 6, showed that small Ghanaian firms offered a free apprentice grew, which makes the missing employment partly a matching problem rather than a skills problem. Blattman and Dercon (2018), in Chapter 29, showed that the industrial job the recipe promises was not, for the Ethiopian workers randomly offered one, obviously better than their alternatives. Neither is an education result; both constrain what education reform can deliver at the other end.
The literature supports something narrower than what it is used to support. Evans and Mendez Acosta (2021) review 145 empirical studies of African education published from 2014 onwards and find the evidence strongest on access and structured pedagogy and thinnest on exactly the systems questions a minister has to answer. The field knows how to teach a child to read and does not know how to make a ministry do it at national scale. The constraint is neither inputs nor pedagogy. It is the system that delivers them.
Human capital in two worlds
Chapter 1 set out the assumption underneath the identity, that the marginal worker still matters, and asked what each of the book’s subjects becomes if it fails. Nowhere is the question sharper than here, because education is the longest-dated investment a state makes. A child entering primary school in 2026 leaves the labour force around 2085, so every argument in this chapter is a claim about a world that will not exist for most of her working life.
In the labour-abundant world
In the world the book has been proceeding in, the case for schooling is the one the returns literature makes and this chapter has qualified: education raises output per worker, and the fact that the price of skill is not currently being bid up is a statement about the demand side today, not about the value of the investment over a generation. The programme follows. Fix the classroom hour before adding a classroom. Teach at the level of the child in front of the teacher. Solve the certification problem so that skill acquired inside a firm is portable. And be honest that none of it creates a vacancy, so that education policy is judged on learning, which it can deliver, rather than on employment, which it cannot.
In the labour-redundant world
Now suppose the frontier of production becomes a stock of machines that reason and machines that move, so that labour enters as a complement at best (Acemoglu and Restrepo, 2019). Three things change, and they do not all point the same way.
The first is that the content of human capital changes from competing with the machine to using it. The premium then attaches not to knowing what a model knows, which is worth nothing, but to directing one, checking it and taking responsibility for what it produces. That is closer to a management skill than a technical one, and it is not obviously what a system organized around a terminal examination in memorized content is good at producing. It also raises the value of the thin top layer that the Kigali campus supplies, relative to the mass expansions above.
The second is that the technology may do some of the teaching. The African evidence is a pilot rather than a programme and must be read as such: a six-week after-school intervention in Edo State, Nigeria, in mid-2024 gave about 800 senior secondary students a large language model as an English tutor under teacher supervision, and reported about 0.31 standard deviations on a composite assessment and about 0.23 on English, at a cost on the order of $48 per student, which the evaluators placed among the most cost-effective interventions on record (World Bank, 2025b). Hold it at arm’s length: one small trial, six weeks, after school, supervised, with the largest gains among students already doing well, and no evidence yet on durability. What it establishes is that the cost structure of remediation may be about to change, in a region whose binding constraint is teachers it cannot hire.
The third is the uncomfortable one. If the frontier stops needing workers, a continent whose distinguishing asset is 1.5 billion people becoming 2.5 billion is holding the asset the century has stopped paying for. Mass schooling is then not a growth strategy. It is either a citizenship investment, which is a perfectly good reason to do it and not the reason this book has been giving, or the production of qualified people for whom there is no work, which is Figure 20.3’s Southern African configuration generalized to a continent. Chapter 10’s distributional question arrives here in its education form: what an education is for when it no longer buys a claim on the product.
The chapter’s own answer is that the case for teaching a ten-year-old to read does not depend on which world arrives, and almost every other argument here does. That asymmetry is a reason to put foundational learning first even on the book’s own uncertainty about the century.
Connections to Other Chapters
- Chapter 2 (The Demographic Century) hands this chapter the cohorts arriving in classrooms and the child-survival transition it treats as a human-capital input.
- Chapter 6 (The Informal Economy) owns the apprenticeship as an employment institution, which this chapter reads as a training system, and Chapter 9 (The Recipe) supplies the sequencing argument the demand-side finding qualifies.
- Chapter 10 (Labor, Youth, and Migration) owns the youth measure reused here, the migration proportions, and the question of what employment is for.
- Chapter 15 (Manufacturing and the Auto Industry) and Chapter 17 (Digital) carry the sectors that make the strongest skill claims, and the offshoring employment most exposed if the second world arrives.
- Chapter 21 (Capital and Sovereign Debt) records the diaspora on the balance sheet, and Chapter 23 (Inequality, Social Protection, and Health) owns the health system whose outputs are inputs here.
- Chapters 25, 28 and 29 (Gauteng; Casablanca to Tangier; Addis Ababa to Djibouti) apply the diagnostic test this chapter’s puzzle comes from, and Chapter 35 (Scenarios) carries the labour-redundant world in which the last section’s arithmetic bites.
Discussion Questions
The private return to a year of schooling is about 13 percent in Sub-Saharan Africa, the highest of any region, and the growth-pole chapters conclude that the price of skill is not being bid up (Montenegro and Patrinos, 2023). These two statements are compatible. Explain how, using the distinction between the level of a return and its trend, and then say what evidence would have to appear over the next decade for the pole chapters to be wrong.
Bold, Kimenyi, Mwabu, Ng’ang’a and Sandefur (2018) found that identical contract terms produced significant learning gains when a non-governmental organization administered them and none when the Kenyan government did. A minister reads this and concludes that the state should contract delivery out. A union leader reads it and concludes that the experiment measured the effects of insecure employment. Make the strongest case for each reading, then say which one the NewGlobe programmes are a test of, and what observation would settle it.
This chapter argues that a meaningful share of the learning deficit measured at age ten was determined before the child reached a classroom. Suppose you hold a fixed budget and must allocate it between early-childhood nutrition and a structured-pedagogy programme in primary schools. Set out what you would need to know to choose, say which of those things this chapter’s evidence base actually supplies, and explain why a ministry of education might make the wrong choice for entirely rational institutional reasons.
Try It
Open the three cards side by side: South Africa, Kenya and Niger, in that order. They sit at three points of Figure 20.3: the highest wage-employment share on the continent at 82.7 percent with a youth measure of 34.6, ten points above the median of 24.4; a middling wage share of 35.1 with a youth measure of 18.5; and almost no wage sector at all, 10.3 percent, with a youth measure of 15.7. Read down the overlays.wage_employment_share and overlays.youth_neet rows first, then the three identity terms, then the data-quality block. Write one paragraph on a single question: which of the three countries has a human-capital problem, and how much of your answer is a claim about schools rather than about the number of jobs a school leaver can apply for?
Data Exercise
Download all fifty-four cards from the country cards page on this site, as cards.csv if you work in a spreadsheet and cards.json if you want the release each number came from travelling beside it. Build a table with six columns: overlays.youth_neet, overlays.wage_employment_share, overlays.nonag_employment_share, identity.output_per_worker_growth, scale.gdp_per_capita and data_quality.confidence_flag. Then answer four questions. First, reproduce the correlation between the youth measure and the wage-employment share reported in this chapter, and say how much of it survives dropping the five Southern African countries with the highest wage shares. Second, compute the same correlation using overlays.nonag_employment_share in place of the wage share, and explain why the two differ. Third, restrict to the countries carrying a high confidence flag and recompute both, then say in two sentences whether the chapter’s demand-side reading survives on the best-measured third of the continent. Fourth, and this one has no clean answer, propose a card field that would let a reader test the skill-premium claim directly, and say what survey would have to exist for it to be filled. Note which fields are null rather than zero, and never impute a null as a zero.
Data Sources and Further Reading
Key data sources
- World Bank Human Capital Index, 2020 round: the index in Figures 20.1 and 20.2, and the expected and learning-adjusted years of schooling. Assembled here country by country for nineteen African economies rather than taken as a regional aggregate, with a source on every value.
- World Bank and partners, The State of Global Learning Poverty: 2022 Update: the learning-poverty measure and the regional and global rates.
- UNESCO Institute for Statistics and the Global Education Monitoring Report: tertiary enrolment, institution counts, out-of-school numbers, the language-of-instruction evidence and the teacher-requirement projections.
- Service Delivery Indicators surveys (Bold, Filmer and others, 2017): teacher absence, time on task and subject knowledge across seven Sub-Saharan countries.
- ILOSTAT modelled estimates (November 2025) and UN World Population Prospects 2024: the youth, wage-employment and identity series on the country cards, and the population arithmetic. The cards carry no education or health field, which is why every schooling and health number here is cited to a source outside them.
- UNICEF, WHO and World Bank Joint Child Malnutrition Estimates for stunting, and NHS and Nursing and Midwifery Council workforce statistics, as analysed by British health-policy institutes, for the health-worker migration figures.
Further reading
- Tessa Bold and co-authors, “Enrollment without Learning” (2017), the best short description of what is actually happening in African classrooms, and the same lead author’s “Experimental Evidence on Scaling Up Education Reforms in Kenya” (2018), for the systems finding this chapter treats as decisive.
- David Evans and Amina Mendez Acosta, “Education in Africa: What Are We Learning?” (2021), for the state of the African evidence base, and Abhijit Banerjee and co-authors (2017) for what taking a proven method to scale actually involves.
- Deon Filmer and Louise Fox, Youth Employment in Sub-Saharan Africa (2014), still the clearest statement that the youth problem is one of earnings rather than joblessness, and David Evans, Fei Yuan and Deon Filmer, “Teacher Pay in Africa” (2022), for the comparison that dissolves the strike-versus-salary argument.
- The New Regional Economics, chapter 14 (Wilse-Samson, 2026), for the professional-mobility material this chapter cites rather than repeats.