26. Nairobi–Mombasa and the East African Community
Pole type: demographic engine and productivity platform.
Four countries strung along two corridors that begin at the Indian Ocean hold 189.3 million people between them, 12.5 percent of Africa, and produce $305.8 billion, 9.7 percent of its output; by 2050 they will hold 321.4 million and by 2100 520.6 million. Almost everything they buy from the rest of the world comes ashore at two ports, and almost everything the interior sells leaves through the same two gates.
Learning Objectives
After reading this chapter, you should be able to:
- Read the identity for Kenya, Tanzania, Uganda and Rwanda, say which term carries growth in each, and explain why the pole with the best-reformed corridor has one of the continent’s worst employment records.
- Set out the pole’s balance sheet, and explain how a railway financed on commercial terms became the largest single claim on one government’s revenue.
- Defend, or attack, the claim that the binding constraint here is not infrastructure but the price private firms pay for credit in a market their own government has taken over.
- Describe the four settlements in the vocabulary of Chapter 5, and say why two elections and one protest wave between June 2024 and January 2026 pose one question in three registers.
- Explain why a services-and-payments pole is where the labour-redundant world of Chapter 1 would arrive first in Africa, and what that does to the phrase “Silicon Savannah”.
Prior work: the four-corridor table, the Northern Corridor reform sequence, the Nairobi-versus-Lagos agglomeration comparison and the hegemon-and-hinterland framing used here are set out at length in the companion volume, The New Regional Economics, chapters 13 and 14 (Wilse-Samson, 2026). This chapter cites them rather than repeating them, and adds what the volume does not have: the identity, the balance sheet and the diagnostic.
This is the pole where the continent’s regional-integration argument has already been tried. The East African Community is the most integrated of Africa’s regional communities: a customs union with a single customs territory, a common market on paper, one-stop border posts that work, and a corridor from Mombasa inland whose transit times fell by roughly two thirds between 2010 and 2023 while volumes rose (Wilse-Samson, 2026). If regional integration is the missing machinery of African growth, the machinery is installed here, and this chapter asks what it produced.
The answer is uncomfortable. It produced a real productivity record, a payments system copied on four continents, the deepest banking sector between Lagos and Johannesburg, and no jobs. Kenya, the core of the pole, posted output-per-worker growth of 2.84 percent a year over the decade to 2024 and an employment ratio that fell by 1.17 percent a year, the fourth steepest decline of the 53 cards carrying the series. The corridor works; the labour market does not.
The pole is the Nairobi city-region and its outlet at Mombasa, the interior markets of Uganda and Rwanda that the Northern Corridor serves, and Tanzania, both a member of the same community and the operator of the competing route. Tanzania has its own subsection in Section 5 because it is not a spoke: it is a second hub, a country whose population will nearly double by 2050, and one of the two economies in which this book’s central productivity puzzle was first measured (Diao, Ellis, McMillan and Rodrik, 2021).
1. The pole in the identity
Chapter 1 set out the identity: output equals output per worker, times the employment-to-working-age ratio, times the working-age population, so that in growth rates GDP growth is approximately the sum of the three. Every figure in Table 26.1 is an annual growth rate over 2014 to 2024 except the last three columns, which are shares and a flag.
| Country | Term one: working-age population | Term two: employment ratio | Term three: output per worker | Implied growth | Observed growth | Gap | Wage employment (percent of employment) | Non-agricultural employment (percent) | Confidence |
|---|---|---|---|---|---|---|---|---|---|
| Kenya | 2.94 | -1.17 | 2.84 | 4.61 | 4.62 | -0.02 | 35.1 | 53.5 | high |
| Tanzania | 3.55 | 0.03 | 1.92 | 5.50 | 5.83 | -0.33 | 14.5 | 34.9 | medium |
| Uganda | 4.17 | 0.33 | 0.22 | 4.71 | 4.93 | -0.22 | 19.3 | 34.6 | medium |
| Rwanda | 2.83 | 0.65 | 3.26 | 6.74 | 6.72 | 0.02 | 59.1 | 63.5 | high |
Term one is the working-age population aged 15 to 64; term two is modelled employment aged 15 and over divided by that population; term three is the residual output-per-worker series; the gap is implied less observed growth. Sources: UN World Population Prospects 2024, ILOSTAT modelled estimates (November 2025) and the IMF World Economic Outlook (April 2026), via the country cards.
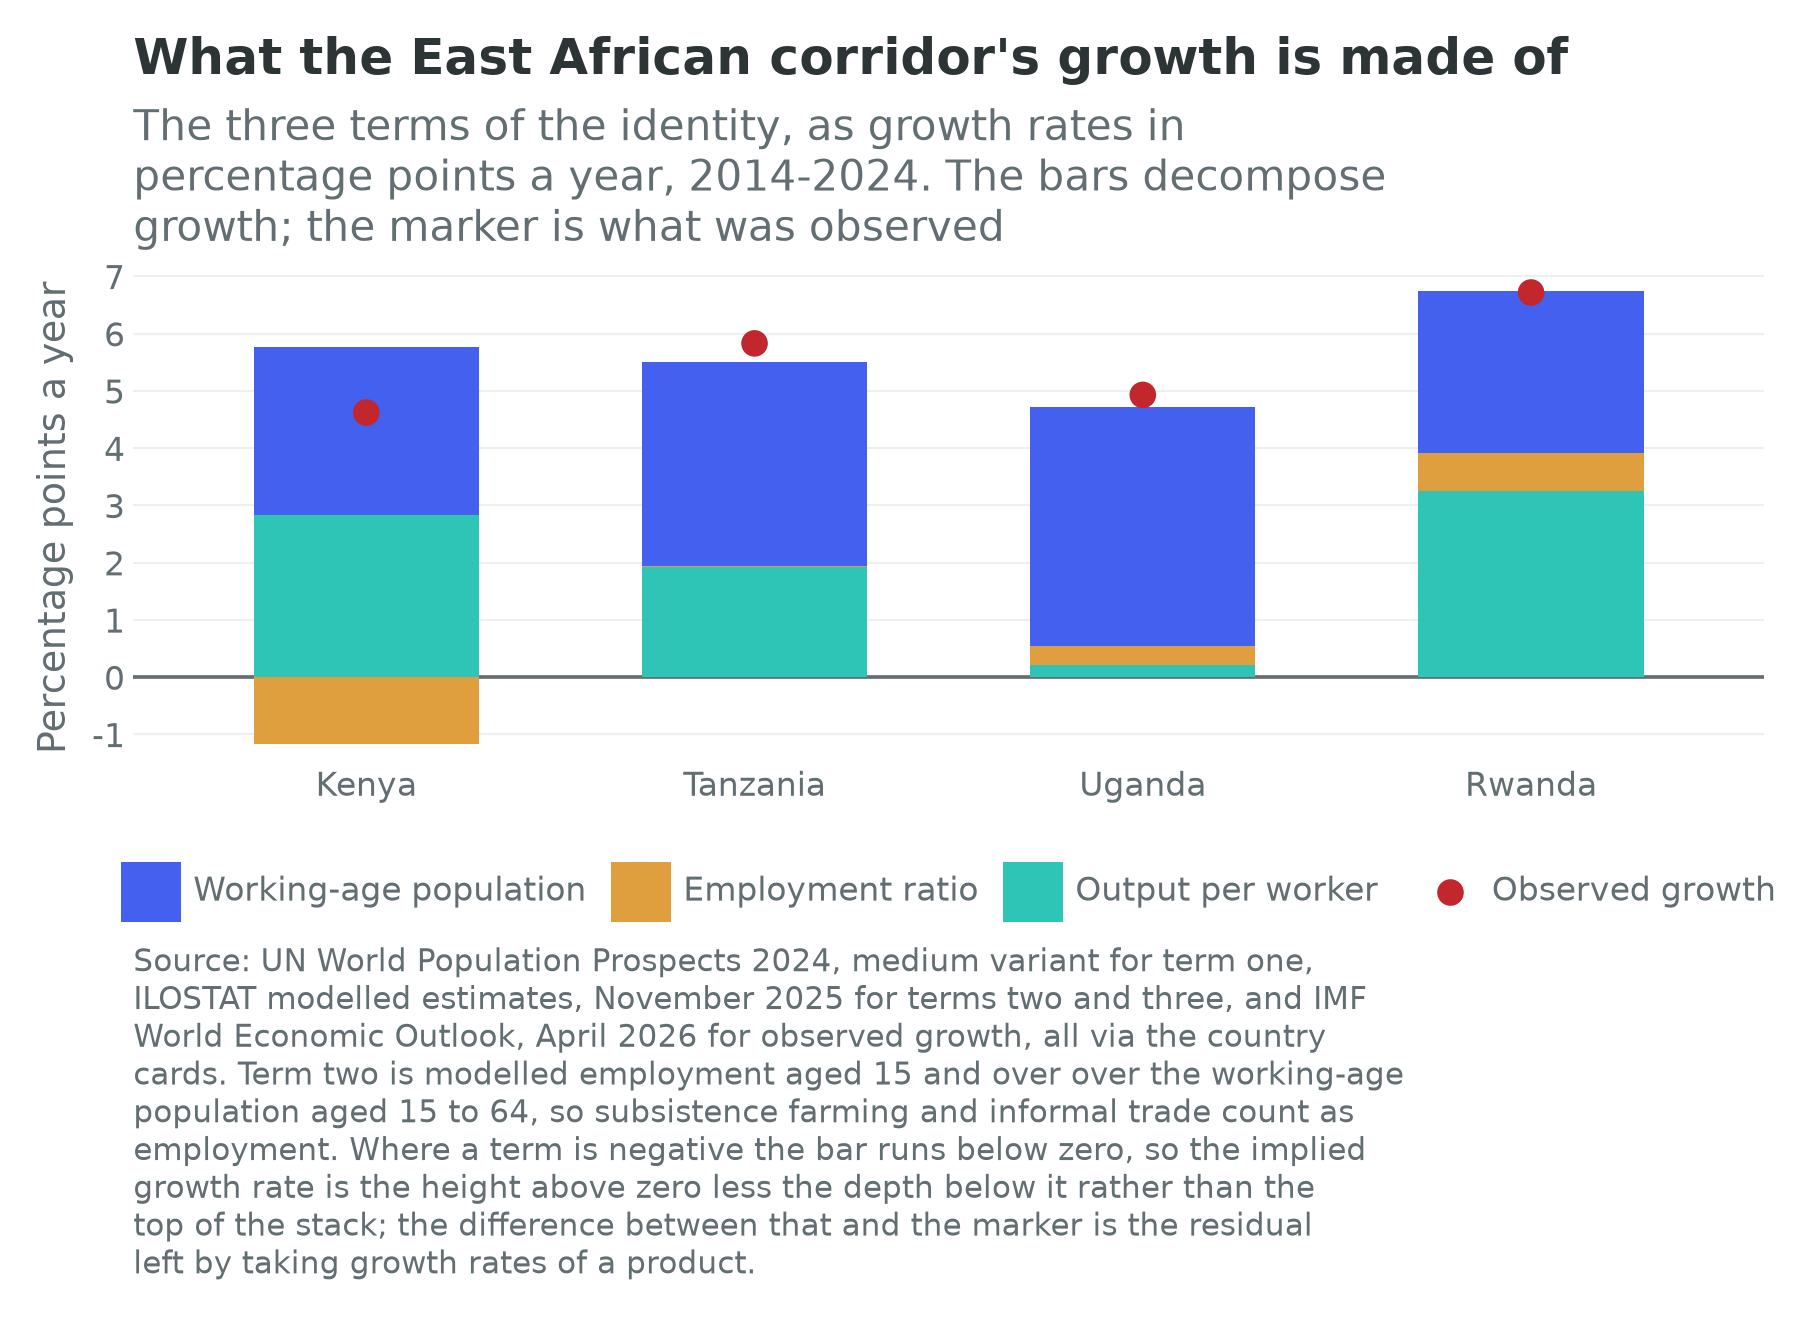
Four countries, four answers to the question of which term is doing the work.
Uganda is the pure demographic case. Its working-age population grew at 4.17 percent a year, the fastest of all 54 cards, and its output per worker at 0.22 percent, so nine tenths of Ugandan growth was more Ugandans. The five-year forecast of 7.12 percent, fourth highest on the cards, is oil coming on stream rather than a change in the machinery.
Rwanda is the reallocation case. Observed growth of 6.72 percent a year is the second highest of the 54, behind only Ethiopia, and output per worker grew at 3.26 percent, the fifth highest. It is the only country here whose employment ratio rose meaningfully, at 0.65 percent, and its wage-employment share of 59.1 percent is fifteenth of the 53 cards carrying that overlay. Rwanda is doing what the recipe says; Section 4 asks what it is paying.
Tanzania is the scale case. Working-age population at 3.55 percent, output per worker at 1.92, the pole’s lowest wage-employment share at 14.5 percent, and 68.6 million people who become 129.6 million by 2050 and 262.8 million by 2100: this is the country whose arithmetic the rest of East Africa will be organized around.
Kenya is the case the chapter is about. Its term three is the strongest here after Rwanda’s and its term two the weakest by a distance, at minus 1.17 percent a year against a continental median of minus 0.15: through a decade in which its working-age population grew by nearly 3 percent a year, the share in any measured work fell every year. It is also the pole’s rich country, at $2,558 of output a head against $1,128 in Rwanda.
The overlays stop the middle column being read as either a compliment or a complaint. Kenya’s wage-employment share of 35.1 percent is the highest here outside Rwanda, and its informal employment share is 86.5 percent, against 90.8 in Tanzania and 94.5 in Uganda, because the modelled series counts a boda-boda rider and a bank teller identically. Youth not in employment, education or training runs at 18.5 percent in Kenya and 25.9 percent in Rwanda: a country can post the continent’s second-fastest growth and leave a quarter of its young people outside everything. Implied and observed growth differ by at most a third of a point, so the decomposition holds; what it decomposes is a set of modelled series, which is Section 10’s subject.
Within and between: the one pole that can be drawn whole
Term three splits, following Chapters 6, 9 and 10, into the part from firms inside a sector getting better and the part from workers moving between sectors. The transformation database covers 21 cards, and this is the only pole in Part VI where it covers every country.
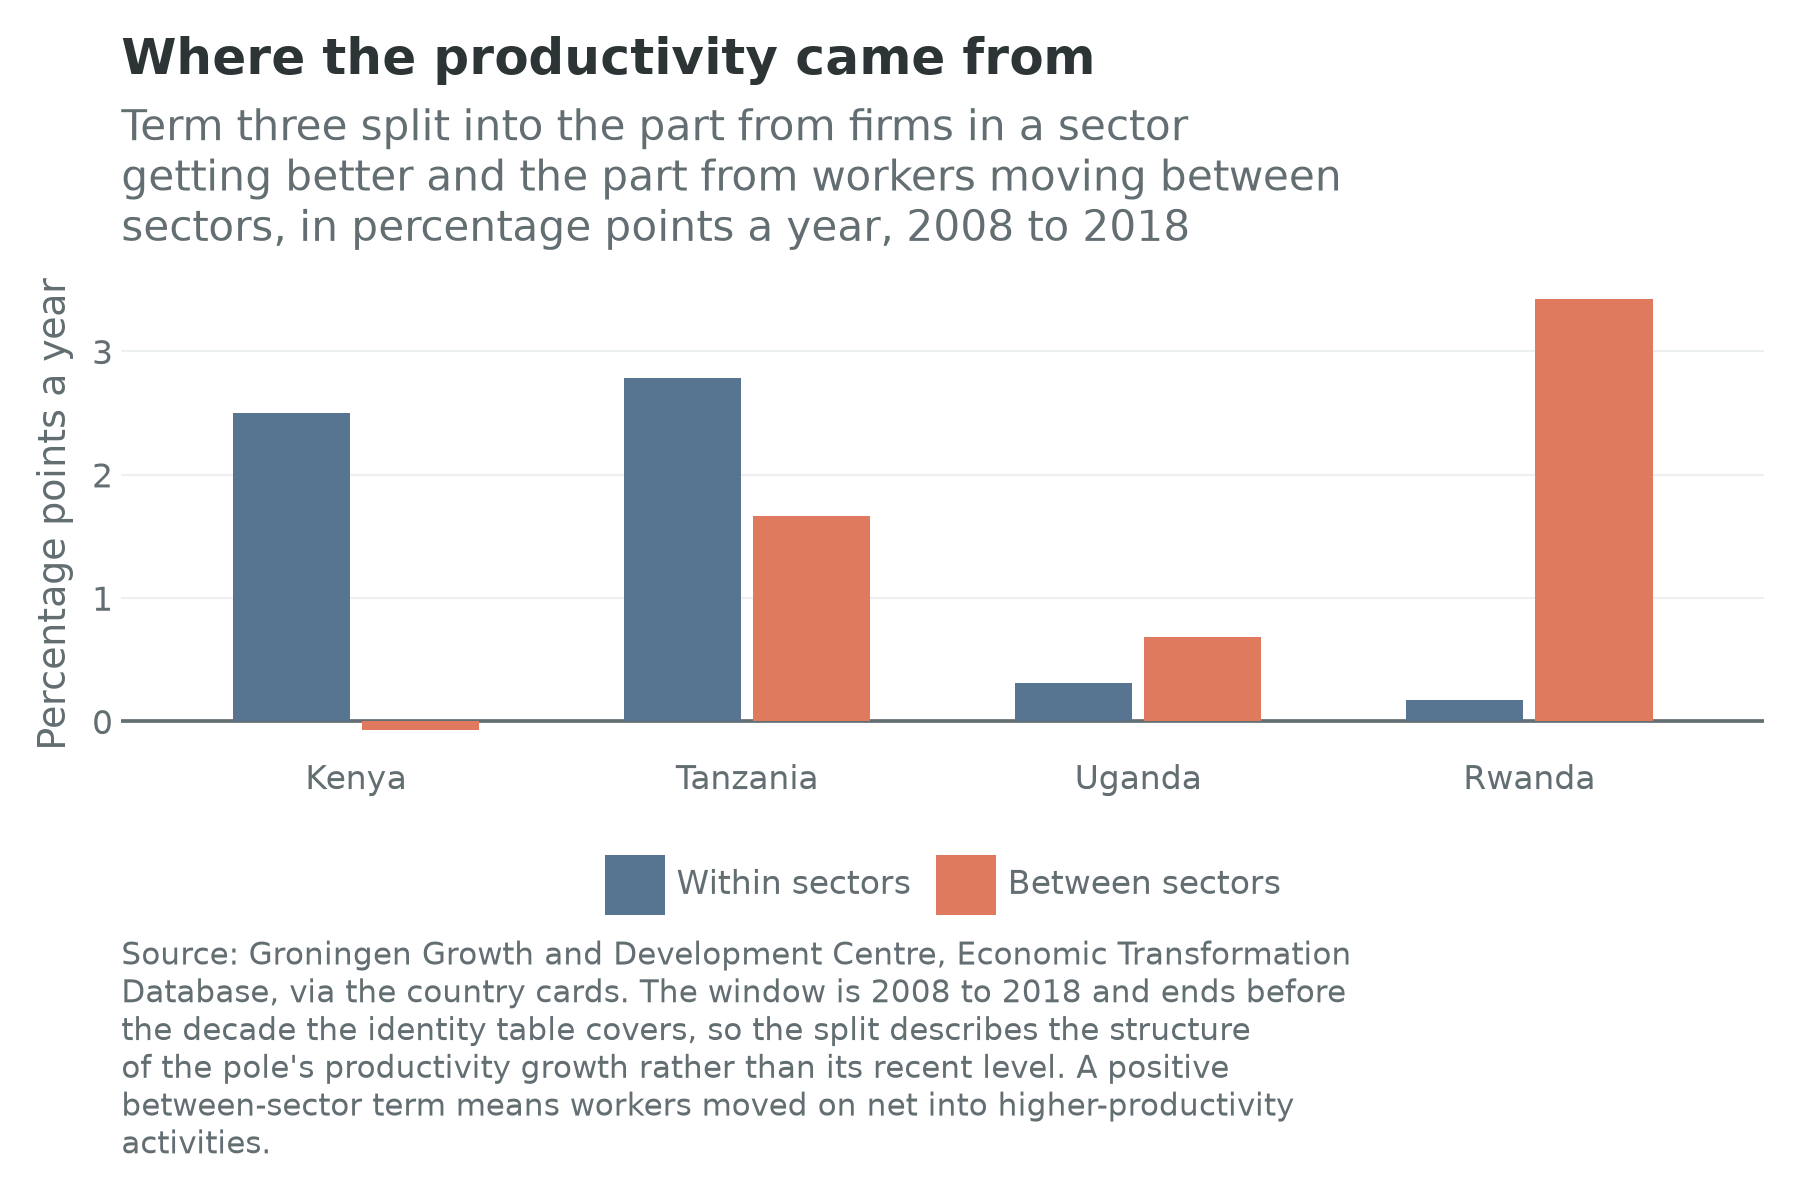
The pole splits into two pairs. Kenya records 2.50 percent a year within sectors against minus 0.07 between them, so effectively all of its productivity growth came from firms improving and none from workers moving. Rwanda is the mirror image, at 0.17 within and 3.43 between: firms barely improved, and almost the whole of a very strong record came from people leaving agriculture. Tanzania alone does both at once, at 2.79 and 1.67, the pattern structural-transformation theory predicts and almost nobody on this continent posts. Uganda does neither, at 0.31 and 0.69.
Two carry warning labels. Rwanda’s number is what the companion volume calls premature servicification: a poor agricultural economy moving labour into urban services more productive than subsistence farming and less productive than anything a manufacturing economy would recognize (Wilse-Samson, 2026). It measures the height of the step out of agriculture, not the height of the ladder above it. Kenya’s near-zero reallocation term is the arithmetic behind its falling employment ratio: firms got better without taking on the people leaving the land, the dual structure Diao, Ellis, McMillan and Rodrik (2021) measured in Tanzanian and Ethiopian firms. The window closes in 2018, so the split describes the decade before the pandemic, the drought and the debt squeeze.
The services pole in two worlds
Chapter 1 stated the assumption underneath the identity and named the place where it fails first. In the labour-abundant world this pole is the strongest case in Africa: the deepest mobile-payments system on the continent, an English-speaking graduate labour force, cheap undersea bandwidth, geothermal power that runs at night, and a business-process industry built on all of it. Kenyan startups raised $984 million in 2025, close to a third of everything raised on the continent, and in the third quarter Nairobi alone took 54.2 percent of African startup funding, the most concentrated quarter in the record.
In the labour-redundant world the same description is the problem. Chapter 1 put it bluntly: the model in which a graduate in Nairobi answers a call or labels an image for a firm on another continent is the first casualty of a machine that answers calls and labels images. Every advantage listed above sits in tasks near the front of the queue for automation, so the pole’s endowment is the one whose price is falling fastest, the opposite of a copper corridor or a solar belt. The defence, which this book takes seriously, is that a payments system is not a call centre: M-Pesa moves money between people who have no bank, and its value sits in an agent network, a regulatory settlement and eighteen years of trust. The distinction the pole has to make, and has not made, is between the rented tasks in its services economy and the owned infrastructure.
2. The pole on the balance sheet
| Country | External debt stock (\(bn) | Multilateral (\)bn) | Official bilateral (\(bn) | Private creditors (\)bn) | of which bonds (\(bn) | Chinese loan commitments, 2000 to 2024 (\)bn) | |||
|---|---|---|---|---|---|---|
| Kenya | 42.9 | 20.0 | 8.1 | 7.5 | 6.6 | 10.0 |
| Tanzania | 36.3 | 16.4 | 3.6 | 4.3 | none recorded | 2.4 |
| Uganda | 20.5 | 8.7 | 3.7 | 1.8 | 0.9 | 4.2 |
| Rwanda | 13.1 | 5.6 | 1.1 | 1.7 | 0.6 | 0.7 |
Sources: World Bank International Debt Statistics (2025 release) for the stock and creditor lines; the Boston University Chinese Loans to Africa database (2000 to 2024 release) for the commitment column, a cumulative flow and not a stock. The creditor columns are publicly guaranteed long-term debt, the bond column sits inside the private-creditor column, and they do not add to the stock, which also carries short-term debt, IMF credit and private non-guaranteed borrowing.
Three readings follow. The first is that this is a multilateral pole, not a bonded one. The four owe $50.7 billion to multilateral institutions against $8.1 billion on bonds, and Tanzania, the second-largest economy here, has never sold one. Set that beside the West African coast of Chapter 24, where bonds dominate: it is why nobody here has defaulted, and why the adjustment, when it came, was slower and more political than Ghana’s.
The second is the Chinese line, and this pole is the clearest illustration of the counting problem. The loan database records $17.3 billion of cumulative commitments to the four governments, $10.0 billion of it to Kenya, and the debt statistics record $9.7 billion still outstanding to creditors in China across the four, $5.4 billion of it Kenya’s. Commitments are not disbursements and disbursements are not stocks, so a gap of that size is arithmetic rather than concealment, and it is the observation Chapter 32 is built on and the one the debt tracker draws explicitly.
The outstanding balances rearrange the pole. Kenya and Uganda owe China more than they owe the twenty-two members of the Paris Club, $5.4 billion against $3.3 billion and $2.6 billion against $1.2 billion, while Tanzania and Rwanda owe the Club more, $4.3 billion against $1.4 billion and $0.7 billion against $0.4 billion. That is the corridor’s financing model showing up in its creditor list: the two countries that built a standard-gauge railway on Chinese credit owe China more than the old official world, and the two that did not, do not. None of the three lines may be added to the bilateral column beside them, for the reason Chapter 21 gives.
The third is what the money bought. Kenya’s standard-gauge railway from Mombasa to Nairobi, 472 kilometres, and its extension to Naivasha, another 120 kilometres, were financed principally by two buyer’s credits from the Chinese policy bank, of $1.903 billion and $1.39 billion, inside a build cost above 600 billion Kenyan shillings, KSh. The terms that mattered were commercial rather than concessional, and the freight volumes written into the traffic assumptions did not arrive. Kenya owed the lender $741 million of principal, $222 million of interest and $41 million of penalties in 2025/26 alone, has been paying more than $1 billion a year on the railway, and extended three of the loans to 2040 to make the profile survivable.
Set that against the sovereign’s aggregate position and Section 3 writes itself. Kenya’s external debt stock is 31.4 percent of output, which is unremarkable; the domestic side is not. Interest payments alone were budgeted at KSh 1.09 trillion in 2025/26, 42.7 percent of ordinary revenue, and in the nine months to March 2026 debt service took KSh 1.35 trillion of KSh 3.21 trillion of receipts. A government paying two of every five shillings it collects to creditors before it has taught a child is not a government that can also crowd in private investment. In February 2024, with the shilling at a record KSh 163.98 to the dollar and a $2 billion debut Eurobond maturing in June, the Treasury sold a new $1.5 billion bond priced to yield 10.375 percent and bought back most of the old one. The default the market was pricing did not happen; the operation was also expensive, and it set the pattern followed since, including a further $500 million repurchase and a stated intention to spend up to $1 billion retiring the 2027, 2028 and 2031 maturities early.
Rwanda is the opposite kind of story. Its external stock of $13.1 billion is 81.7 percent of output, the pole’s highest ratio by a wide margin, and is owed overwhelmingly to multilateral institutions on concessional terms. Borrowing at length from development banks to finance a strategy is a different act from borrowing at ten percent from bondholders to refinance a railway, even where the ratios look alike.
3. The binding constraint
The growth-diagnostics method of Hausmann, Rodrik and Velasco (2005) asks one disciplined question: of all the things wrong with an economy, which one, fixed first, would raise private investment most? It tests each branch by its shadow price rather than by whether the thing is bad. Figure 26.3 draws the tree for this pole, and it is the first in Part VI to come down on the finance branch.
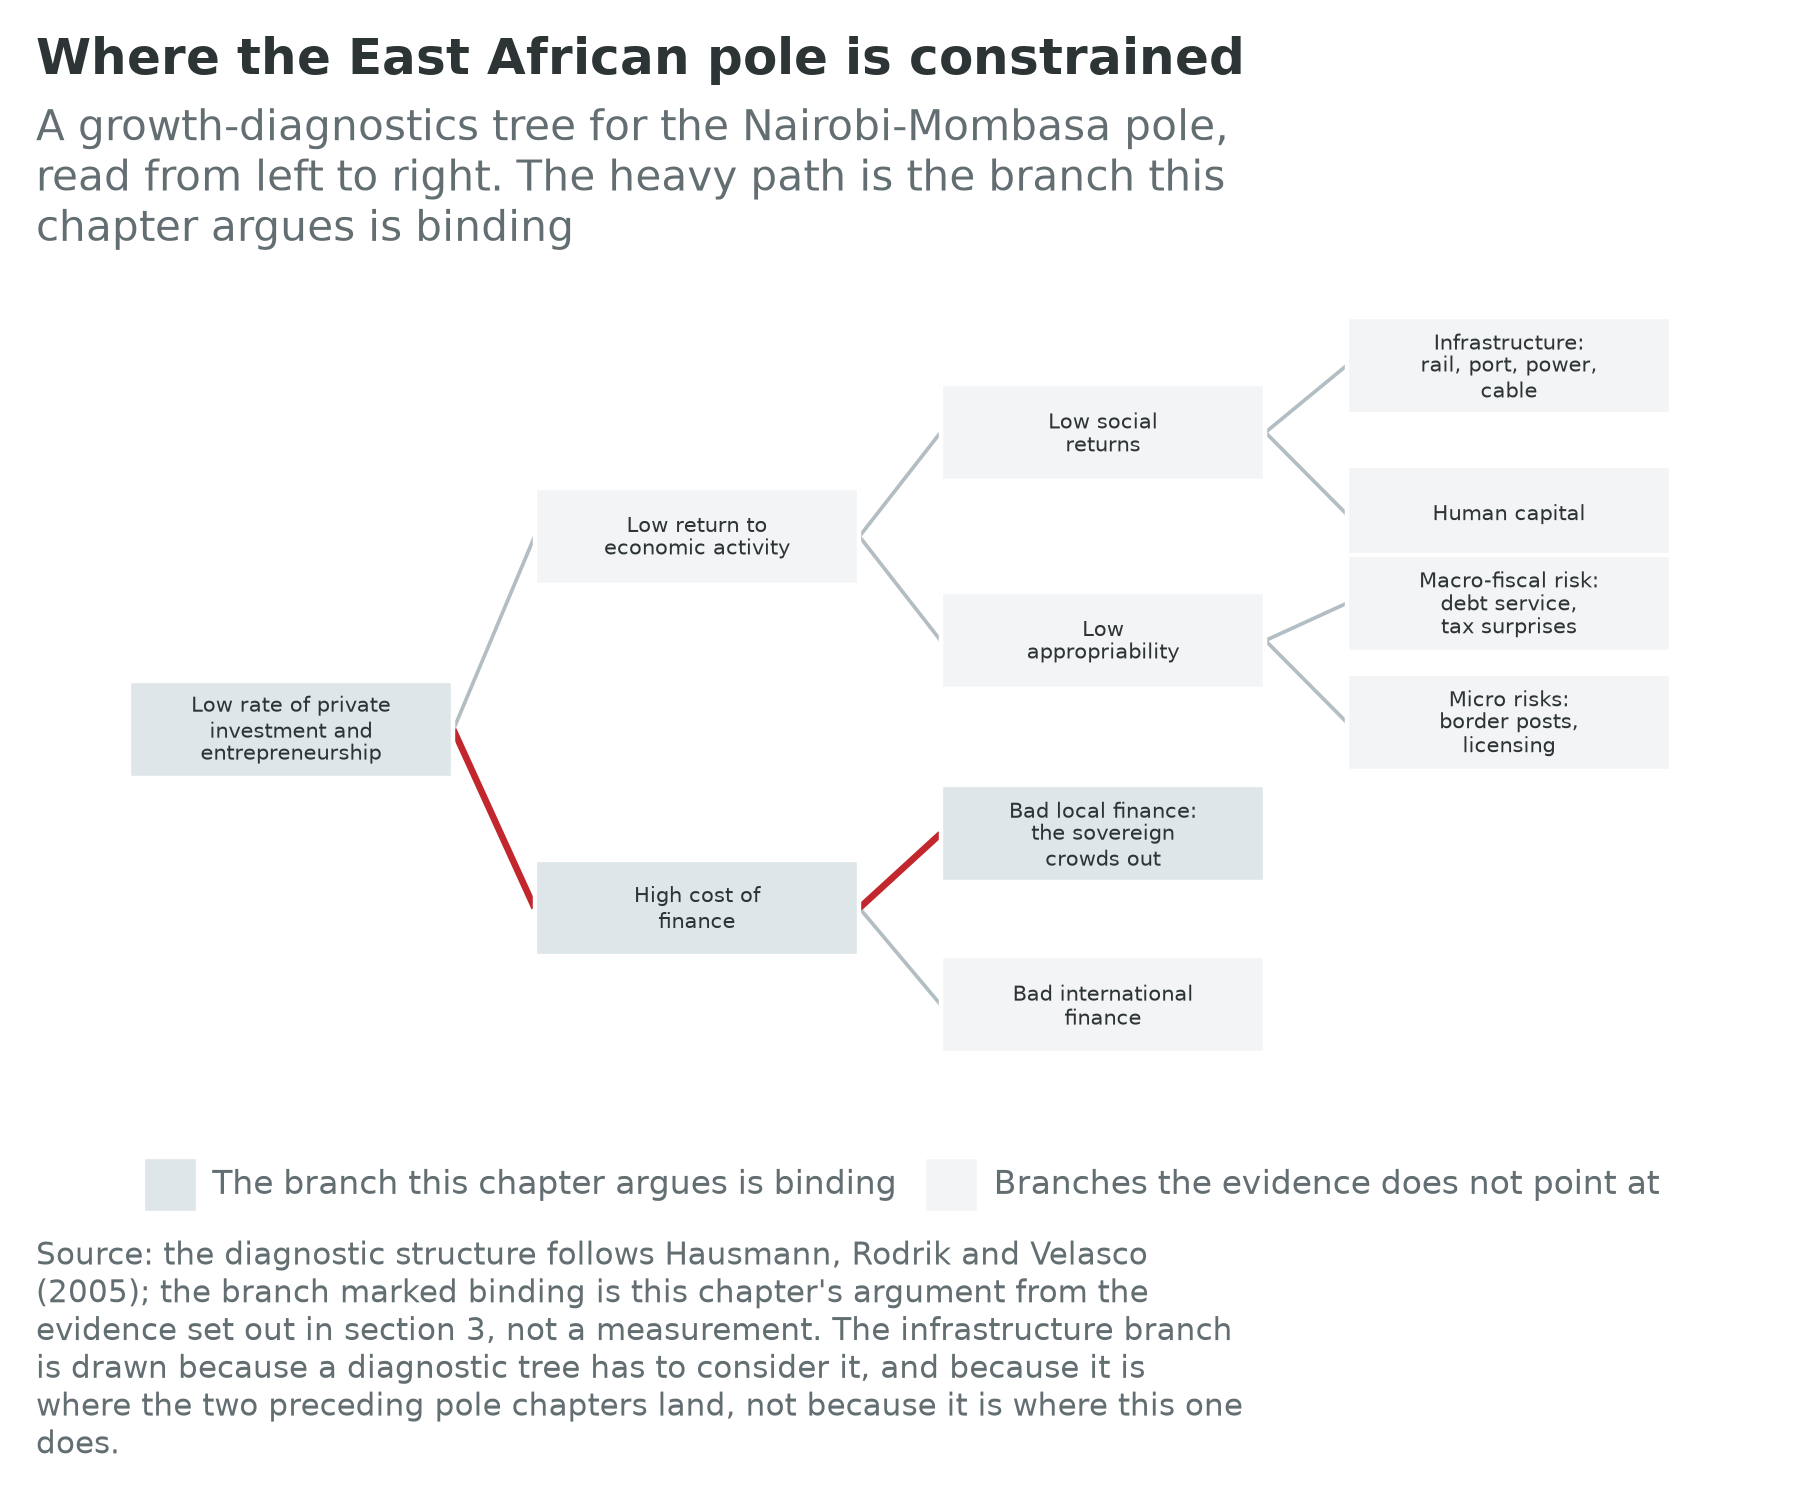
Start by eliminating infrastructure, because that is where the two preceding pole chapters landed and a diagnostic that always finds the same answer has stopped diagnosing. This pole built: a railway from the sea to the Rift Valley, a tolled expressway across its capital, a container port setting throughput records, landed submarine cables, and geothermal baseload that does not depend on rain, while the reform sequence the companion volume documents cut border crossing at Malaba from days to hours (Wilse-Samson, 2026). Firms in Nairobi complain about power and roads, but they do not, on the whole, pay above the regulated price to supply themselves the way South African firms did during the blackouts, which is the observable form a binding infrastructure constraint takes.
Eliminate human capital, with the hesitation Chapter 24 showed. Kenya has the region’s best-educated labour force, and the test is whether returns to skill are being bid up. The pattern runs the other way: youth not in employment, education or training at 18.5 percent in Kenya and 25.9 percent in Rwanda sits beside a wage-employment share that has not risen. Graduates are not scarce here. Positions are.
What is left is the price and availability of capital to private firms, and the reason is not that the region lacks savings or banks. It is that the sovereign has taken over the market for both. The shadow-price test for crowding-out is a comparison of who gets the credit, and the comparison is stark. Private-sector credit shrank by 1.4 percent in the twelve months to December 2024 (People Daily, 2025); banks held 44 to 46 percent of the government’s domestic securities in March 2025 (Wandera, 2025); and in 2025 Kenyan banks increased their holdings of government securities by 18.2 percent while their loans to customers grew by 6.6 percent (Kajilwa, 2026). A banking system with that portfolio is not failing to lend. It is lending, at a good risk-adjusted return, to the one borrower who always pays, and that borrower is spending 42.7 percent of ordinary revenue on interest.
The mechanism runs through Section 2. The pole borrowed to build infrastructure on terms it could not service out of the traffic that infrastructure carried, and the resulting debt service now absorbs the domestic savings that would otherwise have financed the firms that would have used it. The railway is not the constraint; the railway’s financing is. That is a more uncomfortable finding than “Africa needs more infrastructure”, and it is why this book insists the balance sheet is a lens rather than an appendix.
One branch is left unresolved, on the appropriability side. Kenya has attempted a substantial tax increase in each of three consecutive years, and one attempt brought the country to the edge in June 2024; a firm placing a five-year investment reads that as a probability distribution over future tax regimes rather than as a rate. Whether that is a separate constraint or the fiscal position in a different costume, this chapter cannot settle. The reading it does offer has a clean test: if crowding-out binds, a credible cut in the government’s domestic borrowing requirement should be followed by a rise in private investment in tradables, not merely by a fall in yields.
4. The political settlement
Chapter 5 supplies the vocabulary. Khan (2010) argues that institutions work only where they fit the underlying distribution of organizational power. Pritchett, Sen and Werker (2018) sort economies by whether deals are open or closed to newcomers and ordered or disordered in enforcement. Dercon (2022) asks whether the elite has bet on growth or on dividing what exists. Two of these four countries held a national election within four months of each other, in October 2025 and January 2026, and a third had its fiscal settlement broken on the street in 2024; the three put one question in three registers.
Kenya has the pole’s most open settlement and its most disordered deals. Power has changed hands at the ballot box twice this century, the courts annulled a presidential election in 2017 and were obeyed, and the press is the freest in the region. Entry is possible; enforcement is not reliable; the rules change with the fiscal year. The clearest recent test was fiscal. The 2024 finance bill sought roughly $2.7 billion of new revenue, largely to meet targets agreed with the Fund, and produced protests from 18 June to 8 August 2024 in which about 50 people were killed and which ended with the president declining to sign a bill his own party had passed. That is a settlement in which the urban young hold a veto they cannot convert into a programme, and a government that can neither tax nor stop borrowing. The external anchor frayed at the same moment: the 2021 programme with the Fund ended early in 2025 with about $850 million undrawn after the country failed 11 of 16 conditions, and talks on a new one were confirmed only in February 2026. Ghana’s anchor in Chapter 24 survived a change of government; Kenya’s was removed by the protests that made adjustment necessary. On Dercon’s test the case is unresolved: this elite has bet on infrastructure, which is not the same as betting on growth.
Tanzania ran the opposite experiment. The settlement is a dominant-party one of the classic kind, in office since independence, and the presidency that began in 2021 opened it slightly: reformist on the economy, welcoming to investors, less punitive toward the press. The election of 29 October 2025 closed it again and violently. The two largest opposition parties were barred before polling, the incumbent was declared elected with 97.66 percent of the vote, and the protests that followed produced a death toll ranging, across the sources willing to publish one, from dozens to several thousand; this book does not adjudicate the count. Tanzania is the pole’s most credible industrial bet, with the best combination in Figure 26.2, and it has just demonstrated that the bet comes with no widening of the settlement. Dercon’s finding, that a bargain to bet on growth is not a bargain to share power, applies here as squarely as to Benin.
Uganda is the succession case. The president has held office since 1986 and was declared elected to a seventh term on 15 January 2026, in a vote conducted under an internet and mobile-money shutdown, with at least seven people killed in the unrest that followed; in August 2026 his son, the chief of the defence forces, announced a run for 2031. A settlement whose central unresolved question is biological rather than political is one in which nobody makes a twenty-year investment decision, and Uganda is about to become an oil producer. Term one at 4.17 percent beside term three at 0.22 percent is what a country looks like while it waits.
Rwanda is the cleanest instance of Khan’s argument. Booth and Golooba-Mutebi (2012) called the arrangement developmental patrimonialism: a centralized ruling coalition with a long horizon, party-owned holding companies as its investment arm, and rents managed centrally for growth rather than distributed for loyalty. Table 26.1 is what that bought, and Chapter 9 sets it beside the recipe. The cost side has two entries. A settlement with no mechanism for a transfer of power carries all its risk at the succession. And the regional entry is why the community’s arithmetic no longer adds: Rwanda’s involvement in eastern Congo has brought sanctions, aid suspensions and a rupture with a fellow member state, and its neighbour to the south closed their common border in January 2024 and had not reopened it by 2026. A strategy premised on being the region’s logistics and services hub is difficult to run from behind a closed border.
The community itself is the fifth actor and in the worst condition of the five. Its finances measure how much its members want it: in 2024/25 partner states paid about 58 percent of what they owed, with Burundi at 19 percent, the Democratic Republic of the Congo at 14 percent and South Sudan at 7 percent, and arrears above $55 million; in 2025/26 compliance fell to 36.6 percent and arrears reached about $90 million. Meanwhile it grew from five members to eight, adding South Sudan, the Congo and Somalia, three states with the least capacity to implement its protocols and the least money to fund its secretariat. And the trade it exists to create remains thin: intra-community trade was $15.2 billion in 2024, 10.8 percent of the bloc’s total, and $19.3 billion in 2025, 12.3 percent. The reform is real, the trade is growing, the share barely moves: the “policy supply against policy demand” problem the companion volume names, here where policy supply is genuinely good (Wilse-Samson, 2026).
5. Geography and infrastructure
The pole is a fan rather than a line. One port at Mombasa, one railway and one trunk road running about 480 kilometres inland to Nairobi and about 660 kilometres more to Kampala, and from there splitting to Kigali, to Juba and to the eastern Congo. Everything about the economic geography follows from the fact that the fan’s handle is a single point on the coast. Jedwab, Kerby and Moradi (2017) showed that the colonial railway placed Kenya’s cities where they still are, long after the line stopped mattering; the standard-gauge railway of the 2010s runs beside the old one because the geography that dictated the first route dictates the second.
The railway. Kenya’s line reached Nairobi in 2017 and Naivasha in 2019 and stopped there, 592 kilometres from the sea and well short of the Ugandan border, because the money ran out. The remaining sections, Naivasha to Kisumu at 262.3 kilometres and Kisumu to Malaba at 102 kilometres, are costed at about $5.3 billion, and construction has restarted on an additional KSh 14 billion allocation and renewed Chinese financing. A railway that ends in the middle of the Rift Valley is worse than no railway for the corridor as a system, because cargo transfers to road for the second half and the transfer costs more than the saving. This is the pole’s clearest instance of infrastructure built to a national budget across a regional geography.
The port. Mombasa handled 2.11 million twenty-foot equivalent units in 2025, up 5.5 percent, on total throughput of 45.45 million tonnes, up 10.9 percent; its transit traffic, the cargo bound for Uganda, Rwanda, South Sudan and the eastern Congo rather than for Kenya, rose 19.5 percent to 15.88 million tonnes. Transit is the number to watch, because it measures the port’s franchise over the interior rather than the Kenyan economy, and it is what Dar es Salaam competes for.
Dar es Salaam and the Central Corridor
Tanzania is not the Northern Corridor’s hinterland. It is the operator of the second route, and on current trends it is winning.
The Central Corridor runs from Dar es Salaam west to Lake Tanganyika and Lake Victoria and on into Burundi, Rwanda and the eastern Congo. Its port has been transformed: Dar handled 27.7 million tonnes in the 2024/25 financial year against 23.69 million the year before, booked 33.7 million tonnes for 2025/26, and its ports authority is targeting 54.59 million tonnes by 2030/31. Kigali is roughly 1,400 kilometres from Dar and about 1,700 from Mombasa, so the Central Corridor is the shorter route for the pole’s landlocked members whenever it is the reliable one, and for the first time in half a century it is becoming the reliable one.
The reason is a railway of a different design. Tanzania is building a 2,561-kilometre standard-gauge network at a cost of roughly $10 billion, electrified rather than diesel, from Dar es Salaam through Dodoma and Isaka to Mwanza on Lake Victoria, with spurs planned to Rwanda and Burundi. Passenger service on the Dar to Dodoma section opened in mid-2024 and had carried about 6 million passengers by May 2026; electric freight on the same 460-kilometre section began in July 2025; a $2.33 billion package agreed in April 2026 finances the Makutupora to Isaka and Isaka to Mwanza sections, with the line targeted for 2030. The contrast with the Kenyan line flatters neither. Tanzania spread its financing across export credit agencies, commercial syndicates and multilateral lenders instead of concentrating it in one bilateral creditor, which is why its card carries $2.4 billion of Chinese commitments against Kenya’s $10.0 billion, and why its external debt is 41.6 percent of output with no bond in it at all. It has also taken twice as long and is not finished.
Tanzania matters here for a second reason. It is one of the two countries in which the dual-firm structure was measured directly (Diao, Ellis, McMillan and Rodrik, 2021): large Tanzanian firms raising productivity without adding employment, small ones adding employment without raising productivity, the two never meeting. Figure 26.2 shows Tanzania with the pole’s only healthy combination of within-sector and between-sector growth, and Table 26.1 its lowest wage-employment share. The reconciliation is the puzzle: the productivity is real, and it is happening in a part of the economy that employs almost nobody, in a country whose working-age population grows at 3.55 percent a year and whose population passes 129 million by 2050. If the manufacturing puzzle is solved anywhere, it will have to be solved here, at that scale, on that timetable.
6. Megaprojects and cities
A caution first, and it falls hardest on this chapter. Three of the four cards here carry an agglomeration population, Dar es Salaam at 6.9 million, Kampala at 6.1 and Kigali at 3.6, against 15.6, 17.2 and 10.4 million in 2050, and Kenya’s does not. The agglomeration database redrew its objects between vintages, and on the newer rule Kenya’s largest is not Nairobi at all but a western conurbation of 17.6 million, two fifths of the country’s entire urban population, so the book withholds the field rather than print it (Africapolis, 2025). The pole this chapter is named for is the one whose city cannot be counted, which is the data-quality layer arriving exactly where it hurts. Every population figure below is national: Kenya’s 56.4 million today and 83.6 million in 2050, Uganda’s 50.0 million and 85.4 million.
The expressway. The 27.1-kilometre elevated toll road above Mombasa Road is the purest specimen of the pole’s financing model. A Chinese state contractor built it under a thirty-year arrangement in which it operates and tolls the road for 27 years before handing it back in 2049, with toll revenue over the concession projected at KSh 302.5 billion. Traffic in the year to June 2024 averaged about 11,000 vehicles a day and the operator reported a loss of KSh 1.8 billion in the six months to December 2024; usage has since risen several-fold. What it shows is that the pole attracts private capital into infrastructure when the revenue is tolled at the point of use, and almost never when it depends on a government’s promise, which is the difference between this project and the railway.
Konza and Tatu City. The technology city on the Mombasa road, planned since 2008 as the home of the business-process industry, has been slower than every projection made for it: investor numbers rose from 70 in 2024 to 78 in 2025 and committed investment from KSh 83.48 billion to KSh 99.38 billion, with the first phase of horizontal infrastructure commissioned in October 2025. That is real, and a fraction of what was promised. Tatu City, the privately developed satellite north of Nairobi, is the more interesting case because it is not a government project: a special economic zone with its own water and power, industrial tenants that manufacture, and residents. Private capital will build the city and the substation where it can capture the return, which is evidence for Section 3: the constraint is not an absence of capital.
Bagamoyo and Lamu. The pole’s two monuments to port ambition sit at opposite points of the cycle. Lamu, the anchor of Kenya’s northern scheme toward Ethiopia and South Sudan, opened its first berth in 2019 and was commissioned in 2021, and has three of a planned 23 berths and very little traffic. Bagamoyo was announced, cancelled and revived; work began in 2025 with TZS 22 billion for the first berth foundations, and the selected operator, the logistics arm of a global shipping line, is to design, build and run the first three berths of a plan running to 28 berths, a special economic zone and about $10 billion. The pattern is this book’s rule about ports: a berth is not a port, a port is not a corridor, and a corridor is not traffic.
7. Firm profiles
Safaricom, Nairobi
Safaricom is the most important firm in this pole, and the reason is one product. M-Pesa began in 2007 as a way to send money home over a telephone network and became the payments infrastructure of a country. In the year to March 2026 it moved KSh 41.68 trillion across 46.41 billion transactions, up 8.9 percent in value and 25.1 percent in volume, and served 40.99 million monthly active customers in a country of 56.4 million people. Its Kenyan revenue was KSh 182.7 billion, 45.6 percent of the company’s Kenyan service revenue, and the merchant base rose 71.0 percent to 3.1 million. Group service revenue was KSh 414.1 billion, up 11.1 percent, and net income KSh 99.7 billion, up 67.3 percent.
Three things make this the right firm for the centre of the chapter. It is genuine infrastructure rather than a rented task, in Section 1’s distinction: its value sits in an agent network of small traders, a regulatory settlement that let a telephone company hold deposits, and eighteen years of accumulated trust. Its measured welfare effects are among the best documented anywhere, and Section 8 gives them. The third is awkward. A firm serving 41 million customers employs a few thousand people directly, and the agent network is exactly the informal, low-capital self-employment the wage-employment overlay exists to distinguish from a job. Safaricom is the clearest demonstration in Africa that a technology can transform a population’s welfare without measurably moving the identity’s second term, and any claim that fintech is the continent’s jobs answer has to begin by explaining that.
CRDB Bank, Dar es Salaam
CRDB is the largest bank in Tanzania and the pole’s best example of a domestically owned financial institution built at regional scale. In 2025 it grew total assets 8.6 percent to TZS 22.22 trillion, took customer deposits to TZS 14.68 trillion, earned net profit of TZS 724.6 billion against TZS 551.5 billion the year before, returned 29.3 percent on average shareholders’ funds, and operated 261 branches, with subsidiaries in Burundi and the Democratic Republic of the Congo.
Most large East African banks are subsidiaries of Kenyan, South African or European groups, and their profits are repatriated accordingly; CRDB is owned and listed at home, and has followed the Central Corridor into the two markets it serves, which is what a regional bank looks like when integration works. It is also the balance-sheet counterpart of Section 3: a bank earning 29 percent on equity in an economy whose firms complain of credit scarcity is a bank whose best asset is not a loan to a firm. That sentence is milder in Tanzania than in Kenya, because Tanzania’s sovereign borrows less at home, and the difference is a natural experiment the next five years will report on.
8. What the experiments say
The pole’s interventions work, and none of them is a jobs policy
East Africa is, after South Africa, the most heavily experimented-on economy on the continent, and three findings speak to the arguments above.
Egger, Haushofer, Miguel, Niehaus and Walker (2022) delivered one-time transfers of about a thousand dollars to more than 10,500 households across 653 randomized villages in western Kenya, a fiscal shock of over 15 percent of local output, and measured non-recipients and firms as well as recipients. The result that matters here is the local transfer multiplier of about 2.5: income arriving from outside a poor rural economy raised local output by substantially more than the transfer, with large spillovers to households that received nothing and minimal price inflation. Chapter 10 uses this to defend social protection; its relevance here is harsher. In a labour-abundant economy with idle capacity the constraint on local activity is demand rather than technology, which is consistent with the crowding-out diagnosis of Section 3 and not with the claim that East African firms are held back mainly by skills.
Suri and Jack (2016) traced the rollout of M-Pesa agents across Kenya and estimated that access to the system raised consumption enough to lift about 194,000 households, roughly 2 percent of Kenyan households, out of extreme poverty, with effects concentrated among female-headed households and running partly through a shift of women out of subsistence agriculture into business and retail. This is the strongest evidence anywhere that a payments technology changes real welfare at national scale. Read against Table 26.1, it is also the chapter’s central awkwardness: the decade in which that happened is the decade in which Kenya’s employment ratio fell by 1.17 percent a year.
Alfonsi and others (2020) ran the labour-market experiment this pole most needed, tracking about 1,700 Ugandan workers and 1,500 firms for four years where youth unemployment exceeded 60 percent. Workers were randomly offered six months of vocational training or six months of training inside a firm. Both raised skills, employment and earnings against the control, on different clocks: firm-provided gains came quickly and faded, vocational gains came slowly and lasted, so the vocationally trained ended ahead. The systems finding is that the binding friction is the certification of skill rather than its acquisition, because a worker trained inside one firm cannot prove anything to the next.
Cash raises local output, payments raise consumption, training raises employability, and none of the three, at any plausible scale, moves a national employment ratio. That gap is the honest shape of the evidence under this chapter.
9. Climate exposure
The pole’s climate exposure comes in three forms, and only the first is usually discussed.
Drought inland. Between late 2020 and 2023 the Horn of Africa recorded five consecutive failed rainy seasons, the worst drought in 40 years, in which about 2.5 million head of livestock died in Kenya alone and regional livestock losses were put at roughly $1.5 billion. The mechanism is capital destruction rather than hunger alone: for a pastoral household the herd is the balance sheet.
Flood in the cities. The same system delivered the opposite in the rains of March to May 2024, when 294 people were killed in Kenya, about 55,000 households were displaced, 11,000 head of livestock died and 65,000 acres of cropland were lost, with more than 7,000 people displaced in Nairobi’s Mathare settlement alone. Drought and flood within three years, in one country, is the shape of the risk, and it is why this book treats water variability rather than mean temperature as the operative climate variable in East Africa.
The port. Mombasa is the exposure that would be systemic, because the pole has one main gate to the sea and it is at sea level. About 94 percent of Mombasa is low-lying coastal zone; a sea-level rise of 0.3 metres would put roughly 17 percent of the city, about 4,600 hectares, under water, and a rise of 1 metre about 26 percent of the island. Present exposure to a one-in-a-hundred-year water level is put at about 190,000 people and $470 million of assets, rising to over 380,000 people and $15 billion by 2080, and the shoreline is retreating at 2.5 to 20 centimetres a year. A corridor whose whole logic is a single point of entry carries a concentration risk that the Central Corridor, by existing, partly hedges: an underrated argument for the redundancy Section 5 describes as competition.
10. Data quality
Data quality in this book is a layer rather than a caveat, so it gets its own section and its own table.
| Country | Last census | Last GDP rebasing | Last labour-force survey | Statistical performance score | Confidence flag |
|---|---|---|---|---|---|
| Kenya | 2019 | 2021 | 2024 | 73.4 | high |
| Tanzania | 2022 | 2021 | 2024 | 68.2 | medium |
| Uganda | 2024 | 2019 | 2021 | 68.7 | medium |
| Rwanda | 2022 | 2025 | 2024 | 72.6 | high |
Sources: national statistical offices for census, rebasing and survey years; World Bank Statistical Performance Indicators for the score; the confidence flag is this book’s own rule, described on the About the data page.
By the standards of the 54 this is a well-measured pole. All four countries have censused since 2019, all four have rebased this decade, and all four ran a labour-force survey within the last five years, which is true of only 34 of the 54. Kenya and Rwanda carry high confidence flags on statistical performance scores of 73.4 and 72.6. That is why this chapter is willing to argue about a single country’s employment ratio, which Chapter 24 was not.
Three qualifications belong beside the table. Uganda’s survey is the pole’s oldest, from 2021, and its census the newest, from 2024, so its identity terms rest on a population count its labour series has not caught up with. Rwanda’s 2025 rebasing is recorded on the card from press reporting rather than a statistical release, so it is provisional. And Tanzania’s rebasing year of 2021 is the year of the earliest dated source reporting the revised base rather than a documented release date, which is exactly what this layer exists to say out loud.
What the numbers can bear, then: the ordering of the four on all three terms is robust; Kenya’s negative second term is a finding rather than an artefact, because it comes from a country with a recent census, a recent survey and the pole’s best statistical score; and the within-and-between split can be quoted for all four, though it ends in 2018. What they cannot bear is a metropolitan population for any city here, a claim about Ugandan employment composition that assumes the 2021 survey still describes the labour market, or a precise reading of the Tanzanian series across the rebasing.
11. Data sources
- UN World Population Prospects 2024, medium variant: every population figure here, national rather than metropolitan, and term one. Ages 15 to 64 throughout.
- ILOSTAT modelled estimates, November 2025: terms two and three and the wage-employment, non-agricultural, informality and youth-inactivity overlays, modelled rather than surveyed, which is why Section 10 lists the survey years beside them.
- IMF World Economic Outlook, April 2026: output levels, output per head, observed growth and the forecast.
- Groningen Growth and Development Centre, Economic Transformation Database: the within-and-between split of term three, over 2008 to 2018, for all four cards.
- World Bank International Debt Statistics, 2025 release, in which bilateral lending is not split by creditor country, and the Boston University Global Development Policy Center, Chinese Loans to Africa database, 2000 to 2024 release, a cumulative flow of commitments rather than a stock: the balance-sheet table.
- World Bank Statistical Performance Indicators and the four national statistical offices: the data-quality table.
- National Treasury of Kenya, the Controller of Budget and the Central Bank of Kenya: debt service, interest and private credit in Sections 2 and 3.
- Kenya Ports Authority and the Tanzania Ports Authority for throughput and transit; Kenya Railways and the Tanzania Railways Corporation for the standard-gauge programmes; the East African Community Secretariat for contributions, arrears and intra-community trade; company reports for Safaricom and CRDB Bank.
- The New Regional Economics, chapters 13 and 14 (Wilse-Samson, 2026): the corridor-time table, the reform sequence, the Nairobi agglomeration comparison and the policy-supply argument this chapter cites rather than repeats.
12. Exercises
Discussion questions
Kenya recorded the pole’s second-strongest output-per-worker growth and its steepest fall in the employment ratio over the same decade. Using Figure 26.2 rather than a list of policies, give the two most plausible accounts of how both happened at once, and say what evidence, observable before 2030, would distinguish them.
This chapter argues that the binding constraint is the cost of finance to private firms, created by a sovereign that has taken over its own credit market, and sets aside infrastructure, where Chapters 24 and 25 landed. Build the strongest case that infrastructure binds here too: what would have to be true, and which observation would settle it? A diagnostic no future observation could overturn is a preference, not a diagnosis.
Rwanda posts the continent’s second-highest growth rate, the pole’s highest wage-employment share, and its highest share of young people in no activity at all. Apply Dercon’s test to the Rwandan settlement and then to the Tanzanian one, and say whether a test that scores a closed settlement highly is telling you something about the countries or something about the test.
Try it
Open the corridor’s three largest economies side by side: Kenya, Tanzania and Uganda, in that order. Read down the identity block, where the three columns share one scale, then down the overlays. Write one paragraph on a single question: handed the identity columns without the country names, which economy is doing best, and does your answer survive the wage-employment and non-agricultural shares underneath? Then swap Rwanda in for Uganda and ask the same of a country whose productivity growth is almost entirely reallocation.
Data exercise
Download all fifty-four cards from the country cards page on this site, as cards.csv or cards.json, and build a table of the four countries here with the three identity terms, implied and observed growth, overlays.wage_employment_share, overlays.output_per_worker_within, overlays.output_per_worker_between and data_quality.confidence_flag. Then do four things. First, reproduce Table 26.1 and confirm the three terms sum to implied growth and that implied is close to observed. Second, compute a population-weighted and an output-weighted average of each term across the four, and say why Kenya dominates one weighting and Tanzania the other. Third, compare each country’s within-plus-between total with its output-per-worker term, note that the windows differ, and say what that difference does and does not license you to conclude. Fourth, extend the table to every card carrying the within-and-between fields, rank them by the between-sector component, and say where Rwanda sits and what the ranking would look like if reallocation out of agriculture were a measure of success rather than of starting position. Treat nulls as missing, never as zeros.