27. Cairo–Suez and the Nile
Pole type: productivity platform, with the rents of a location.
In 2023, 26,000 ships carrying a large share of the world’s seaborne trade paid $10.25 billion to cross 193 kilometres of Egyptian sand. In 2024, after missiles began flying at merchant hulls in the Bab el-Mandeb, 13,213 ships paid $3.99 billion. Nothing about Egypt changed. No canal silted, no tariff moved, no worker in Ismailia became less productive. A war a thousand kilometres to the south removed about $6 billion from the country’s foreign-currency earnings in a year, and the Egyptian state could do nothing about it except wait. That is what it means to earn your living from a location.
Learning Objectives
After reading this chapter, you should be able to:
- Place Egypt in the book’s identity and explain why it is the continent’s clearest term-three economy: a working-age population growing well below the African median, an employment ratio that has barely moved, and output per worker carrying most of the growth of a decade.
- Read a rent platform on the balance sheet: canal receipts, remittances, tourism, gas, Gulf capital and the Fund’s largest African arrangement, and say which are earned, which are borrowed and which are sold.
- Run a growth diagnostic on an economy that is not short of infrastructure, and defend the claim that what binds here is appropriability, meaning the terms on which a private firm competes with the state and with the army, rather than power, ports or skills.
- Describe the Egyptian settlement in the vocabulary of Chapter 5, and say what the currency crisis of 2022 to 2024 and the Ras El Hekma transaction reveal about whether the elite has bet on growth.
- State what the Nile and the Grand Ethiopian Renaissance Dam do to the arithmetic of a country whose water allocation is fixed and whose population is not, and what a rent platform becomes in each of the two worlds of Chapter 1.
Egypt is the second-largest economy on the continent, at $364.6 billion, or 11.6 percent of African output, produced by 7.7 percent of African people, and the third-largest population at 116.5 million. It is also, on almost every demographic measure the cards carry, the least African-looking economy in the book: a median age of 24.3 against a continental median of 18.9, a fertility rate of 2.7 against 3.8, and a dependency ratio of 59.0 against 73.9. The demographic century that Chapters 2 and 24 are about is not Egypt’s century. Its transition is two thirds done.
The chapter’s argument, stated at the front so a reader can watch it being tested, is this. Egypt is the continent’s purest rent platform: its foreign-currency earnings come overwhelmingly from a canal, a diaspora, a coastline sold to tourists, a gas field and the goodwill of four Gulf capitals, and its domestic economy is organized around distributing what those five bring in. That is not a slander. A rent platform can be rich, and Egypt’s output per head is twice the continental median. But it produces a specific pathology, which the identity makes visible and Section 3 names: an economy in which the state can outbid the private firm for capital, land and labour, because the state holds the rents.
1. The pole in the identity
This is the book’s only single-country pole, so the identity table has one row. Chapter 1 set out the arithmetic: in growth rates, output per worker plus the employment-to-working-age ratio plus the working-age population sum, to a first approximation, to GDP growth.
| Country | Term one: working-age population | Term two: employment ratio | Term three: output per worker | Implied growth | Observed growth | Gap | Wage employment (percent) | Non-agricultural employment (percent) | Confidence |
|---|---|---|---|---|---|---|---|---|---|
| Egypt | 1.96 | 0.07 | 2.26 | 4.29 | 4.33 | -0.05 | 72.9 | 82.0 | high |
Table 27.1. All three terms are annual growth rates in percentage points over 2014 to 2024; the last three columns are shares and a flag. The gap is implied growth less observed. Sources: UN World Population Prospects 2024 for term one, ILOSTAT modelled estimates, November 2025, for terms two and three, and the IMF World Economic Outlook, April 2026, for observed growth, all via the country card.
One row tells you very little, so Table 27.2 sets it against the middle of the continent and the two other term-three poles: Morocco, the Maghreb manufacturing platform of Chapter 28, and South Africa, the Gauteng productivity platform of Chapter 25.
| Term one | Term two | Term three | Observed growth | Wage employment (percent) | |
|---|---|---|---|---|---|
| Egypt | 1.96 | 0.07 | 2.26 | 4.33 | 72.9 |
| Continental median | 2.89 | -0.15 | 0.74 | 2.91 | 31.0 |
| Morocco | 1.10 | -0.45 | 1.88 | 2.54 | 59.6 |
| South Africa | 1.61 | -0.45 | -0.48 | 0.67 | 82.7 |
Table 27.2. The same four measures for Egypt, for the middle of the distribution of country cards, and for the two other poles in which term three carries the case. The medians are computed across all cards carrying the field: 54 for term one, 53 for terms two and three, observed growth and the wage-employment overlay.
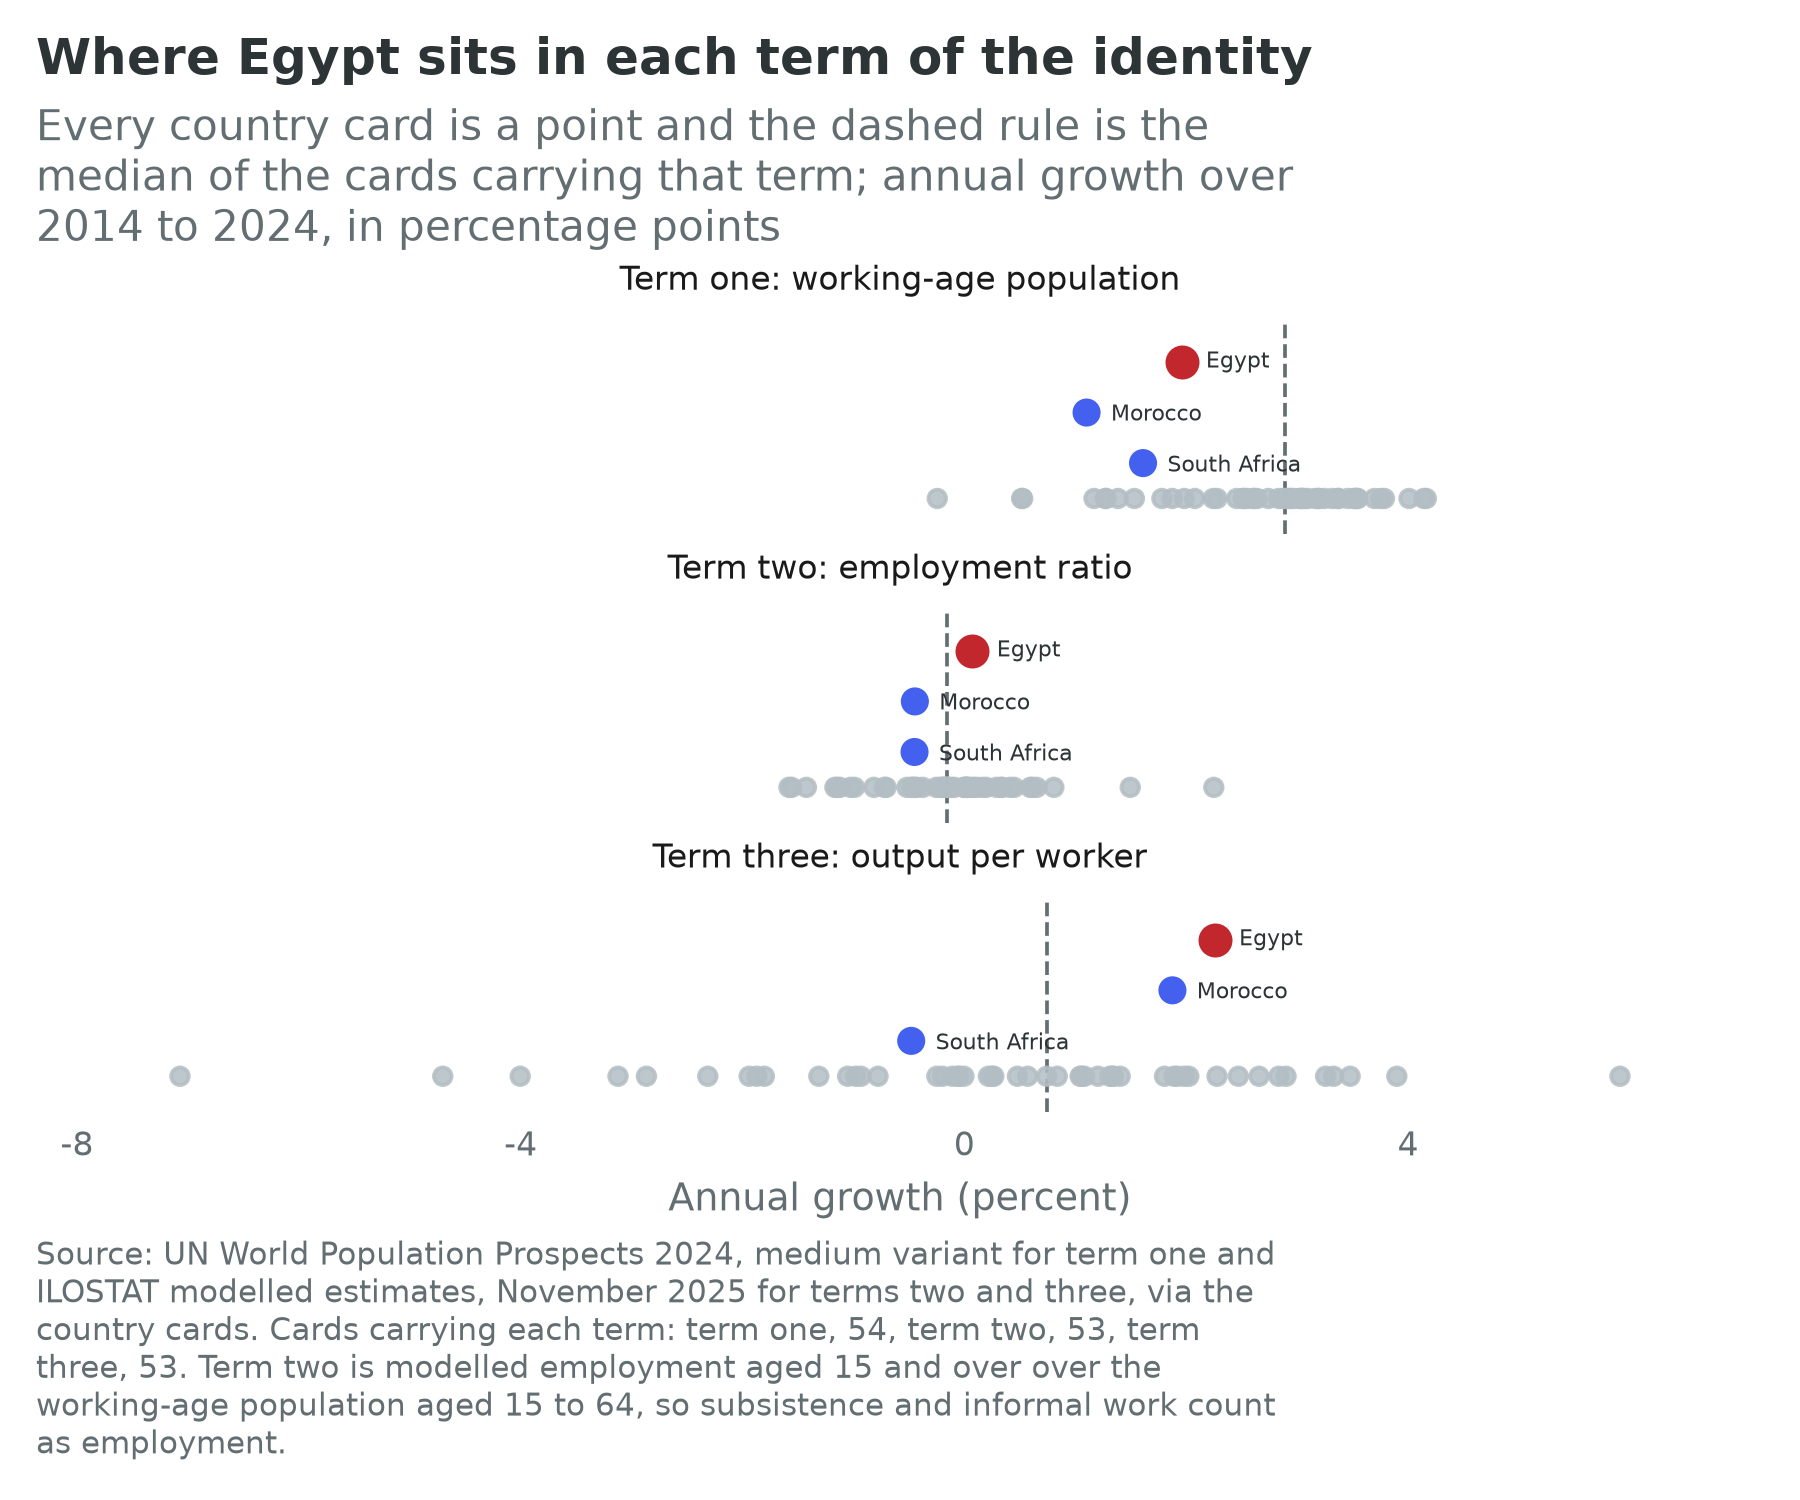
Read the row and the comparison together and three things follow.
Term one is slow, and that is the whole difference between this chapter and Chapter 24. Egypt’s working-age population grew at 1.96 percent a year over the decade, forty-second of the 54 cards and a full percentage point under the continental median of 2.89, and the projections keep it that way: 116.5 million today, 161.6 million in 2050 and 201.9 million in 2100, a rise of 73 percent over three quarters of a century against a continental figure roughly twice that. Egypt does not get the free term. Whatever it earns this century it must earn from the other two.
Term two is flat, and flat is a good score here. Egypt’s employment-to-working-age ratio grew at 0.07 percent a year, which is to say it did not move; and because the continental median is negative at minus 0.15, not moving puts Egypt sixteenth of the 53 cards carrying the term. That is a low bar cleared, not a success. The overlays say why. Egypt’s wage-employment share is 72.9 percent, fifth-highest on the continent and more than twice the median of 31.0; its non-agricultural share is 82.0 percent against a median of 59.0; and informal employment is 68.6 percent against a median card of 89.1. On the overlays that carry the jobs thesis, Egypt looks like a middle-income economy rather than an African one.
And then there is the number that undoes the paragraph above. The card records employment at 15.6 percent of working-age women and 67.3 percent of working-age men. That is one of the widest gaps in the world, and it means the flat middle term is an average across two labour markets that barely overlap. Chapter 10 argues that the continent’s largest single reserve of unused labour is female; here it is not a reserve, it is a wall.
Term three carries the chapter. Output per worker grew at 2.26 percent a year, eleventh of the 53 cards and three times the median of 0.74. Add the three terms and you get 4.29 percent implied against 4.33 percent observed, a gap of five hundredths of a point, which is as close as the decomposition comes anywhere in this book. Egypt grew at more than 4 percent a year for a decade and more than half of it was output per worker. On the face of it that is the thing the whole book is looking for.
The split of term three is where the face of it stops being enough. Over the window the transformation database covers, 2008 to 2018, Egypt’s output-per-worker growth divides into 1.20 percentage points a year from firms getting better within their sectors and 0.31 points from workers moving between sectors. Set that beside Morocco, at 2.81 within and 1.13 between, and South Africa, at 0.39 within and minus 0.21 between. Three term-three poles, three engines. Morocco’s productivity comes from both halves at once, which is what structural transformation is supposed to look like; South Africa’s comes from neither; Egypt’s comes overwhelmingly from within sectors, with reallocation contributing about a fifth of the total. Firms got better. Workers did not move.
That is the Diao, Ellis, McMillan and Rodrik (2021) pattern from an unfamiliar angle: Egypt has an acute case of large firms raising productivity without adding employment, and, because its demography is slow, not much of the answering half in which small firms add employment without raising productivity. What this pole adds to Chapter 6’s informality argument is that informality can be modest and the jobs problem severe at the same time.
What a rent platform becomes in two worlds
Chapter 1 stated the world in which the identity’s underlying assumption fails: one where the frontier of production is a stock of machines and energy rather than a stock of workers. Egypt’s position in that world cuts both ways at once.
On the asset side, Egypt owns two of the four things Chapter 1 says would be worth something in a labour-redundant century. It has location, in a form no substitute reproduces, since over 90 percent of Europe-to-Asia communications traffic crosses Egyptian territory in submarine cables (Center for Strategic and International Studies, 2025). And it has the means of energy: sun, wind on the Gulf of Suez, and a grid with headroom. A country on the shortest cable route between two continents, next to a canal, with land and sunlight, is well placed to sell electrons and latency to people building data centres, which is more or less what the Suez Canal Economic Zone’s promoters now say the zone is for.
On the exposure side, Egypt has built exactly the industry the machine century eats first: offshoring and business-process exports reached about $5.2 billion in 2025, concentrated in the contact-centre and back-office work Chapter 1 named as the first casualty of a model that answers calls. In the labour-abundant world Egypt sells its graduates’ time; in the labour-redundant world it sells the ground their cables run under. Only one of those is a jobs strategy.
2. The pole on the balance sheet
The rents arrive in five streams and the cards carry almost none of them. What the cards do carry is the other side: the stock of claims those streams must service.
| External debt stock (\(bn) | Multilateral (\)bn) | Other bilateral (\(bn) | Bonds (\)bn) | Other private (\(bn) | Chinese loan commitments, 2000 to 2024 (\)bn) | ||||
|---|---|---|---|---|---|---|
| Egypt | 156.0 | 30.8 | 29.6 | 27.3 | 46.6 | 7.7 |
| Morocco | 68.0 | 21.5 | 7.2 | 13.6 | 17.0 | 1.0 |
| South Africa | 175.9 | 9.2 | 4.6 | 77.4 | 84.1 | 5.5 |
Table 27.3. Sources: World Bank International Debt Statistics, 2025 release, for the stock and the creditor lines; the Boston University Chinese Loans to Africa database, 2000 to 2024 release, for the last column, which is a cumulative flow of commitments and not a stock. The creditor columns are publicly guaranteed long-term debt and do not add to the stock, which also carries short-term debt, Fund credit and private non-guaranteed borrowing.
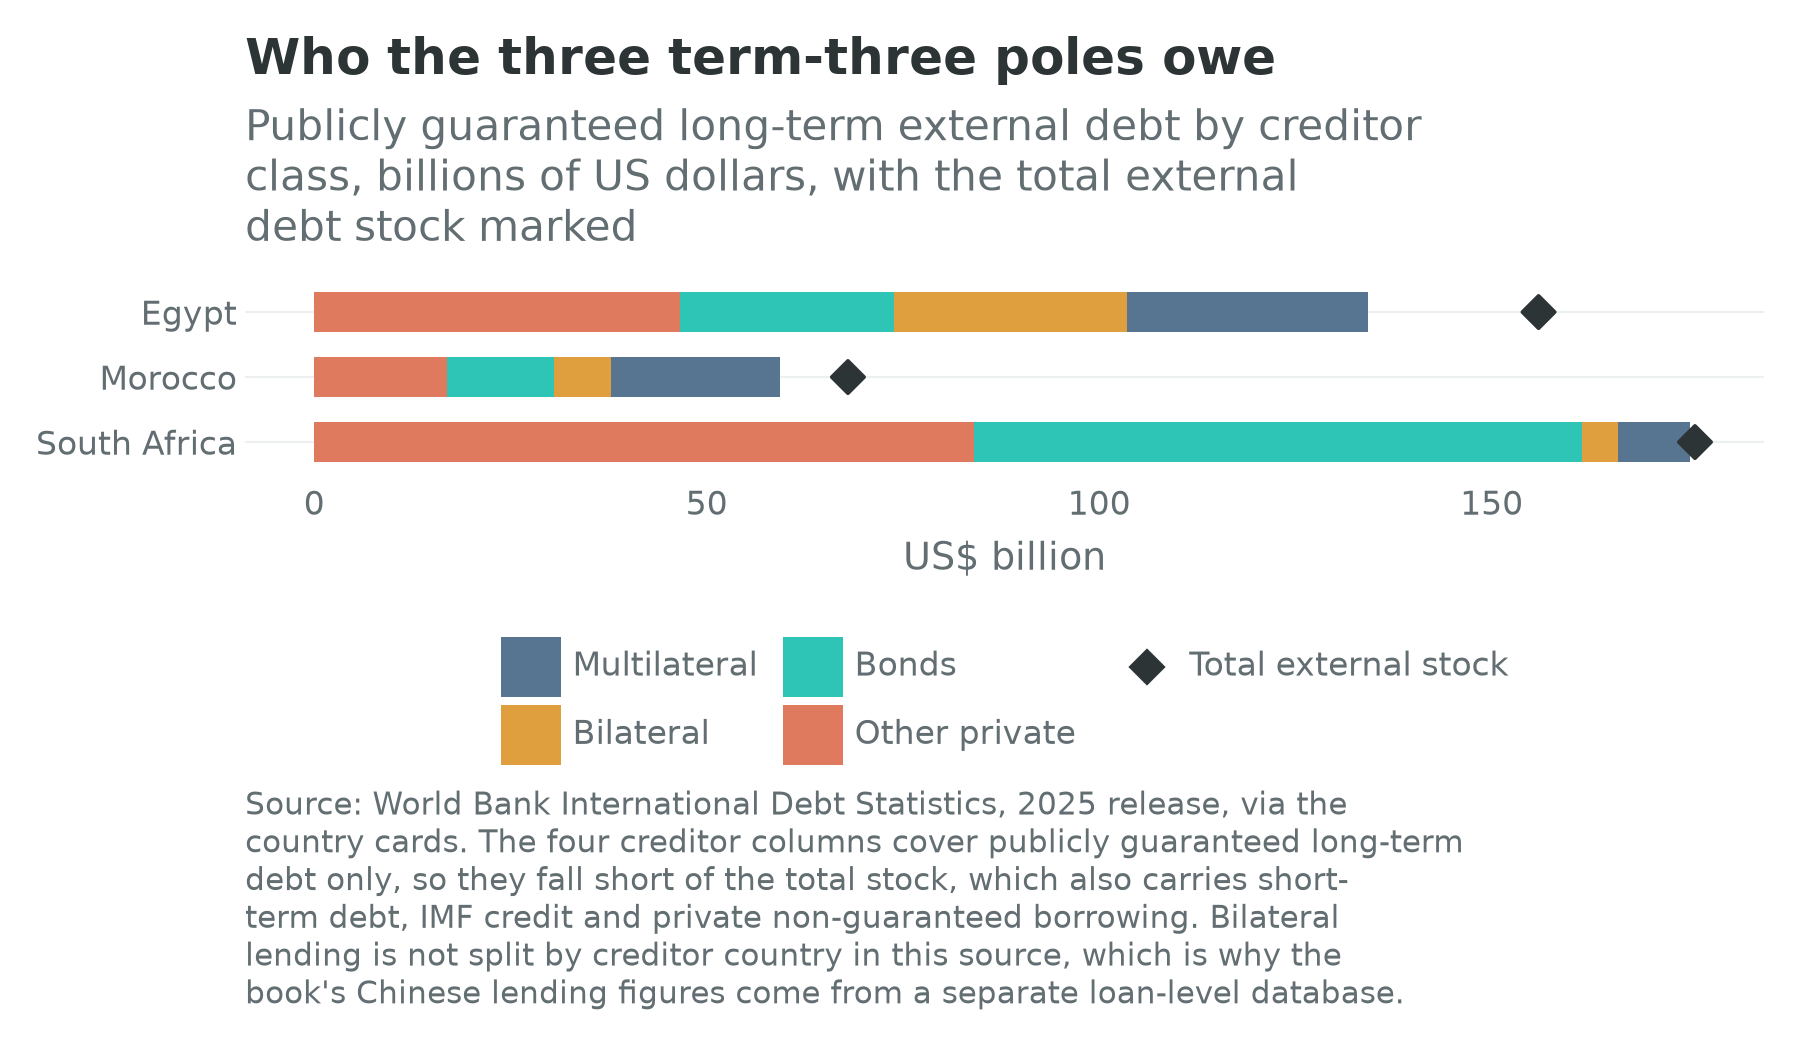
Egypt’s external debt stock is $156.0 billion, the second-largest on the continent after South Africa’s, and about 43 percent of a year’s output. The composition is the interesting part. Egypt is the only one of the three poles whose debt splits roughly evenly between official and private creditors: $30.8 billion multilateral and $29.6 billion bilateral against $27.3 billion of bonds and $46.6 billion of other private credit, where South Africa owes $9.2 billion to multilaterals and $161.5 billion to private lenders of one kind or another. A country that owes that much to official creditors has, in effect, chosen to be governed in part by them, and Section 4 takes up what that has bought.
The China line runs the other way here from almost every card in this book. Egypt owes $5.9 billion to creditors in China against $16.7 billion to the twenty-two members of the Paris Club, the largest single Paris Club claim on the continent, inside a bilateral column of $29.6 billion that is larger than any other African country’s. The rest of that column is the Gulf, which no card field names. The loan-level database records $7.7 billion of Chinese commitments between 2000 and 2024, the sixth-largest total among the 49 cards carrying the field, so on Egypt the commitment record and the outstanding balance are unusually close, 1.3 to 1 against a continental median of 1.9. That is a young lending relationship rather than a large one, and what is distinctive is where the money went, which is largely into the central business district of the New Administrative Capital that Section 6 describes. Chapter 32 works the general case, including the reason the China line and the bilateral column beside it cannot be added.
Now the income side, and the card carries the shape of it. Egypt took $41.5 billion of remittances and $15.5 billion of foreign direct investment in 2025, against $0.5 billion of official development assistance in 2023. The ordering is the point and it is not the ordering the phrase “aid to Africa” suggests: the diaspora sends this economy about eighty times what the donors give it. The finer figures in the next three paragraphs still come from named published sources rather than from the card, and should be held a little more loosely than the table above.
The canal. Suez receipts were $10.25 billion in 2023 on more than 26,000 transits, $3.99 billion in 2024 on 13,213, and about $4.2 billion in calendar 2025; the canal authority reported $4.67 billion for the 2025/26 financial year, up 23 percent, as traffic came back. The 2024 collapse is the cleanest natural experiment in this chapter: a 60 percent fall in a major foreign-currency line, caused entirely outside the country, with no domestic policy response available. Egypt cannot price the canal to win back a ship whose insurer will not cover the Red Sea.
The diaspora. Remittances were $36.5 billion in the 2024/25 financial year against $21.9 billion the year before, a rise of 66 percent, and reached $41.5 billion in calendar 2025. The jump is not a change in the number of Egyptians working in the Gulf. It is the exchange rate: when the pound was floated in March 2024 and the parallel market closed, money that had been arriving through informal channels began arriving through banks. A large part of Egypt’s most celebrated recent achievement is a measurement effect, and the mechanism will run in reverse if the gap between the official and the street rate reopens.
Tourism, gas and the Gulf. Tourism receipts were $14.4 billion in 2024 and $16.7 billion in 2025, on a record 19 million arrivals. Gas has gone the other way and gone fast: national production fell from about 6 billion cubic feet a day in 2022 to under 4 in 2025 as the Zohr field declined, and Egypt, a net exporter of liquefied gas as recently as 2022, imported a record 8.92 million tonnes in 2025. The country that was going to be the eastern Mediterranean’s gas hub now buys cargoes to keep its own air conditioning on. The fifth stream is not a stream but a sale: in February 2024 the Abu Dhabi sovereign fund ADQ agreed to pay $24 billion for the development rights to 170 square kilometres of Mediterranean coast at Ras El Hekma and to convert a further $11 billion of existing Emirati deposits at the Egyptian central bank into local-currency investment, with the Egyptian state keeping a 35 percent stake. Those deposits are the older instrument of Gulf support and they are shrinking as they convert: Gulf states held about $18.3 billion at the central bank in April 2026, of which $10.3 billion was Saudi. The direction of travel is from deposit to equity, which is to say from lending Egypt money to owning Egyptian assets.
Set against all this is the arrangement with the International Monetary Fund. Egypt agreed a $3 billion Extended Fund Facility in December 2022, saw it augmented to $8 billion in March 2024 in the week the pound was floated, and passed its seventh review on 30 July 2026, releasing about $1.8 billion, with the arrangement running to 15 December 2026. Egypt is the Fund’s fifth-largest exposure in its main lending account and by a wide margin the largest programme anywhere in Africa. A rent platform with five volatile income streams needs a lender of last resort with a very large balance sheet, and Egypt has arranged to have one.
Who owns the pole is the question the section is circling. The canal is the state’s; the banks are majority state-owned; large parts of cement, steel and construction are the army’s, which Section 3 takes up; and since 2024 a growing share of the best coastal land is a Gulf sovereign fund’s. Egypt has been selling assets to buy time, at a decent price.
3. The binding constraint
The growth-diagnostics method of Hausmann, Rodrik and Velasco (2005) asks one question and refuses the list of everything: of all the things wrong with an economy, which one, relieved first, would raise private investment most? It walks a tree and tests each branch by its shadow price rather than by whether the branch is in bad condition. Figure 27.3 draws the tree and marks the path the chapter argues for.
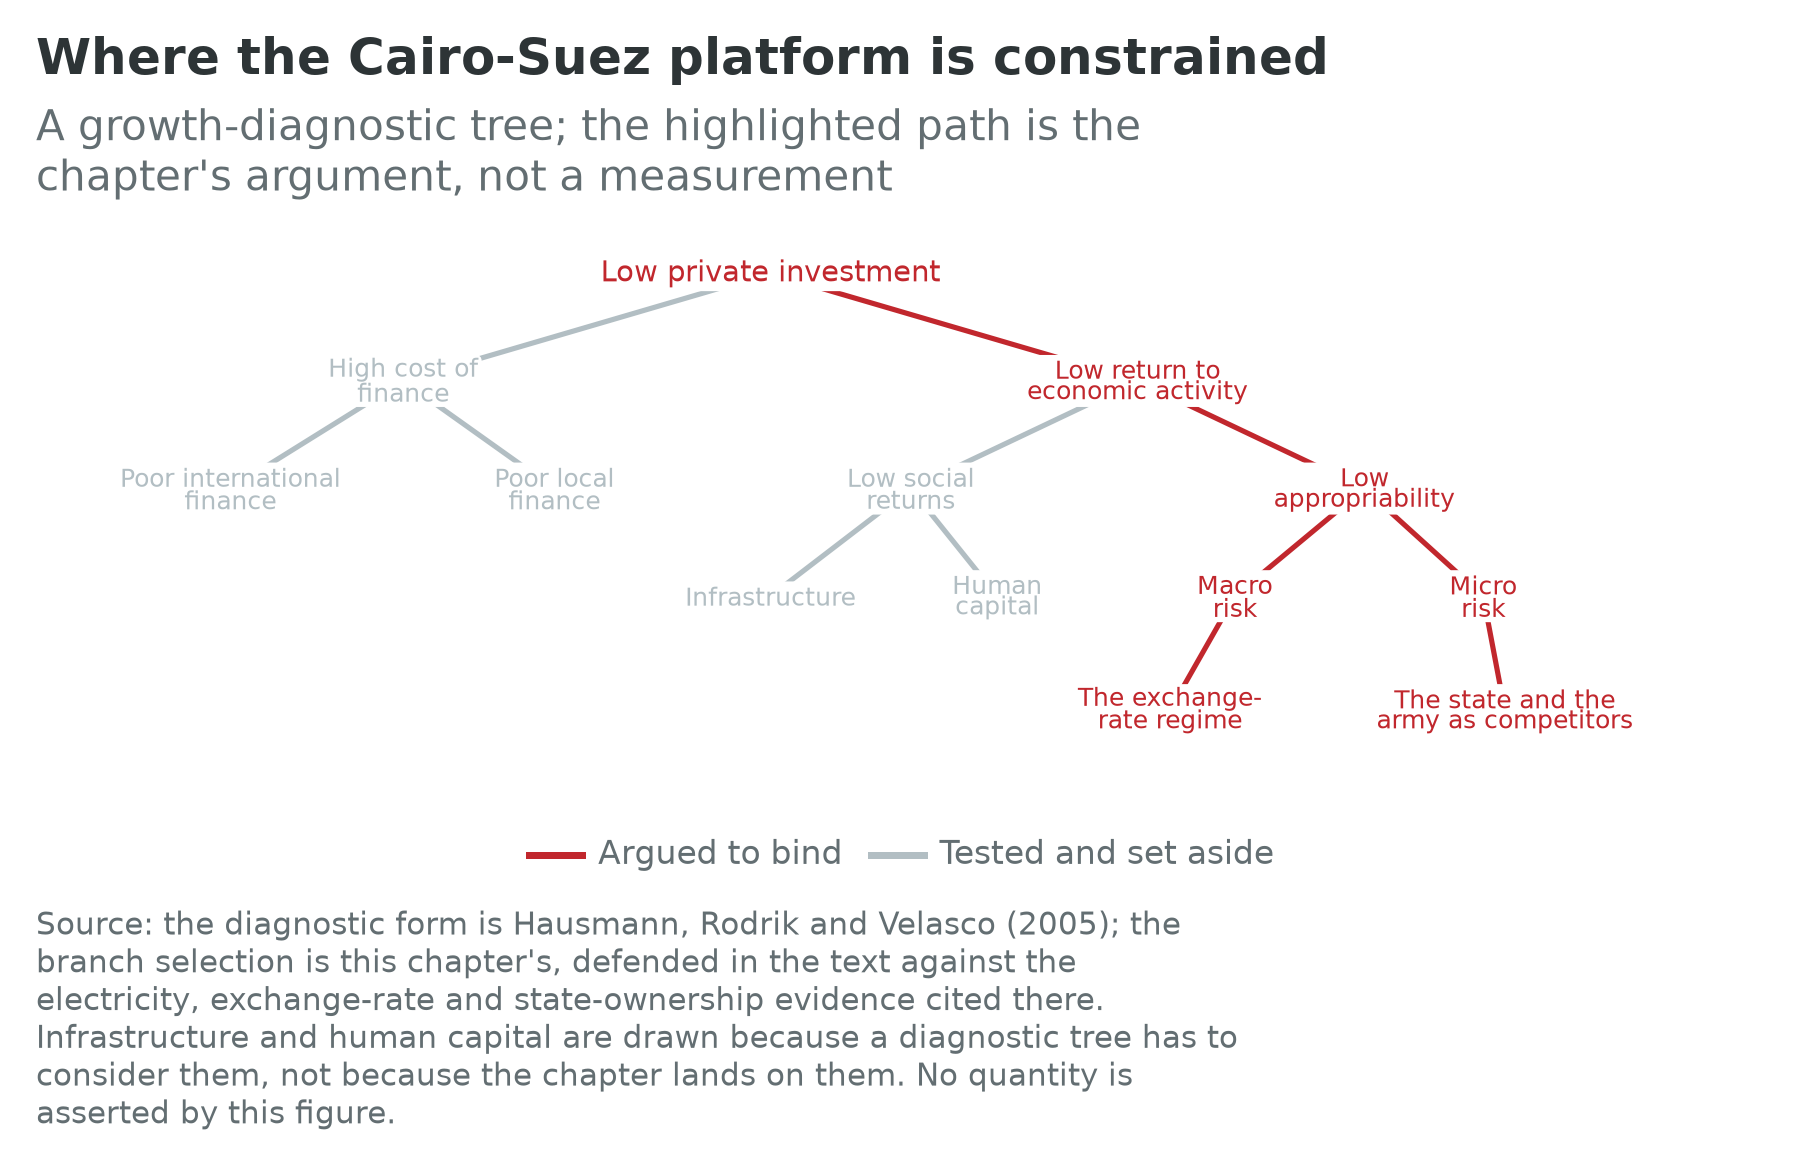
Start with the branch that binds in most of this book and does not bind here. Infrastructure is not the constraint in Egypt, and saying so is the most useful thing this chapter can do for a reader coming from Chapters 24 and 25. Installed generating capacity reached 59.7 GW by the end of 2024 against a summer peak demand of just over 37 GW, and the country has four deep-water ports on two seas, a road programme that has visibly worked, a metro in Cairo and a high-speed rail network under construction. Egypt did have power rationing in the summers of 2023 and 2024, and it is important to be exact about why: a fuel shortage, caused by the gas decline in Section 2, on a system with ample plant. An economy short of transmission has a construction problem; an economy short of gas to burn in turbines it already owns has a balance-of-payments problem wearing an energy costume.
Eliminate the cost of finance next, with a qualification. Egypt has continuous market access, re-entering the international bond market in January 2025 with a $2 billion two-tranche issue at yields of 8.62 and 9.45 percent, on top of a large if state-dominated banking system. Firms complain not that credit is unavailable but that it is dear because the sovereign is in the queue ahead of them, which is a symptom of the branch this chapter lands on rather than a branch of its own.
Human capital binds later rather than first, as in Gauteng. Youth not in employment, education or training runs at 23.8 percent, marginally below the continental median of 24.4, and the wage-employment share is fifth-highest on the continent. The offshoring sector in Section 1 exists because it can hire Egyptian graduates cheaply, the observable sign of a labour market where skill is not scarce enough to be bid up. Chapter 20 carries the quality argument, and it is serious. It is not what stops a factory being built next year.
What is left is appropriability, and within it two branches that in Egypt are the same branch seen twice.
Macroeconomic risk, meaning the exchange-rate regime. The pound went from about 16 to the dollar in March 2022 to about 30.9 by the start of 2023, and then, on 6 March 2024, the central bank abandoned the defence of a fixed rate and the currency settled near 50 within days, alongside a 600 basis-point rate rise. For a firm importing an input or servicing a foreign loan the relevant fact is the regime rather than the level: for two years the official rate was administered, foreign currency was rationed by queue, and letters of credit sat unhonoured at the port while an unofficial rate ran far from the official one. That is a tax on tradable production levied in uncertainty rather than in money, and it falls hardest on the firms a term-three economy needs.
Micro risk, meaning who you are competing against. The Egyptian state, and within it the armed forces, is a producer as well as a regulator. The Fund’s own review work identified 97 military-owned enterprises, 73 of them industrial, in sectors including cement, steel, marble and granite. Sayigh (2019) is the anatomy of that system and is careful about its size: the military’s direct share of national output is smaller than the folklore holds, and its real power lies in project management, land allocation, licensing and the award of public works rather than in the volume of goods it makes. Adly (2020) gives the resulting structure its best name, “cleft capitalism”: a segmented private sector in which a handful of large connected firms operate on one set of terms and a great many small ones on another, with almost nothing in between and no mechanism for a firm to cross from one to the other. What a private investor faces in Egypt is not an absent state or a predatory one. It is a competitor with cheaper land, exemptions from tax and customs, conscript labour and the tender in its gift.
The diagnosis has to have a testable implication or it is a preference, and here the experiment has partly been run. If the constraint is appropriability rather than infrastructure or finance, then capping the state’s own investment should raise private investment rather than lower it, because the two compete for the same land, credit and cement rather than complementing one another. Egypt capped public investment as a programme commitment, and the private sector’s share of total investment rose from 38.5 percent in the first half of the 2023/24 financial year to nearly 60 percent in the same half of 2024/25. That is not a randomized trial, and other things changed in the same window, notably the currency. It is nonetheless the observation the infrastructure diagnosis would not predict.
The counter-evidence belongs on the page. The purchasing managers’ index for Egypt’s non-oil private sector spent long stretches below 50 through 2024 and 2025, which is not what an unshackled private sector looks like, and the commitment to sell stakes in eleven state-owned enterprises by mid-2027 has repeatedly slipped, with the military-owned firms least touched of all. A diagnosis that says the constraint is the state’s presence in the market is only useful if the state’s withdrawal can be observed, and so far it has been announced more often than observed.
4. The political settlement
Chapter 5 supplies the vocabulary. Khan (2010) holds that institutions work only where they fit the underlying distribution of organizational power, so that the same written rule binds in one capital and evaporates in the next. Pritchett, Sen and Werker (2018) sort economies by whether deals are open or closed to newcomers and ordered or disordered in their enforcement. Dercon (2022) asks whether the elite has bet on growth or on dividing what exists.
Egypt is, in Khan’s terms, close to a textbook dominant-party settlement, except that the dominant organization is not a party. Since 2013 the armed forces have been simultaneously the guarantor of the political order, the largest single economic actor outside the banks, and the constituency whose material position the settlement must protect. That configuration is stable in a way competitive clientelism is not: no electoral cycle drives the fiscal one, and reforms once decided are implemented rather than negotiated. It is also, in Pritchett, Sen and Werker’s grid, about as ordered and as closed as a middle-income economy gets. A newcomer with a good project can be very successful in Egypt and cannot become a rival power. That is the settlement’s offer, and a great many firms have accepted it.
Dercon’s test is the harder one, and the honest answer is that Egypt has run an elite bargain on stability, with growth as the means rather than the end. The bet from 2014 to 2022 was legible: borrow abroad, spend at home on infrastructure and new cities, use the army as the implementing agency because it can deliver, and buy legitimacy with visible construction. It produced the term-three record in Table 27.1 and the debt stock in Table 27.3, and it ended in the foreign-currency crisis of 2022 to 2024, which is what happens when a country funds non-tradable investment with tradable liabilities.
Three episodes since then are the evidence a Dercon test would want. The first is the float of March 2024, described in Section 3: devaluing by a third overnight with inflation already high is a costly, constituency-losing act of exactly the kind the test looks for, and it was carried through rather than reversed.
The second is bread. On 1 June 2024 the price of a subsidized baladi loaf went from 5 piastres to 20, the first increase since 1989. In a state whose founding bargain since the 1950s has included cheap bread, and which saw riots over the same subsidy in 1977, touching it is the clearest available signal that the leadership believes it can no longer afford the old settlement. Even after the increase the price covers about 16 percent of the cost of the loaf.
The third is Ras El Hekma, and it points the other way. Selling 170 square kilometres of prime Mediterranean coast for $24 billion, plus the conversion of $11 billion of deposits, closed a financing gap no amount of reform would have closed in the time available. It also converted a liquidity problem into a land transfer, which is not a growth bargain but the classic move of a rentier state with one more asset to sell. Both readings are true at once, and the question is what Egypt does with the proceeds. If they fund the transition from a public-investment model to a private-investment one, Ras El Hekma is the bridge. If they fund the old model for another four years, it is the last of the rents.
The comparison that sharpens all this is Morocco, in Chapter 28, whose settlement is also closed at the top. But Morocco’s elite bet, from the Tangier Med port through the automotive and aerospace clusters, was explicitly on exports, a discipline imposed by foreign buyers rather than by domestic loyalty, and its within-and-between split in Section 1 shows the difference. Egypt’s investment went overwhelmingly into things that cannot be exported: roads, cities, apartments, a capital. Chapter 9’s test of the East Asian recipe asks whether support is conditioned on selling abroad. In Egypt it has mostly not been.
5. Geography and infrastructure
Egypt is a river, a canal and a great deal of sand, and every fact in this section follows from that. About 95 percent of Egyptians live along the Nile, in its delta and on the Suez Canal, on under 5 percent of the national territory. The country is therefore both extraordinarily concentrated and extraordinarily dependent: roughly 90 percent of its fresh water comes from a river that rises in other countries, of which about 57 percent arrives down the Blue Nile from Ethiopia.
The Nile and the dam. Egypt’s allocation under the 1959 agreement with Sudan is 55.5 billion cubic metres a year, fixed in a treaty signed when Egypt had roughly a quarter of its present population and to which the upstream states, including the one where most of the water originates, were not parties. The Grand Ethiopian Renaissance Dam was inaugurated on 9 September 2025 with 5.15 GW of installed capacity, the largest hydroelectric project in Africa. Chapter 29 tells this story from Addis Ababa, where the dam is an industrial-policy instrument financed largely by domestic bond subscription. From Cairo it is a hydrological one. The dam does not consume water; a reservoir, once filled, passes through what comes in. What it does is transfer control of the timing of the flow to a government upstream, and for a country whose agricultural system is calibrated to a known annual delivery, timing is most of what matters. The negotiations, running intermittently since 2011, have never produced a binding agreement on drought-year operating rules, which is the only clause that would bind. This is the clearest case in the book of two poles whose development strategies are in direct physical tension, and it is why Chapters 27 and 29 should be read together.
The canal and the cables. The Suez Canal is 193 kilometres long and was widened in 2015 by a second channel over part of its length, funded by a domestic bond issue Egyptians bought in extraordinary volume. The Red Sea crisis established what the widening did not: the constraint on canal revenue is not capacity but whether ships are willing to be there. Egypt’s least visible infrastructure is its most strategically valuable. Over 90 percent of Europe-to-Asia data traffic crosses the country, landing on the Red Sea coast, running about 160 kilometres overland and re-entering the sea in the Mediterranean; more than twenty international submarine cables are landed or transiting, and the European Union has described the corridor as the most critical bottleneck in Europe’s digital connectivity with Asia. The canal and the cables are one geographical fact expressed in two centuries’ technologies, and the second is worth more in the world of Chapter 1 than the first.
Rail and power. The high-speed network under construction is planned at 2,000 kilometres in three lines reaching close to 90 percent of the population; the first, awarded to a Siemens-led consortium in September 2021 for about $4.5 billion, is the Ain Sokhna to Marsa Matruh route marketed as a Suez Canal on rails. Whether a country with Egypt’s income per head should be building high-speed passenger rail is a fair question, and Section 6 asks it again of the capital. On power, Egypt sits at the junction of the North African and Levantine systems, with interconnections east and west and long-standing plans to sell into Europe; Chapter 14 carries the generation argument.
Ports and the zone. Ain Sokhna on the Red Sea, East Port Said on the Mediterranean, Alexandria and Damietta make up a port system straddling two seas twelve hours apart by ship, and the Growth Pole Map draws the canal itself as the corridor layer for this pole because there is no road or rail route that competes with it. The Suez Canal Economic Zone exists to monetize that adjacency: a 455 square-kilometre authority holding four industrial zones and six ports (SCZONE, 2025), offering the standard package of customs treatment and land. Its most publicized pipeline is green hydrogen and ammonia, with twelve framework agreements the authority values at about $64 billion, and the honest observation is that these are agreements, not plants. The zone’s own figure for direct and indirect employment is about 100,000 (Daily News Egypt, 2024): against a labour force the size of Egypt’s that is a rounding error, and against the ambition of turning a rent platform into a manufacturing one it is a start.
6. Megaprojects and cities
A caution on the city numbers, as in every pole chapter. The agglomeration database this book uses for urban population is not yet on the cards, so the Egyptian card carries no figure for Cairo at all. Every population figure in this chapter is national and from the UN projections: 116.5 million now, 161.6 million in 2050. Read this section for what is being built, not for how many people it houses.
The New Administrative Capital is the megaproject question of this chapter and one of the most consequential urban bets anywhere. Begun in 2016 about fifty kilometres east of Cairo, planned across roughly 700 square kilometres, designed for as many as 6.5 million residents and costed at around $58 billion, it now holds the parliament, the presidency, a central business district built largely with Chinese contractors and finance, and the relocated headquarters of more than thirty ministries and agencies. It also, as of 2026, holds on the order of a thousand resident families.
The case for it is better than its critics allow: Cairo is one of the densest large cities in the world, its administrative core cannot expand, and moving the government out releases some of the most valuable land in Africa. Governments from Brasília to Abuja have made the same argument, and the honest verdict on those cases takes decades. The case against is the one this book applies to every megaproject. A capital costed near a sixth of national output, built by the state, financed substantially abroad and generating no tradable output is the kind of investment that produced the balance-sheet position in Section 2, and it is the physical form of the settlement in Section 4.
Ras El Hekma is the counterpart, and the contrast is instructive. It is also a new city on virgin land, also enormous. The difference is who carries the risk: the Egyptian state holds a 35 percent stake and receives cash up front, while the Emirati developer carries construction and demand risk on the rest. Whatever one thinks about selling coastline, that is a better risk allocation than the New Capital’s, and the state learned it under duress.
The Suez Canal Economic Zone is the industrial bet, and Section 5 gave its shape. What belongs here is the question it poses to Chapter 15’s argument about African manufacturing. Egypt has the ingredients most African would-be manufacturers lack: a domestic market of 116.5 million, a port on each of two seas, a grid with spare capacity, an engineering labour force, and a customs regime it can set inside the fence. If export manufacturing at scale is going to happen anywhere on the continent outside Morocco and Gauteng, this is the site with the fewest excuses.
Housing is the part with no ribbon. Egypt has built social housing at scale and has also spent two decades demolishing and rehousing residents of the informal districts, the ashwa’iyyat, that absorbed Cairo’s growth from the 1970s onward. Chapter 22 carries the tenure argument; the connection here is that a city which pushes its low-wage workers to the desert edge while building offices fifty kilometres east has made the commute the binding constraint on who can work where.
7. Firm profiles
Elsewedy Electric
Elsewedy Electric began in 1938 as a Cairo wire producer and is now one of the largest energy-infrastructure groups in the Middle East and Africa, operating in more than fifty countries with over 20,000 employees across 31 production facilities. In the first nine months of 2025 it reported revenue of E£199.7 billion, about $4.22 billion, up 21 percent on the year, with net profit of about $298 million; wires, cables and accessories contributed 52 percent of revenue, and international sales were 73 percent of sales in the third quarter.
Three things make it the right firm to open with. It is a genuine exporter in a country whose growth has been overwhelmingly non-tradable, which makes it the exception that defines the rule in Section 4. It is vertically involved in almost everything else in this chapter, building substations and transmission, developing industrial parks inside the canal zone and working on the rail programme, so its order book is a fair proxy for the Egyptian state’s capital programme, which is a strength and a dependency at once. And it is family-controlled and listed, the governance form of Adly’s connected-large-firm tier: big enough to deal with the state on something like equal terms, and therefore in a position no medium-sized Egyptian firm can reach.
Fawry
Fawry is the payments network that shows the second term from inside a firm. In the 2025 financial year it reported revenue of E£8.65 billion, up 57 percent, net profit of E£2.89 billion, up 80 percent, and an EBITDA margin of 57.4 percent, with throughput of E£943.6 billion across its network, up 56.8 percent (Fawry, 2026). It reaches roughly 50 million users through about 320,000 service points, which are for the most part small shops and kiosks whose owners act as agents.
Fawry is the clearest demonstration that Egypt’s private sector can build a national-scale platform in a market the state and the banks had not organized, which is the counter-example any fair reading of Section 3 needs. It also shows what the identity’s middle term is made of in a middle-income African economy: a firm with 50 million users employs a few thousand people directly and supports several hundred thousand shopkeepers whose agency income is a supplement rather than a job, which is the difference the wage-employment overlay exists to catch. And margins of that order on transaction volume are a reminder that a payments business built on the rent of being the network everyone uses is still built on a rent. Chapter 16 argues that fintech is where African firms have gone furthest fastest; this is what it looks like when it works, and it is not the same thing as a factory.
8. What the experiments say
The jobs are the constraint, not the workers
Egypt and its neighbours have hosted an unusual number of randomized evaluations of active labour-market policy, and read together they say something uncomfortable and useful.
Groh, Krishnan, McKenzie and Vishwanath (2016b) worked with female community-college graduates in Jordan, an economy with Egypt’s problem in a smaller frame: educated young women, high measured unemployment, very low participation. Half were offered soft-skills training, twice as long as the regional norm and delivered by a well-regarded provider. Across three follow-up rounds it produced no significant employment effect. In a companion experiment on the same population, Groh, Krishnan, McKenzie and Vishwanath (2016a) gave out a wage-subsidy voucher a firm could redeem against a new hire. Employment rose by 38 percentage points while the voucher was live and the effect faded to insignificance once it expired. The authors’ reading is that the graduates’ productivity did not rise above a binding minimum wage, so the subsidy bought a temporary job rather than a foothold.
Elsayed and Roushdy (2017) ran the Egyptian version in the hardest setting available: 4,500 young women in thirty villages of rural Upper Egypt, offered business, vocational and life-skills training with follow-on business development support. The programme moved what a supply-side programme can move. Participants started and ran small enterprises at higher rates, and measures of agency and empowerment improved. What it did not do was put many of them into wage employment, because in rural Upper Egypt there is very little wage employment to enter.
The three results converge on Section 3. Train the worker and she is better trained; pay the employer and he hires while you are paying; neither creates a vacancy that was not going to exist. That is the signature of a demand-side constraint. It is also why this chapter puts appropriability, meaning the terms on which private firms can profitably expand, ahead of human capital in the diagnostic, and why the Egyptian debate about graduate quality, which is a real debate, is not the first-order one.
9. Climate exposure
Egypt’s climate exposure is unusually specific, and it is not a general story about a hot country getting hotter. It is about a delta subsiding into a rising sea and a water allocation that does not grow.
The delta. The Nile Delta is losing elevation and gaining salt at the same time. Measured relative sea-level rise on its low coastal margin runs at roughly 6.7 to 11.4 millimetres a year, of which global sea-level rise accounts for only about a quarter to a half; the rest is subsidence, driven by groundwater extraction and by the sediment that no longer arrives because it settles behind the Aswan High Dam and, now, behind the dams upstream (Stanley and Clemente, 2017). The same infrastructure that regulates the flow starves the delta of the silt that kept it above the Mediterranean. Salinization has already degraded a meaningful share of the country’s most fertile land. The delta is where the food is, where the people are, and where the industry is.
The water. Egypt’s Nile allocation is fixed at 55.5 billion cubic metres a year and its population is not. Water availability per head has fallen below the 500 cubic metres a year that hydrologists conventionally call absolute scarcity, from roughly a thousand in the early 1990s, and on the UN’s projections the denominator rises from 116.5 million to 161.6 million by 2050. No plausible combination of desalination, reuse and irrigation efficiency closes that arithmetic on its own. This is the one place in the book where a climate paragraph is about an existential constraint rather than a cost to be managed, and it explains a great deal of Egyptian foreign policy that otherwise looks disproportionate.
Heat. Rising summer temperatures raise cooling demand faster than income grows, in a system already short of the gas that fires it, which is how the power rationing of 2023 and 2024 happened. The climate channel in Egypt runs through the balance of payments as much as through the thermometer, and Chapter 34 carries the finance side of it.
10. Data quality
Egypt has one of the better statistical systems on the continent and the card says so. The census is CAPMAS’s fourteenth, taken in 2017; the labour-force survey is the agency’s quarterly instrument, with 2023 the latest catalogued annual round; the Statistical Performance Indicators score is 78.1, fourth of the 53 cards carrying it; Egypt is one of only eight African countries subscribed to the Fund’s higher dissemination standard rather than the enhanced general one; and the confidence flag is high. Morocco’s card carries a 2024 census and a 2024 survey at a score of 73.1, and South Africa’s a 2022 census and a 2025 survey at 81.3. Of the three term-three poles, Egypt’s census is the oldest and its survey record the most regular.
One field is empty and its emptiness is informative. The card records no GDP rebasing year for Egypt. The planning ministry reports that the national-accounts base year has moved from 2016/17 to 2021/22, but the date on which that revision was published could not be pinned to a source this book is willing to cite, and a rebasing year must be sourced rather than inferred. A decade of output-per-worker growth measured across a base-year change whose date is uncertain carries more measurement risk than Table 27.1’s tidy gap of five hundredths of a point implies.
Two further cautions. The second and third terms are ILO modelled series, not survey counts, and the modelling for a country with Egypt’s participation gap is doing a great deal of work: the 15.6 percent female employment rate is the model’s best estimate of a quantity household surveys themselves measure with difficulty, since much of women’s productive work in rural Egypt is unpaid family labour whose classification is a definitional choice. And the balance-sheet section is part narrative because the card is part filled. It carries remittances, foreign direct investment and aid, the creditor lines, and the five-year debt-service total: $65.8 billion of publicly guaranteed principal and interest falls due between 2026 and 2030, the largest such figure on the continent and 18.1 percent of a year’s output. What it does not carry is the market’s opinion or the shape of the schedule: ratings are proprietary and the outstanding bond stock has no register the book can use, so the finer income figures in Section 2 are still sourced one by one to institutions rather than read off a card.
What the numbers here can bear: the identity decomposition for Egypt is among the most solid in the book, the ranking of Egypt against Morocco and South Africa on all three terms is robust, and the creditor composition is as good as the international debt statistics are. What they cannot bear: a precise Egyptian female employment rate, a metropolitan population for Cairo, an income statement for the rent platform built from card fields, or a within-and-between split that describes the decade after 2018.
11. Data sources
- UN World Population Prospects 2024, medium variant: population levels and projections, median age, fertility, dependency, and the working-age series behind term one. Ages 15 to 64, national rather than metropolitan.
- ILOSTAT modelled estimates, November 2025: terms two and three, and the wage-employment, non-agricultural, sex-disaggregated, youth-inactivity and informality overlays. Modelled rather than surveyed.
- Groningen Growth and Development Centre, Economic Transformation Database: the within-and-between split of term three, 2008 to 2018.
- IMF World Economic Outlook, April 2026: output levels, output per head, observed growth and the forecast.
- World Bank International Debt Statistics, 2025 release: the external debt stock and its creditor composition, in which bilateral lending is not split by creditor country.
- Boston University Global Development Policy Center, Chinese Loans to Africa database: the Chinese column, a cumulative flow of commitments rather than a stock.
- World Bank Statistical Performance Indicators, the IMF’s dissemination-standards register and CAPMAS: the data-quality table, the 2017 census and the labour-force survey record (Central Agency for Public Mobilization and Statistics, 2017).
- Suez Canal Authority: transits, tonnage and receipts. Central Bank of Egypt: remittances, reserves and external debt service.
- IMF country reports on the Arab Republic of Egypt: the programme, the reviews, the state-ownership commitments and the enterprise counts in Section 3.
- Company reports: Elsewedy Electric and Fawry. Sayigh (2019) and Adly (2020): the military economy and the structure of the private sector.
12. Exercises
Discussion questions
Egypt’s output per worker grew at 2.26 percent a year over the decade with an employment ratio that did not move; Morocco’s grew at 1.88 percent with an employment ratio falling at 0.45 percent a year. Both are called term-three poles here. Using the within-and-between split rather than a list of policies, argue that these are two different economies wearing one label, and name the observation, available before 2030, that would show which has the more durable engine.
Section 3 argues that the binding constraint is appropriability, meaning the terms on which private firms compete with the state and the army, rather than infrastructure, finance or skills. Construct the strongest case for a different branch. What would have to be true for human capital to bind first in an economy with Egypt’s wage-employment share, and how would you test it against the evidence in Section 8?
Egypt sold the development rights to 170 square kilometres of coastline to a foreign sovereign fund and used the proceeds to stabilize its currency. Argue for one of two readings: that this was a government converting a dead asset into a working economy, or that it was a rentier state finding one more rent. Then say what Egypt would have to do with the next such transaction for your reading to be falsified.
Try it
Open the three term-three poles side by side: Egypt, Morocco and South Africa, in that order. Read down the identity block, where the three columns share one scale, and then down the overlays. Write one paragraph on a single question: all three of these economies live or die on the third term rather than the first, so what distinguishes a term-three economy that is transforming from one that is merely getting more capital-intensive? Then turn on the confidence toggle on the Growth Pole Map and say whether anything you concluded depends on a low-confidence figure.
Data exercise
Download all fifty-four cards from the country cards page on this site, as cards.csv or cards.json, with these fields: identity.working_age_pop_growth, identity.employment_to_wa_growth, identity.output_per_worker_growth, identity.gdp_growth_implied, identity.gdp_growth_observed, overlays.wage_employment_share, overlays.output_per_worker_within and overlays.output_per_worker_between. Then do four things. First, reproduce Table 27.1 and confirm that Egypt’s three terms sum to implied growth and that implied growth is within a tenth of a point of observed. Second, compute the median of each term across the cards carrying it, reproduce Table 27.2, and say why the count is 54 for one term and 53 for the others. Third, take the 21 cards that carry the within-and-between split, rank them by the between-sector component, and say where Egypt sits and how the ranking changes on the within component. Fourth, define a term-three economy as one whose output-per-worker growth exceeds its working-age population growth, count how many of the 54 qualify, and ask what the group has in common besides the definition. Treat nulls as missing, never as zeros: a country with no within-and-between split is one the database does not cover, not one with no structural change.