17. Digital and Telecoms
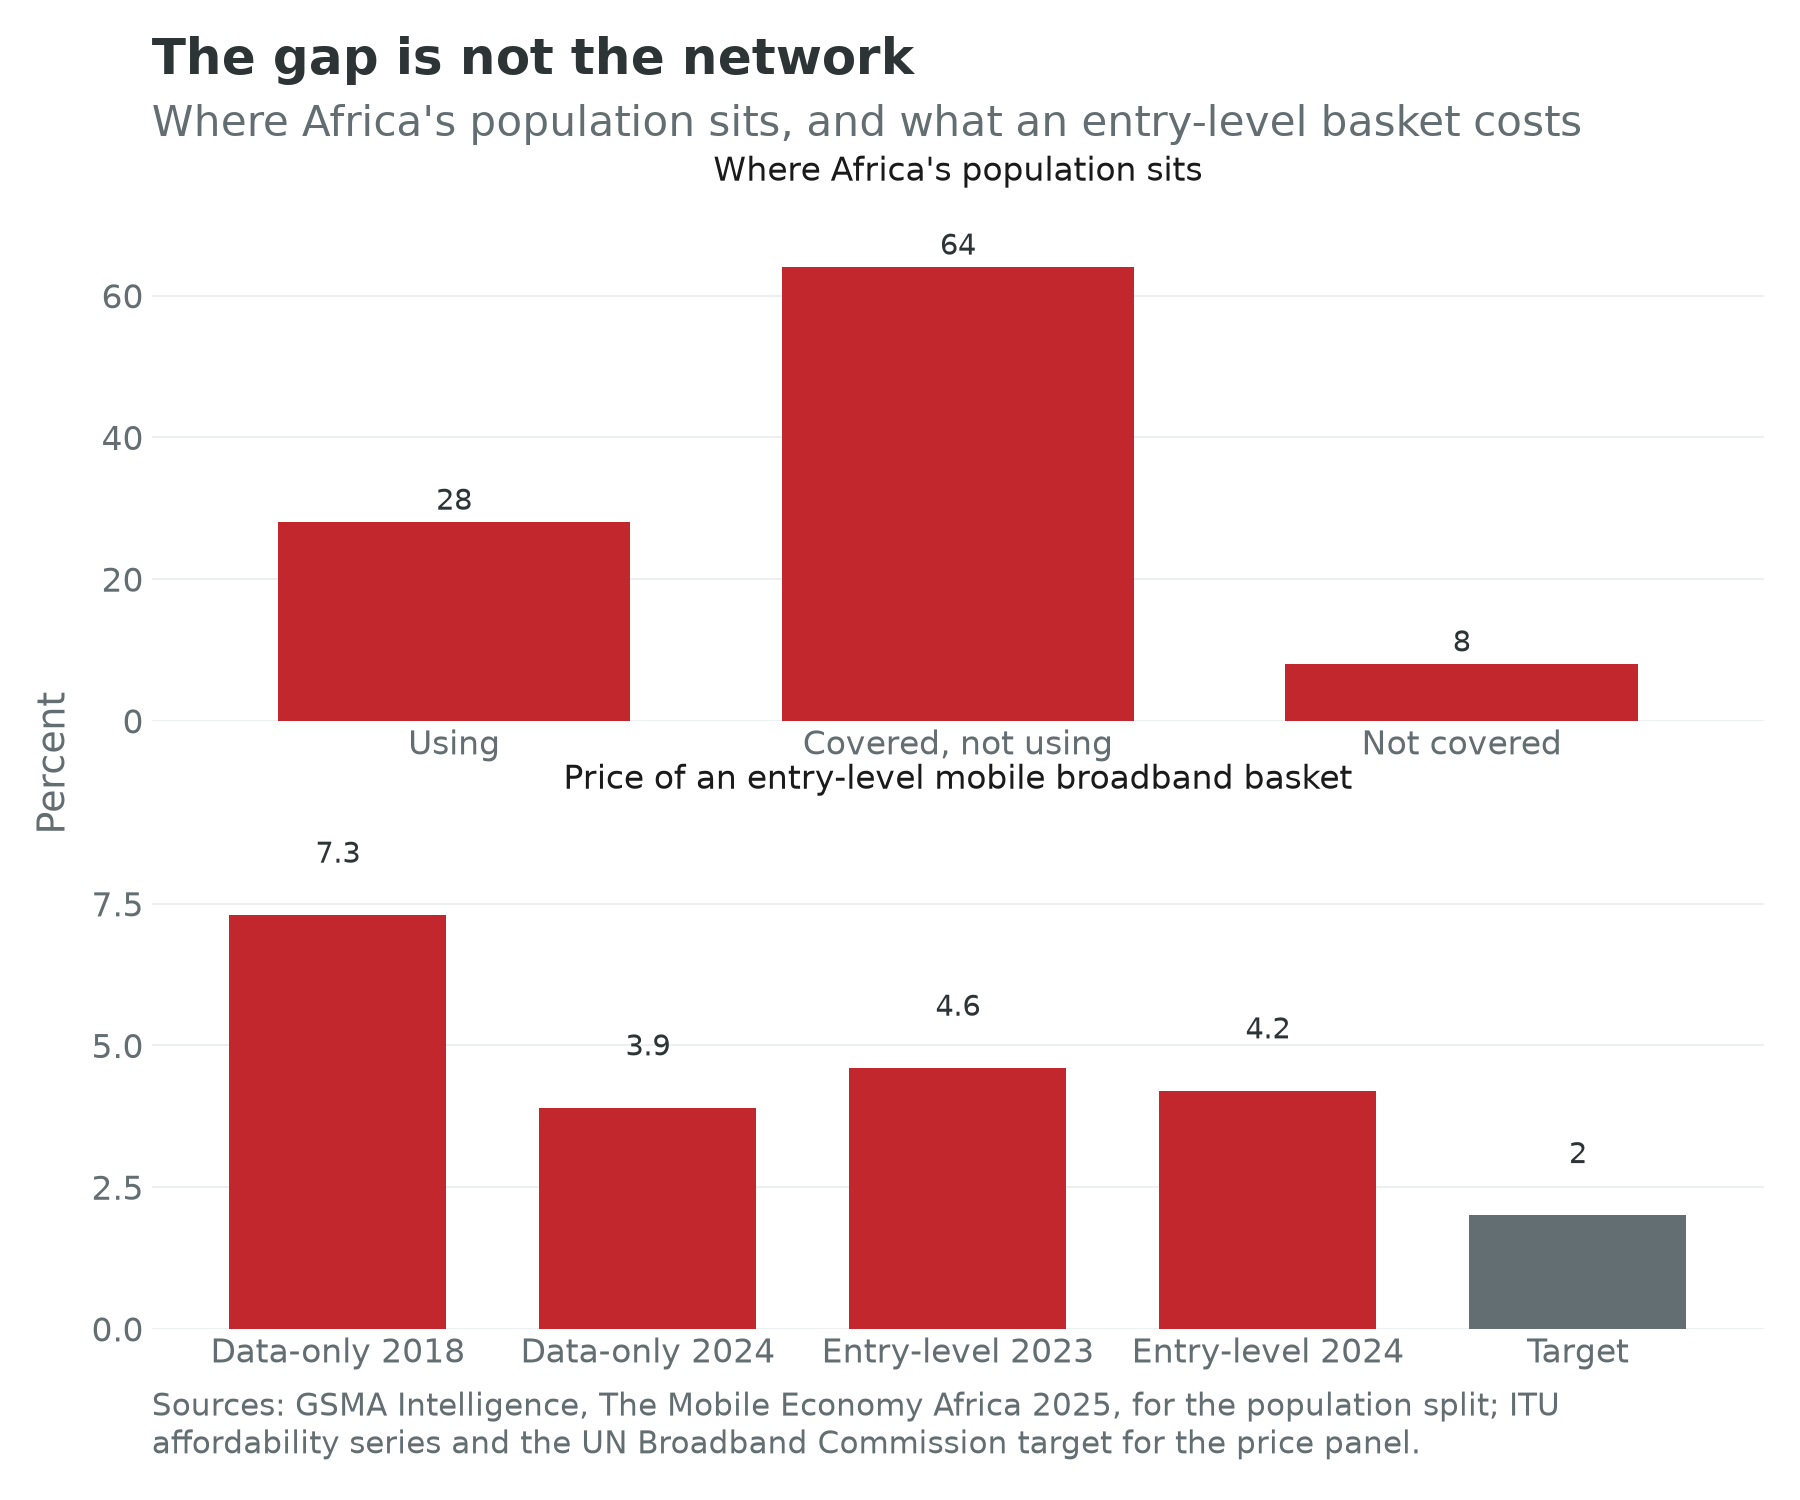
Thirty-eight percent of Africans used the internet in 2025, the lowest share of any region the International Telecommunication Union reports and a little over half the world’s 68 percent (ITU, 2025). The number that matters more sits inside it. Most Africans who live inside a mobile broadband footprint do not use it: 416 million people were mobile internet users in 2025, about 28 percent of the population, while 960 million, some 64 percent, lived under coverage they did not buy (GSMA, 2025). The infrastructure question was largely settled in the decade after 2009. What is left is a price question and a device question, and those are harder, because a regulator can licence a tower and cannot licence a wage.
Learning objectives
After reading this chapter, you should be able to:
- Say where telecoms sits in the identity, and why its effect on employment has to be looked for in other people’s firms.
- Describe how a network is paid for: spectrum and licences, towers and the sale-and-leaseback trade, backhaul, handsets, and the price of a gigabyte.
- Explain what the arrival of the submarine cables did to African employment, how that was measured, and what the design cannot tell you.
- Distinguish coverage from use, and both from the statistics that report them, and say which gap a policy instrument can move.
- State what the sector becomes in each of the book’s two worlds, and why the compute question makes this an electricity chapter in disguise.
Prior work: the mobile-money material and the Nairobi-against-Lagos agglomeration comparison are developed at length in the companion volume, The New Regional Economics, chapters 13 and 14 (Wilse-Samson, 2026), and cited here rather than repeated.
1. Overview
Telecommunications is the second of the book’s enabling sectors, and it has the cleanest identification behind it of anything in Part III. Hjort and Poulsen (2019) matched the arrival of submarine cables to employment across African localities and found large employment gains driven mainly by higher-skilled occupations, though less-educated workers gained too, with firm entry, productivity and exporting behind them. It is one of very few places in African development where the causal chain from an infrastructure investment to a job has been nailed down rather than asserted, and Section 10 gives it the treatment it deserves.
The sector itself employs very few people. A mobile operator serving forty million customers runs on a payroll in the low thousands of engineers, finance staff and retail managers, which is not the work the identity’s second term is starved of. Its employment footprint is almost entirely indirect: airtime resellers, the agent networks Chapter 16 counts, handset repairers, delivery riders, and the small firms whose costs it lowers. This is a term-three sector that moves term two only through other people’s businesses, and that indirection is why the evidence in Section 10 had to be so carefully constructed.
| Identity term | What this sector does to it | Value |
|---|---|---|
| One: working-age population | Nothing | Median 2.89 percent a year across the fifty-four |
| Two: employment-to-working-age ratio | Small directly; measurable indirectly where cables landed | Median minus 0.15 percent a year across fifty-three |
| Three: output per worker | The enabling term, and the one the cable evidence speaks to | Median 0.74 percent a year across fifty-three |
Table 17.1. Annual growth rates over 2014 to 2024, taken column by column across the cards that carry each series. Sources: UN World Population Prospects 2024 for term one; ILOSTAT modelled estimates, November 2025, for terms two and three; via the country cards.
Table 17.2 puts the ten markets this chapter follows against that distribution. Between them they hold 738.9 million people, 48.8 percent of Africa’s population, and produce $1,777.1 billion, 56.6 percent of its output.
| Country | Term one | Term two | Term three | Implied | Observed | Wage employment (percent) | Non-agricultural employment (percent) | Last labour-force survey | Confidence |
|---|---|---|---|---|---|---|---|---|---|
| Nigeria | 2.90 | 0.29 | -1.94 | 1.25 | 1.20 | 13.6 | 65.9 | 2023 | low |
| Ethiopia | 3.46 | -1.58 | 5.91 | 7.79 | 7.92 | 15.4 | 39.0 | 2021 | low |
| Egypt | 1.96 | 0.07 | 2.26 | 4.29 | 4.33 | 72.9 | 82.0 | 2023 | high |
| South Africa | 1.61 | -0.45 | -0.48 | 0.68 | 0.67 | 82.7 | 94.6 | 2025 | high |
| Kenya | 2.94 | -1.17 | 2.84 | 4.61 | 4.62 | 35.1 | 53.5 | 2024 | high |
| Morocco | 1.10 | -0.45 | 1.88 | 2.53 | 2.54 | 59.6 | 71.7 | 2024 | high |
| Ghana | 2.52 | -1.56 | 3.48 | 4.44 | 4.45 | 32.2 | 64.8 | 2023 | medium |
| Côte d’Ivoire | 2.88 | 0.11 | 2.90 | 5.89 | 6.16 | 28.7 | 53.7 | 2019 | medium |
| Senegal | 3.51 | 1.50 | 0.27 | 5.27 | 5.30 | 35.3 | 69.4 | 2024 | high |
| Rwanda | 2.83 | 0.65 | 3.26 | 6.74 | 6.72 | 59.1 | 63.5 | 2024 | high |
| Continental median | 2.89 | -0.15 | 0.74 | 2.91 | 31.0 | 59.0 |
Table 17.2. The ten markets this chapter follows, ordered by population. The first five columns are annual growth rates in percentage points over 2014 to 2024; the next two are shares of employment; the median row is taken column by column and is not a country. Sources: UN World Population Prospects 2024, ILOSTAT modelled estimates (November 2025), the IMF World Economic Outlook (April 2026) and the book’s data-quality table, via the country cards.
Read the table with Section 10 in mind and one thing stands out. The two countries with the deepest recent expansion of connectivity, Kenya and Ghana, post two of the sharpest declines in the employment ratio on the continent, minus 1.17 and minus 1.56 percent a year, alongside output-per-worker growth of 2.84 and 3.48 percent against a continental median of 0.74. That is the shape of a term-three sector doing its work in an economy whose second term is going the other way, and it is the configuration the cable evidence has to be reconciled with rather than the one it disproves.
The table also warns about what can be known. Nigeria and Ethiopia, the two largest markets by population, both carry a low confidence flag, and Côte d’Ivoire’s last labour-force survey was in 2019. Six of the ten carry a high flag, which is better than the continental average and not good enough to support a claim about the other four.
The sector in two worlds
Chapter 1 set out the assumption underneath the identity and the world in which it fails, one in which the frontier of production is a stock of machines and energy rather than of workers. No sector here straddles the two as awkwardly as this one, because this is the sector that builds the second world’s plumbing.
In the labour-abundant world, connectivity is what Section 10 says it is: a general-purpose input that lets firms enter, export and hire, with the gains skewed towards the educated and enough spillover to reach the less educated. The policy programme then follows from Figure 17.3. Coverage is nearly done; the work is the price of a gigabyte, the price of a handset, and the literacy to use both.
In the labour-redundant world the meaning inverts. A data centre in Ekurhuleni or on the Mombasa road is a productive asset that employs almost nobody, and the electricity it consumes is electricity a smelter or a hospital does not. The business-process and content-moderation industry that Nairobi, Accra, Lagos and Cairo built over the last decade is the most exposed formal employment on the continent, exposed to a machine whose training data those same graduates labelled. Chapter 10 states the arithmetic; the industrial version is that Africa’s most successful entry into the global services economy was into exactly the tasks that went first.
The country cards carry a line for generative-AI exposure, the share of employment in the occupations the international index places in the automation band. It is empty on every card, because the series has not been attached, so this chapter uses the published regional and income-group estimates instead and says so wherever it does. They are unflattering in an unexpected direction. Occupations with automation potential accounted for a very small share of employment in low-income countries against a much larger share in high-income ones, and the refined 2025 index puts about one worker in four worldwide in an occupation with some exposure, the gradient rising steeply with income (Gmyrek, Berg and Bescond, 2023; ILO, 2025). Africa is the least exposed place on earth to the first wave, because most Africans work informally in agriculture and petty trade. Informality is protective for a decade, and the protection consists of being too poor to be worth automating.
2. How the industry works
The licence, the spectrum and the regulator
A mobile network is a licence before it is a mast. A national regulator, in most African jurisdictions a converged authority reporting to a ministry and dependent on it for its budget, issues a licence with a term, a coverage obligation and a fee, and separately assigns spectrum. Spectrum is the scarce input, and how it is priced is one of the sharpest tests of whether a state is running a growth bargain or a revenue bargain. A finance ministry facing a deficit sees an auction as a windfall; an operator that pays a high fee recovers it in tariffs, which lands on the affordability numbers in Figure 17.3 two years later. The state can take the rent up front in cash or later in coverage and price, and it cannot take both. Licence renewal is the other fiscal event, because a fixed term means periodic renegotiation in which the state holds an incumbent’s whole business hostage, in an atmosphere closer to a tax settlement than a technical process. That is how telecoms became, in several countries, both a major source of non-oil revenue and the most politically exposed private industry there is.
Towers, and the trade that is being reversed
The physical network splits into an active layer, the radios and the core, and a passive layer, the tower, the shelter, the generator, the batteries and the fence. From about 2010 the operators sold the passive layer. A tower company bought the sites for cash, and the operator signed back a lease of ten to fifteen years, usually denominated in dollars or indexed to them, with escalators tied to inflation and diesel. The operator got a balance sheet freed for spectrum and radios; the tower company got a long contracted revenue stream and the option to sell space on the same tower to a second and third operator. The ratio of tenants to towers is the whole of its economics: Helios Towers finished 2025 with 14,746 sites and 31,944 tenants, a ratio of 2.17 against 2.05 a year earlier, on revenue of $854.1 million (Helios Towers, 2026).
What a tower company in Africa actually does on a Tuesday is buy diesel. Where the grid is unreliable, and Chapter 14 explains why that is most of the continent, a tower runs on a generator with batteries and increasingly a solar array, and the business is fuel logistics, theft prevention and maintenance across thousands of unmanned rural sites. The tower company is a power company that happens to own steel.
The trade is now being reversed at the top of the market. In February 2026 MTN Group agreed to acquire IHS Holding, the largest tower company on the continent, for $8.50 a share, an enterprise value of about $6.2 billion, subject to approvals (IHS Towers, 2026). MTN is buying back, at a price set by a public market, infrastructure it sold a decade earlier to fund the expansion that made the towers valuable. Whether that is a correction or the ordinary cycle of an industry that leases when capital is dear and owns when it is cheap is a question this chapter puts and does not answer.
The operator’s economics
An African mobile operator sells prepaid airtime in very small increments through a distribution chain ending in a kiosk. Average revenue per user is a few dollars a month, so it is a volume business with a very high fixed cost and a very low marginal one, the classic recipe for scale economies and for regulatory attention. Data has now overtaken voice as the growth engine: MTN Group passed 307 million subscribers in 2025 and lifted service revenue 22.9 percent to 218.5 billion rand (R), about $13 billion, with data traffic up 27 percent and average consumption reaching 12.5 gigabytes a month (MTN Group, 2026). Airtel Africa reached 183.5 million customers in the year to March 2026, of whom 84.2 million took data, on revenue of $6,415 million (Airtel Africa, 2026). Orange reported 179 million customers across seventeen African markets and Jordan (Orange, 2026).
Three features matter for the rest of the book. First, currency: an operator earns naira, cedis and shillings, pays for equipment, tower leases and debt in hard currency, and reports in a third currency, so a devaluation turns a strong operating year into a weak reported one, and did, repeatedly, after 2023. Chapter 8 supplies the machinery. Second, the sector is capital-hungry in exactly the way Chapter 21 says African balance sheets are least able to fund, so the marginal tower in a thin rural market is financed by a development bank, an equipment vendor’s export credit or not at all. Third, mobile money is now a material share of revenue rather than a curiosity: MTN’s fintech arm reached 69.5 million monthly active mobile-money customers and 23.3 billion transactions worth $500.3 billion in constant-currency terms (MTN Group, 2026). Chapter 16 owns that business and Chapter 26 the Kenyan case that made it famous; the point here is that the largest financial network on the continent is a by-product of selling airtime.
The middle mile, and the satellite that goes round it
The submarine cables solved the long haul. They did not solve the middle mile, the terrestrial fibre carrying capacity from a coastal landing station to an inland city and from a city to a tower. It is the least glamorous and most binding piece of the chain, and it is why a landlocked capital can sit beside abundant international capacity and still pay several times the coastal price for a megabit. Liquid Intelligent Technologies, a business of the pan-African group Cassava Technologies, reported 108,868 kilometres of fibre at the end of February 2025 and now describes more than 110,000 kilometres across twenty-five countries (Liquid Intelligent Technologies, 2025). That is the largest independent terrestrial network on the continent, and a fraction of what thirty million square kilometres require. A trench costs the same whether it carries one customer or a thousand, so the middle mile has the strongest case for public co-investment and the weakest record of getting it.
Low-earth-orbit satellite broadband arrived as a solution to exactly the rural-density problem the terrestrial industry could not price, and as a jurisdictional problem. Starlink is live in more than twenty-five African markets, licensed country by country, and not in South Africa, because the regulator’s ownership rules require local equity the operator declines to sell; a ministerial policy direction in late 2025 asked the regulator to consider equity-equivalent investment instead. Namibia’s regulator refused a licence in March 2026 and dismissed the appeals in June, on a 51 percent local-ownership rule; Cameroon banned the service in 2024 on data-sovereignty grounds (Independent Communications Authority of South Africa, 2026; Communications Regulatory Authority of Namibia, 2026). The fight is not about satellites. It is about whether a state can impose ownership, taxation and lawful-interception obligations on a service whose infrastructure is in orbit and whose customer relationship is a credit card, and every regulator whose authority was built on landing rights is discovering that the new entrant needs none.
The app economy, the platforms and the state’s own platform
On top of the network sits an application layer mostly not built by the operators. E-commerce has been the hardest to make work: Jumia, the continent’s most prominent platform, reported 2025 revenue of $188.9 million, up 13 percent, on gross merchandise value of $818.6 million and an operating loss of $63.2 million (Jumia, 2026). Fifteen years in, the largest e-commerce firm in a market of 1.5 billion people has revenue smaller than a mid-sized European retailer’s and has never made a profit, for reasons Chapter 19 owns: addressing, roads, cash on delivery, returns and the thin logistics layer underneath. Ride-hailing and delivery worked better, because the asset is the driver’s motorcycle and the platform sells only the match. Bolt, Uber and Glovo run in most large African cities, and their workforce is the largest visible category of platform work on the continent. It is also, on Chapter 6’s definitions, informal self-employment with an algorithm attached: the rider owns the machine, carries the fuel and accident risk, and appears in the statistics, if at all, as own-account work.
The most consequential platform layer is the state’s. Nigeria’s National Identification Number passed 130 million enrolments by mid-2026 against a target of 180 million by that year’s end; Kenya has issued the maisha namba since 2023, successor to its second-generation identity card and to the earlier huduma namba; Ethiopia’s fayda programme had registered over nine million residents by 2024 and has been made compulsory for banking (National Identity Management Commission, 2026; National ID Program Ethiopia, 2025). India’s Aadhaar is the case every one of these ministries cites, and it is worth being precise about what it establishes. Muralidharan, Niehaus and Sukhtankar (2016) randomised the rollout of biometric smartcards for wage and pension payments across Andhra Pradesh and found faster, more predictable and less corrupt payments, with leakage falling sharply and no loss of access. That is a strong result for payments delivered on an identity rail. It is not a result about identity systems in general, and says nothing about using the same rail to condition access to a SIM card, a bank account or a school place, which is what most African implementations have done first.
Data centres, cloud regions and the power bill
Compute has to sit somewhere, and until recently it did not sit in Africa. Africa’s five largest markets had about 0.4 gigawatts of data-centre capacity in 2025, with projections of 1.5 to 2.2 gigawatts by 2030 (McKinsey, 2025). The hyperscale cloud regions arrived in a rush and then stopped: Microsoft opened Azure regions in Johannesburg and Cape Town in 2019, Amazon its Cape Town region in 2020, Oracle Johannesburg in 2022 and Google in January 2024. There is none anywhere else, so an application serving Lagos or Nairobi is served from Johannesburg, from Europe, or from a local colocation hall.
Data centres are electricity businesses with servers attached, and Chapter 14 owns the electricity. The ordering is what matters: a hyperscaler chooses grid reliability first, latency second and tax third, which is why the map of African compute is a map of the two or three grids that work. A continent with the world’s best solar resource and a chronic shortage of firm power is being asked to host an industry whose defining input is firm power.
3. Industry structure
The sector’s ownership is best read as seven layers, each with a different owner and a different cost of capital.
The operators are the visible layer and the concentrated one. Four groups dominate: MTN, headquartered in Johannesburg; Airtel Africa, a London-listed subsidiary of an Indian parent; Orange, whose African and Middle Eastern business is now its growth engine; and Vodacom, majority-owned by Vodafone, which also controls Safaricom in Kenya. Beside them sit national incumbents, some still state-owned, of which Ethio Telecom is the largest with more than 78 million subscribers; Ethiopia opened the market in 2021, licensed a Safaricom-led consortium whose venture Chapter 29 profiles, and floated 10 percent of the incumbent between October 2024 and January 2025 (Ethio Telecom, 2025). Most markets have three or four operators, enough for price competition and not enough for the margin compression that would fund rural coverage.
The tower companies own the passive infrastructure: IHS Towers, with 37,590 towers and 54,874 tenants at the end of 2025 and 16,395 structures in Nigeria alone, is the largest, with Helios Towers and American Tower behind it (IHS Towers, 2026). Their capital is overwhelmingly foreign and their revenue contracted and largely dollar-linked, so they behave most like a bond.
The cable consortia own the international capacity, and the newest and largest belong to content companies. 2Africa, the largest cable system in the world, runs 45,000 kilometres, lands at 46 stations in 33 countries and was completed in its core form in November 2025, with a design capacity of up to 180 terabits a second on the main trunk (Meta, 2025). Google owns Equiano on the west coast. The significance is not the capacity, which is abundant, but that the buyers of African international bandwidth have become its owners, which changes who sets the wholesale price.
The hyperscalers own the cloud regions and, increasingly, the cables. The local data-centre firms own the colocation layer: Teraco in South Africa, Africa Data Centres across the Cassava footprint, Raxio in Uganda, Ethiopia, Mozambique, the Democratic Republic of the Congo, Côte d’Ivoire and Angola, Open Access Data Centres and Rack Centre in Nigeria, N+ONE in Morocco. The internet service providers and enterprise carriers sit between them, Liquid the largest. The state is present at every layer, as licensor, spectrum owner, frequent shareholder, largest single customer, and the party that can switch the whole thing off.
4. Geographic distribution
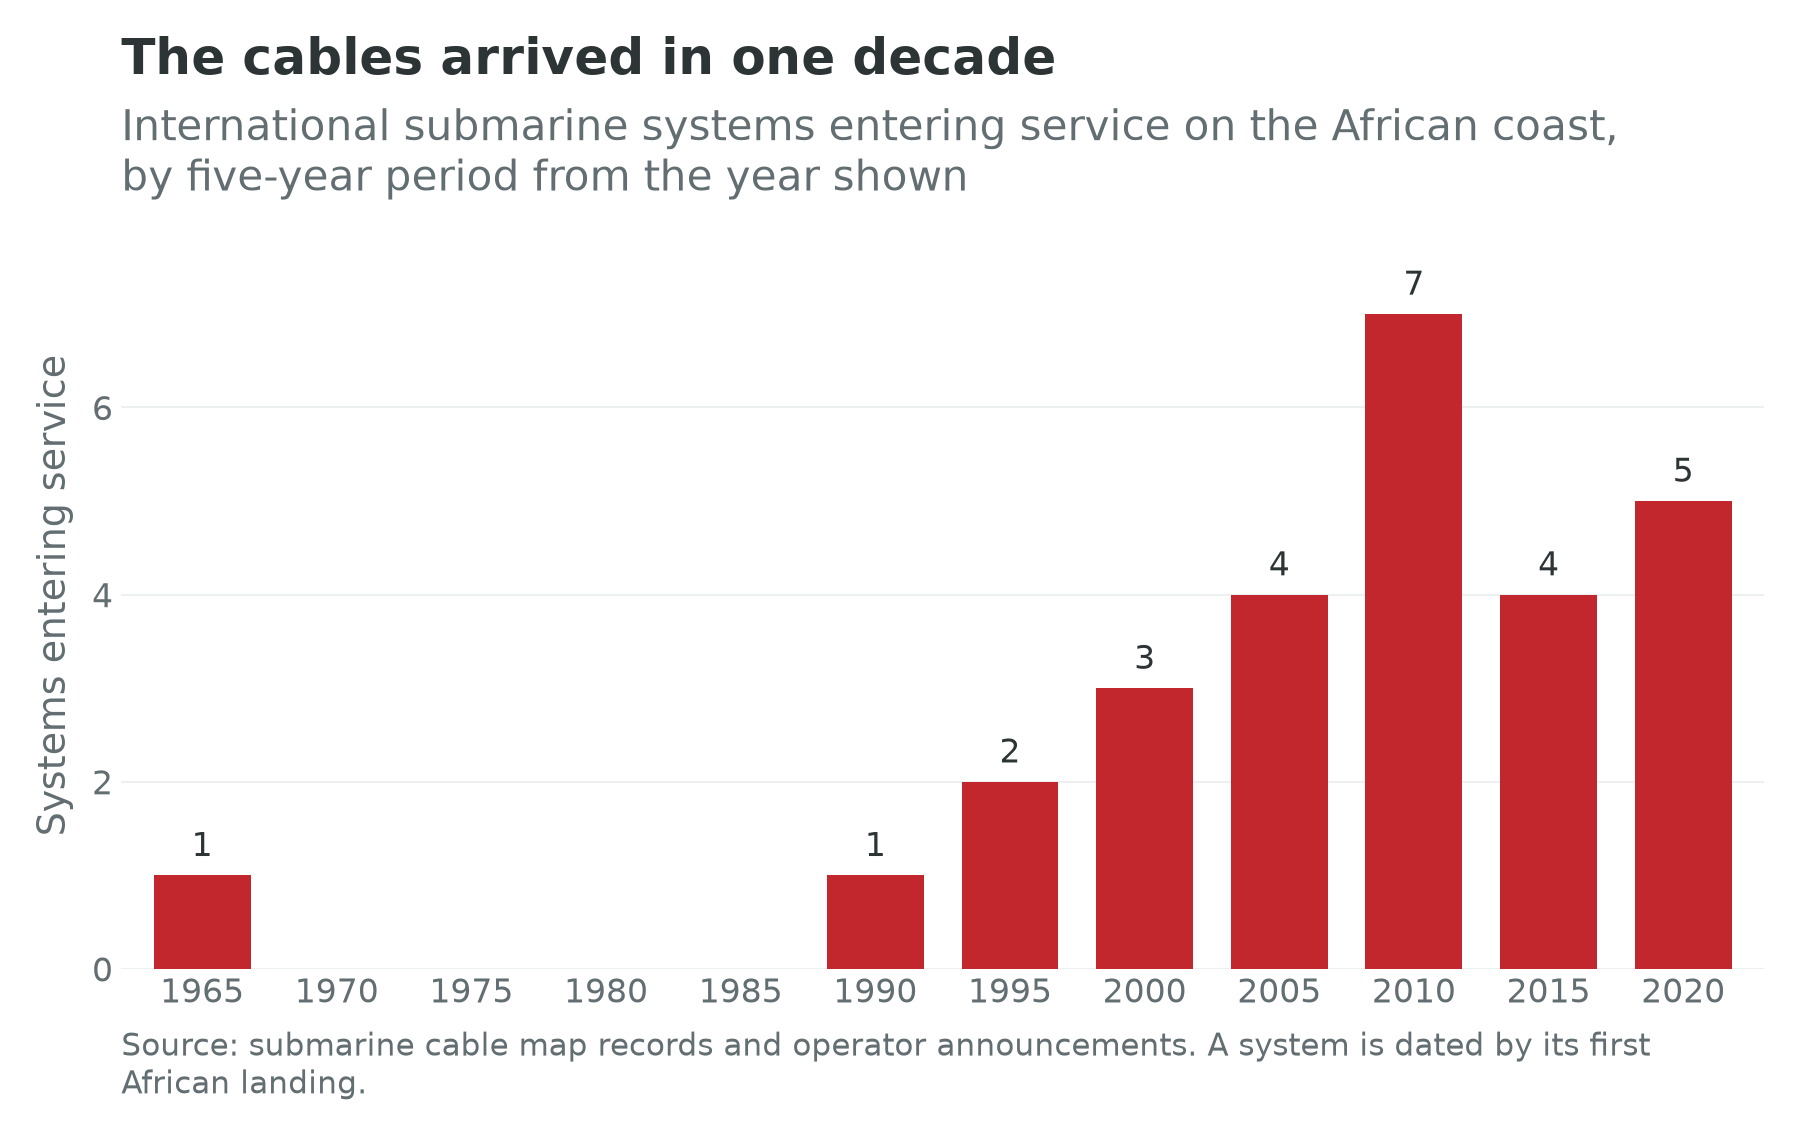
The physical geography of African connectivity is a coastline. Twenty-seven international submarine systems have landed on the continent since the first in 1968, sixteen of them after 2010 (TeleGeography, 2026). Figure 17.2 shows the shape of that arrival, not a steady build but a rush concentrated between 2009 and 2014, when the East African coast went from no fibre at all to four systems in five years. That rush is the variation Hjort and Poulsen (2019) exploited: the timing of a landing was driven by consortium financing and vessel schedules rather than by the prospects of the district it landed in.
Above the landing stations, the map is a map of the poles. The chapter’s site file, which feeds the Growth Pole Map’s cable layer, records twenty-seven landing localities and thirteen major data centres, and the two lists barely overlap: landings are spread evenly around the coast because cable routes are geography, while data centres cluster in Johannesburg, Cape Town, Nairobi, Lagos, Casablanca and Cairo because compute follows power and customers. Chapter 25 owns Gauteng, which holds more computing capacity than the rest of the continent combined; Chapter 26 the Nairobi and Mombasa axis, where a landing station, several subsea systems and geothermal baseload coincide; Chapter 24 notes that the cables are the Lagos to Abidjan corridor’s only genuinely functioning network; Chapter 27 owns the Egyptian land crossing.
The inland picture is the inverse. A landlocked country buys capacity from a coastal neighbour’s landing station, over a terrestrial route it does not control, in a currency it does not print, and that wholesale price is the best single predictor of retail data prices on the continent. It is the geography of the affordability panel in Figure 17.3.
Two events in 2024 showed what the map means when it breaks. On 24 February three systems were cut in the Red Sea, the Seacom and TGN-Eurasia system, the Europe India Gateway and Asia Africa Europe-1, most probably by the dragging anchor of an abandoned bulk carrier, and one was not restored for close to five months. On 14 March four systems failed almost simultaneously off Abidjan, the West Africa Cable System, Africa Coast to Europe, MainOne and SAT-3, attributed to an underwater landslide; ten countries lost capacity, regional traffic fell by more than half at the peak, and repairs took about five weeks (Internet Society, 2024). Redundancy on paper is not redundancy in practice when the alternative routes share a chokepoint, a repair ship or a landing station, and Africa’s international connectivity has three such chokepoints: the Red Sea, the Egyptian land crossing and the slope off Abidjan.
5. Workforce
The direct workforce is small, formal, urban, comparatively well paid and disproportionately male in its technical grades. A group employing tens of thousands across a continent is a large employer by the standards of the sector and a rounding error in the identity’s second term.
The indirect workforce is very large and almost entirely uncounted, in four visible layers: distribution, meaning the agents and airtime resellers who convert cash into electronic value, of whom Safaricom’s Kenyan network alone numbers in the hundreds of thousands at a scale Chapter 16 reports; repair and the informal handset trade, a jua kali activity in the exact sense Chapter 6 defines; the platform workforce of riders and drivers; and the outsourcing and annotation industry. Every one of those is own-account or short-contract work, which puts them on the wrong side of the overlay that carries this book’s jobs argument. Chapter 10 shows why that matters: the wage-employment share correlates with income at 0.75 and with a decade of productivity growth at about zero. Kenya, where the agent economy is deepest, has a wage-employment share of 35.1 percent against a continental median of 31.0; Nigeria, the largest market on the continent, has 13.6 percent.
There is one exception, the outsourcing industry, which produces contracts, payslips and payroll taxes. Kenya, Ghana, Egypt, Morocco and South Africa each host contact-centre and back-office industries selling into Europe and North America, Egypt’s the largest at a scale Chapter 27 reports; the Kenyan variant went further, into what the trade calls impact sourcing, hiring from low-income communities for work that would otherwise be done elsewhere. Its newest layer is data annotation for machine learning, the sharpest instance in this book of the two worlds meeting in one job description: a worker in Nairobi or Gulu draws boxes around pedestrians or ranks two model outputs for helpfulness, paid by the task, in work that needs literacy and a laptop rather than a degree, and it is the only part of the frontier AI supply chain employing Africans in numbers. It is also, by construction, work whose product is a machine that does the work. Andela, the Lagos-founded firm that once trained African software engineers for American clients, has pivoted to an AI-services marketplace, a reasonable strategy and an uncomfortable signal (Andela, 2025). This layer is the smallest of the four and the most exposed, which is the sentence this chapter would most like not to have to write.
The gender pattern cuts both ways. Contact-centre and moderation work employs women at rates the rest of the formal economy does not, which in the North African labour markets with the widest gender gaps in the world matters more than the headcount suggests: Egypt’s employment gap between men and women is 51.7 percentage points and Morocco’s 44.7. Engineering and field operations employ women hardly at all. A sector that is a genuine route into formal work for women, in the one part of itself the machines reach first, is a summary of the whole chapter.
6. Regulation and policy
Licensing and spectrum. Section 2 gave the mechanics. The policy variable is whether the state prices spectrum to maximise the cheque or the coverage, and the observable is whether anyone enforces the rural obligations in the licence.
Data protection and localization. The continent now has a substantial body of data-protection law, most of it modelled on Europe’s: Nigeria’s Data Protection Act came into force in 2023 with a commission behind it, and Kenya’s Act of 2019 established a Data Protection Commissioner who has become one of the more active regulators on the continent. The continental instrument, the African Union’s Malabo Convention on Cyber Security and Personal Data Protection, was adopted in 2014 and took nine years to gather the ratifications it needed to enter into force in 2023, a fair summary of the gap between continental instruments and national practice that Chapter 7 documents for trade. A growing number of states also require categories of data to be stored domestically. The stated rationale is sovereignty and law-enforcement access; the effect is demand for local data centres, which is why localization rules and the colocation industry grew together. Whether that is industrial policy or rent creation depends on whether the resulting facilities are competitive, and on a continent with three functioning grids, mostly they are not yet.
Taxing the thing you want more of. Governments with narrow tax bases have repeatedly reached for the one transaction they can see, which is a digital one. Ghana introduced an electronic transfer levy in 2022 at 1.5 percent, cut it to 1 percent under protest, watched volumes move to cash and to workarounds, and repealed it in 2025 (Ghana Revenue Authority, 2025). Uganda imposed a daily levy on over-the-top services in 2018 and a 1 percent charge on mobile money transactions, reduced the second to 0.5 percent on withdrawals within weeks after usage collapsed, and eventually replaced the first with an excise on data (Uganda Revenue Authority, 2021). The lesson is not that digital services cannot be taxed. It is that a tax on the marginal transaction of a network good, where the alternative is cash and the elasticity is high, collects less than the arithmetic promises and costs more than it shows, because what it destroys is the network effect Björkegren (2019) measured.
Shutdowns. The state’s most decisive instrument is the off switch. Access Now recorded 21 shutdowns across 15 African countries in 2024, the region’s highest, and 30 across 15 countries in 2025, out of at least 313 worldwide; protests were the leading trigger and elections the second, and Tanzania alone accounted for eight, including a five-day national blackout around the October 2025 election (Access Now, 2026). Ethiopia has run some of the longest regional shutdowns on record, Sudan’s have accompanied the war, and Senegal’s the political crisis of 2023 and 2024. The economics are not subtle: a shutdown suspends the payments system, the logistics layer and the export services industry at once, and the cost falls on firms that had nothing to do with the protest.
The continental and external layers. The AfCFTA’s digital trade protocol, adopted in February 2024, is the only continental instrument addressing cross-border data flows, and Chapter 7 argues that a continental data market is worth more in the second world than in this one. Outside it the layer is a competition: the European Union’s Global Gateway funds cables and connectivity as an explicit alternative to China’s Digital Silk Road, under which Huawei is estimated to have built roughly half of Africa’s 3G networks and around 70 percent of its 4G networks (Atlantic Council, 2024). Those are analyst estimates rather than measurements, repeated often enough to have hardened; what is not in dispute is that the equipment layer of African mobile networks is predominantly Chinese and the content layer predominantly American. Chapter 32 owns China; the observation to carry from here is that the sovereignty argument about Starlink and the one about Huawei are the same argument pointed in opposite directions.
7. Recent trends
Five things have changed since 2022. International capacity stopped being scarce, which moves the binding constraint inland to the middle mile and the retail price. The tower trade reversed, or at least paused. Satellite arrived and the regulators did not agree what to do about it. And the fiscal experiments with taxing digital transactions were mostly abandoned, replaced in several countries by a value-added tax on foreign digital services, which is administratively harder and economically less destructive.
And the compute question arrived very fast. Announcements of gigawatt-scale African data-centre projects are now routine, and almost all of them are announcements: operational capacity is still about 0.4 gigawatts, and the projected multiple to 2030 assumes power that has not been contracted (McKinsey, 2025). This book’s rule for such numbers is Chapter 24’s rule for special economic zones, which is to treat a promoter’s projection as a projection.
8. Climate exposure
The sector’s climate exposure runs three ways and none is existential. Cables are vulnerable to the geological and shipping hazards of Section 4 rather than to the climate directly, though rising sea levels put low-lying landing stations at risk over this book’s horizon. Data centres are a cooling problem: ambient temperature drives power usage effectiveness, and the newer African halls use closed-loop chilled water and free-air cooling precisely to avoid the water consumption that has made siting contentious elsewhere, which matters more in Johannesburg and Casablanca than in northern Europe (Teraco, 2025). Electronic waste is the third and least discussed: a continent that imports second-hand handsets at scale accumulates their remains, and the recycling capacity is almost entirely informal.
9. Firm profiles
MTN Group, Johannesburg
MTN is profiled because it is the sector’s balance sheet made visible. Section 2 gave its 2025 numbers: more than 307 million subscribers, service revenue up 22.9 percent, and a fintech arm that is one of the largest financial networks on the continent, with Nigeria and Ghana growing 54.9 and 35.9 percent in constant currency (MTN Group, 2026). Two things about the group are usually understated. Its results have to be read in constant currency or not at all, because it earns in a dozen soft currencies and reports in one, so a Nigerian devaluation converts a strong operating year into a weak reported one; Chapter 8 supplies the currency machinery and Chapter 24 supplies Lagos. And there is the tower decision: MTN sold its passive infrastructure to fund growth and has now agreed to buy the largest of those tower companies back for about $6.2 billion (IHS Towers, 2026). Read as one sequence, that is a fifteen-year experiment in whether an emerging-market operator should own its own steel, and the firm has changed its answer.
IHS Towers, Lagos and London
IHS is profiled because it is the clearest case in the book of a business model that exists because of a macroeconomic condition rather than a technological one. Section 3 gave its scale; the structure is what matters. Its contracts are long, dollar-linked and escalated for power costs, which made it financeable abroad and made it an unhedged bet on the naira, since a company whose value rests on dollar lease payments from operators earning naira works while the exchange rate is stable and transfers a great deal of pain when it is not. That the outcome is a sale back to its largest customer, at what the market called a modest premium, is the tidiest available illustration of who was carrying the currency risk all along (IHS Towers, 2026).
Teraco, Ekurhuleni
Teraco is profiled because it is the physical location of the second world’s African foothold. It is the largest data-centre operator on the continent, majority-owned since January 2022 by the American group Digital Realty in a transaction valuing it at about $3.5 billion, and its Isando campus east of Johannesburg is the most interconnected point in Africa; its JB5 hall added 30 megawatts of critical load on a 120 megavolt-ampere utility supply across 55,000 square metres, cooled by a closed loop designed to use no water (Teraco, 2025).
That is the whole compute argument in one site: a very large capital investment employing a few hundred people, whose binding input is firm electricity and whose location was chosen because South Africa’s grid, for all the failures Chapter 25 documents, is the best on the continent. It is the asset a country accumulates in the labour-redundant world, and its employment coefficient is close to zero. A book that wants both the growth and the jobs has to say plainly that this asset delivers one of them.
Sama, Nairobi
Sama is profiled because it is the sector’s labour question in a single firm. Founded as an impact-sourcing venture, it recruited from low-income Nairobi neighbourhoods and from refugee communities and sold digital work, including annotation and, from 2019, content moderation for Meta’s African-language platforms. Then the model met its own conditions. The moderation contract ended in 2023, more than a thousand workers lost their jobs, and litigation in the Kenyan courts has run for years over dismissal, blacklisting and the psychological conditions of the work; the Court of Appeal held that Meta can be sued in Kenya, and settlement talks have collapsed more than once (Business and Human Rights Resource Centre, 2026).
The honest reading is neither celebratory nor dismissive. Impact sourcing did what it said: it created formal, contracted, payslip-bearing jobs for people the Kenyan labour market was not going to employ, which on Chapter 10’s overlays is exactly the scarce thing. It also created a dependency on a single foreign client for whom the work was a cost line, in a jurisdiction whose labour courts were then asked to allocate the consequences. Both halves are true, and any serious account of Africa’s place in the AI economy has to hold them at once.
10. What the experiments say
Box 17.1: What fast internet did, and what the design cannot tell you
The study. Hjort and Poulsen (2019) exploit the staggered arrival of submarine cables on the African coast, with maps of the pre-existing terrestrial backbone, to compare localities connected to fast internet with otherwise similar localities that were not. A district’s connection date depends on where the terrestrial network already ran and on when the cable landed, neither chosen with that district’s economy in mind. Three independent datasets across twelve countries give a difference-in-differences estimate of the effect on employment.
What they find. Employment rates rise in connected areas, and rise for less-educated workers too, with little sign the jobs were taken from neighbouring unconnected areas. The sample-wide gain is driven by higher-skilled occupations. Firm data show more entry, higher productivity and more exporting, and average incomes rise. Night-time light emissions rise on the same timing, a check on the labour-force data rather than a separate finding. It is one of very few results linking an infrastructure investment to employment, at scale, on African data, with a credible counterfactual.
What it does not establish. Three things. First, the estimates cover the arrival of the first fast connection, and there is no reason to expect the second, third and fourth cables to do the same work: the interesting margin now is price and use, not presence. Second, the design compares localities within countries, so it cannot speak to the aggregate; if a firm in Nairobi hired a graduate who would otherwise have been hired in Kisumu, the local estimate is right and the national effect is smaller. Third, the period ends before the platform and moderation economy existed, so the study is silent about the composition of the work connectivity now creates. Hjort and Tian (2025) survey 153 studies and reach a compatible summary: sizeable effects in many settings, varying widely with context.
The follow-ups. Bahia and others (2024) set the rollout of 3G coverage in Nigeria against household panels and find coverage reduces poverty and raises consumption, with labour-force participation rising, particularly into wage employment; a companion study of Tanzania points the same way (Bahia et al., 2021). Those are the closest available test of whether connectivity moves the identity’s second term, and the answer is a qualified yes, at the household level, on the mobile-broadband margin rather than the submarine-cable one.
The older evidence. Aker and Mbiti (2010) surveyed the first wave of African mobile telephony and set the terms everyone still argues in; Aker (2010) showed that mobile coverage narrowed price dispersion across Nigerien grain markets, which Chapter 6 uses; Björkegren (2019) estimated the network externalities in Rwandan mobile adoption directly and found them large enough that a tax on usage destroys substantially more value than it raises, which is the result underneath Section 6’s fiscal experiments.
The systems question. Does connectivity create jobs or reallocate them? Hjort and Poulsen find little displacement across space; the household studies find participation rising, which is creation. Neither can rule out reallocation their designs cannot see, and the Kenyan and Ghanaian rows of Table 17.2 are a standing reminder that the countries with the best connectivity records also have among the worst records on the identity’s middle term.
11. Data sources
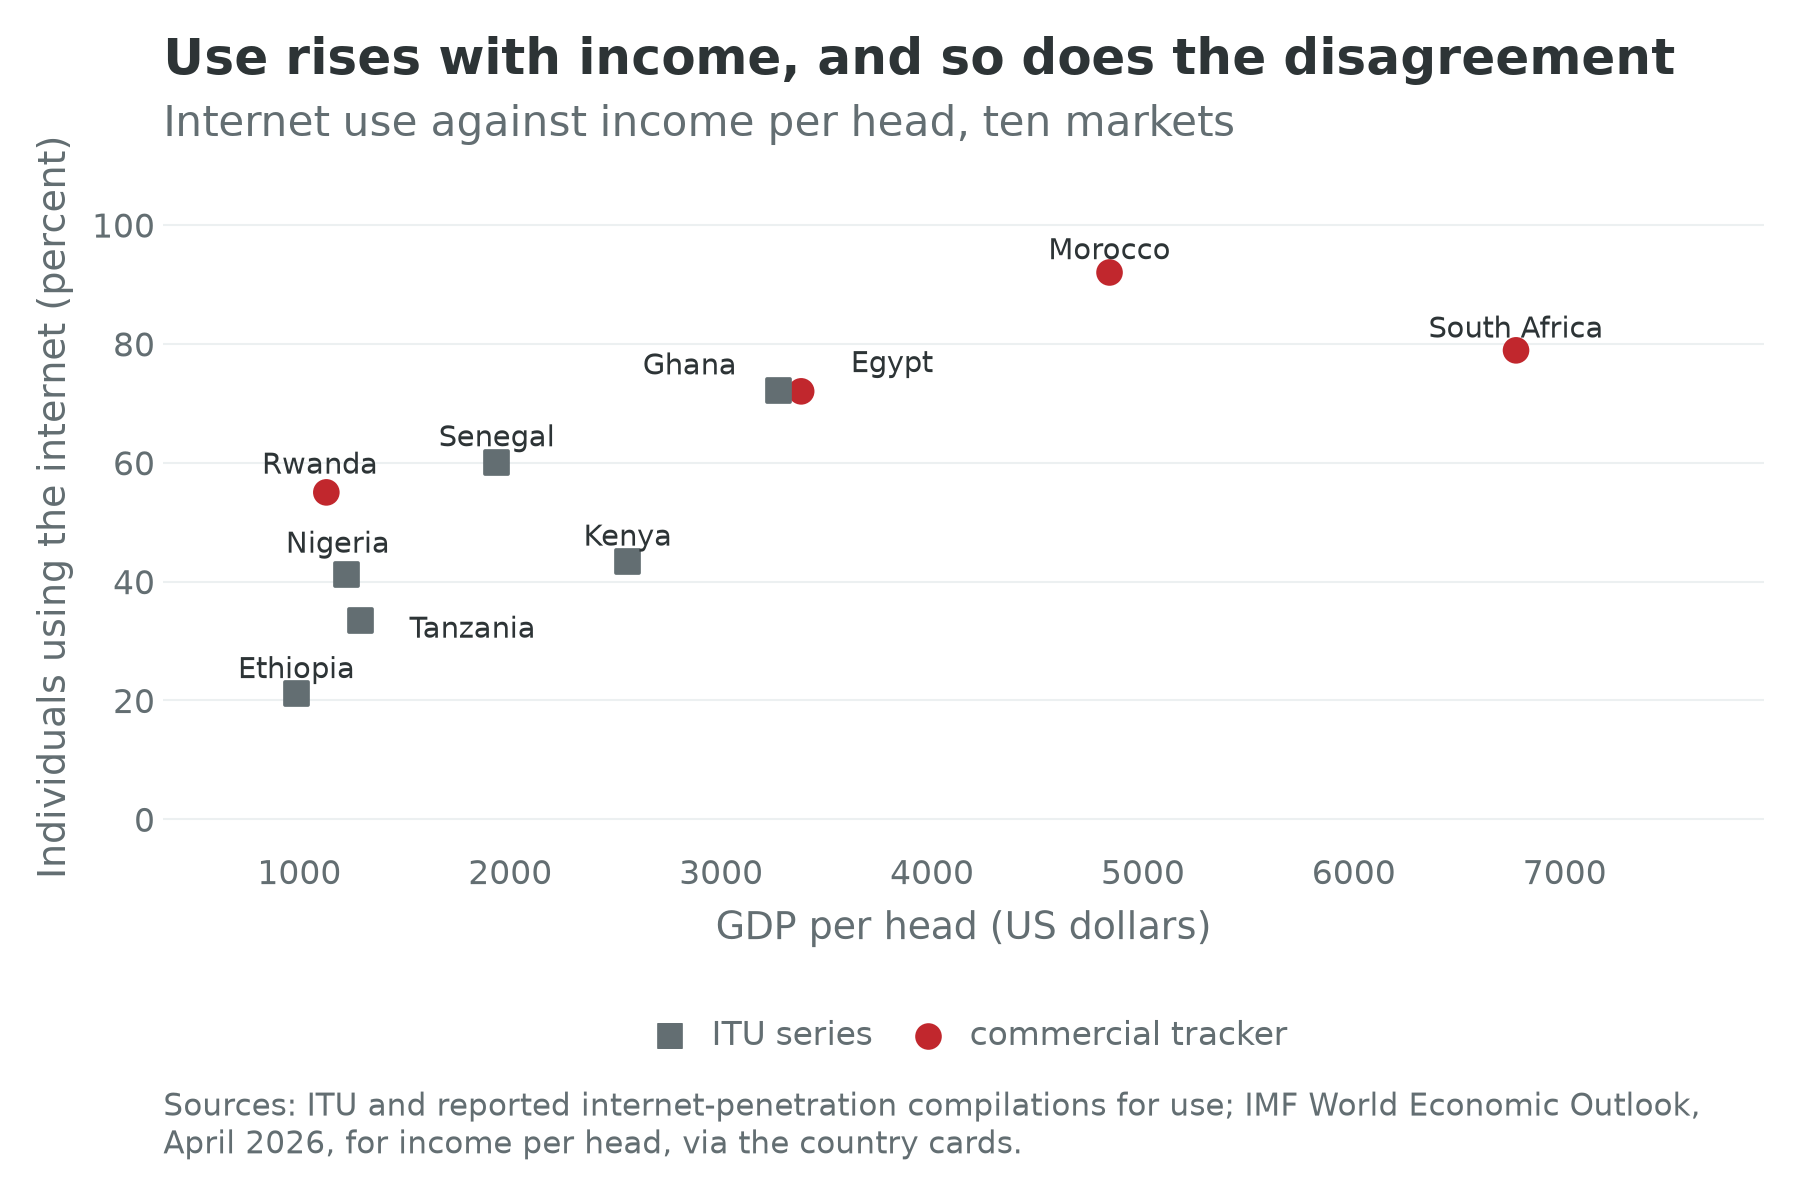
- International Telecommunication Union: Facts and Figures, the State of Digital Development and Trends series for Africa, and the affordability price baskets. The country-level use series is the one Figure 17.1 marks as the international series; it is built from administrative returns and household surveys of varying vintage, which is why it disagrees with commercial trackers.
- GSMA Intelligence: connections, unique subscribers, smartphone adoption and the coverage and usage gaps. GSMA counts connections and subscribers, the ITU counts individuals using the internet, and the two are different quantities before they are different numbers.
- Submarine cable map records and operator announcements for landing points, ready-for-service years, ownership and route; Xalam Analytics and the industry data-centre databases for capacity in megawatts, with the caveat that announced and operational capacity are routinely reported together.
- Operator and infrastructure reporting, by name: MTN Group, Airtel Africa, Orange, Vodacom, Safaricom, Ethio Telecom, IHS Towers, Helios Towers, Liquid Intelligent Technologies, Teraco and Jumia; Access Now and the #KeepItOn coalition for the shutdown counts; national regulators for licences and spectrum.
- Country cards: the identity terms, the overlays, income per head and the data-quality block behind Table 17.2. The cards carry no sector fields, so every capacity, subscriber and price figure here comes from a named source rather than a card.
12. Exercises
Connections to other chapters
- Chapter 1 sets out the identity, the data-quality layer and the two worlds; Chapter 6 owns the definition under which the agent, rider and repair economies are informal self-employment; Chapter 10 the overlays Section 5 reports against and the exposure arithmetic behind the two-worlds subsection.
- Chapter 7 owns the AfCFTA digital-trade protocol; Chapter 8 the currency machinery that makes a dollar-linked tower lease dangerous; Chapter 14 the electricity that decides where compute is sited; Chapter 16 mobile money; Chapter 19 the logistics layer under e-commerce.
- Chapters 24, 25, 26, 27 and 29 own the places: the Lagos to Abidjan cable cluster, Gauteng and its grid, the Nairobi and Mombasa axis, the Egyptian land crossing, and the Ethiopian market opening.
- Chapters 32, 33 and 35 own the equipment-layer competition, the Global Gateway and Digital Silk Road programmes, and the labour-redundant world as a scenario axis.
Discussion questions
Figure 17.3 puts 64 percent of the continent’s population inside a footprint they do not buy (GSMA, 2025). Name the three things that sit in that gap, say which of them a communications regulator can move with an instrument it actually holds, and say what a finance ministry would have to give up for the regulator to move it.
Hjort and Poulsen (2019) found comparably sized employment gains across primary, secondary and tertiary education groups and little displacement across space. Construct the strongest case that the result is nevertheless a poor guide to policy in 2026, using the three limits in Box 17.1, and say what observation before 2035 would settle whether the marginal cable is worth financing.
MTN sold its towers and has agreed to buy the largest of the buyers back. Set out the conditions under which an operator should own its passive infrastructure and those under which it should lease, in terms of the cost of capital, the exchange-rate regime and the number of operators in a market. Then say which of those changed between 2012 and 2026, and whether the reversal is a correction or a cycle.
Try it
Open three cards side by side: Kenya, Ghana and Nigeria. Read the three identity terms, then the overlays, then the data-quality block. Write one paragraph on a single question: Kenya and Ghana combine strong output-per-worker growth with among the sharpest falls in the employment ratio on the continent, and Nigeria has the opposite configuration. Which would you cite as evidence that connectivity creates jobs, and what on the cards, rather than in this chapter’s prose, would an opponent cite against you? Then open the Growth Pole Map, switch on the cables and data-centres layer, and turn on the confidence toggle. The layer plots the cable landing stations and data centres this chapter names; count the landings in each of the three countries, and let Nigeria’s low flag change the weight you put on its row.
Data exercise
Take the chapter’s connectivity data file from the book site, which gives internet use by country on two reporting families, and join it to cards.csv or cards.json from the country cards page on scale.gdp_per_capita, data_quality.spi_overall_score and data_quality.confidence_flag. Then do three things. First, reproduce Figure 17.1 and compute the correlation between internet use and the logarithm of income per head, once on all ten points and once on the six from the international series alone; report both and say which you would publish. Second, take the countries where the two families disagree most and say whether the disagreement concentrates in the weaker statistical systems. Third, using the chapter’s cable data file, count the systems landing in each country, compare that count with identity.output_per_worker_growth, report the correlation, and write two sentences on why you should not believe it. Fourth, scale.urban_share is filled on all fifty-four cards, the share of a country’s population living in what its own statistical office calls a town: add it to the internet-use regression, report what happens to the income coefficient, and say whether connectivity in Africa is a fact about wealth or a fact about density. Then note that scale.largest_city is filled on fifty cards and null on four, on a delineation that is not the urban share’s, and say in two sentences why the two must not be put in the same regression. Treat every null as missing, never as a zero.
Data Sources and Further Reading
The datasets are listed in Section 11; what follows is the reading.
- Jonas Hjort and Jonas Poulsen (2019) on the arrival of fast internet, with Jonas Hjort and Lin Tian’s review of 153 studies (2025) for the range of estimates the single result sits inside.
- Kalvin Bahia and co-authors on mobile broadband and household welfare in Nigeria (2024) and Tanzania (2021), the closest available test of whether connectivity moves the employment margin.
- Jenny Aker and Isaac Mbiti (2010) on what the first wave of mobile telephony did and did not do, and Daniel Björkegren (2019) for network externalities estimated rather than asserted.
- Karthik Muralidharan, Paul Niehaus and Sandip Sukhtankar (2016) on biometric payments in India, the case every African digital-identity programme cites and the one whose result is narrower than the citation implies.
- Paweł Gmyrek, Janine Berg and David Bescond (2023) and the ILO’s refined 2025 index, for the exposure estimates behind the two-worlds subsection.