29. Addis–Djibouti
Pole type: productivity platform, with a rent-and-logistics coast.
Ethiopia holds 132.1 million people, more than any African country except Nigeria, and it has no coast. Almost everything it buys and sells abroad travels one 750-kilometre line to a republic of 1.2 million people on the Gulf of Tadjoura, so that for every Djiboutian at the seaward end of the corridor there are a hundred and thirteen Ethiopians behind it. No other pole in this book is so lopsided, and none has been the object of so deliberate an attempt by a state to change what its economy is made of.
Learning Objectives
After reading this chapter, you should be able to:
- Read the identity for Ethiopia and Djibouti, and explain why Ethiopia is at once the fastest grower on the continent and the book’s clearest case of growth without employment growth.
- Set out the balance sheet of a state-led investment push: who lent, in what form, what the 2023 default did and did not settle, and why the Chinese line looks different in the debt statistics than in the loan records.
- Run a growth diagnostic on a pole whose infrastructure was built first, and defend the claim that the constraint here has been the availability of foreign exchange and the state’s allocation of it rather than the absence of roads, power or ports.
- Describe the settlement that built the parks and the railway in the vocabulary of Chapter 5, and say why Ethiopia is the country Dercon uses to show that a bargain on growth can be real and still end in a war.
- Say what the numbers here can and cannot bear, given an Ethiopian census taken in 2007 and a round postponed ever since, and a Djiboutian statistical system that has only just run its first labour survey.
The argument, stated in front so a reader can watch it being tested, is that Addis and Djibouti are the strongest available African test of the classical development recipe, and that the test has come back with an answer nobody wanted. Ethiopia did what the recipe asks. It built the power, the railway and the parks, it kept the state on the commanding heights, and it grew faster than any other economy on the continent for two decades. What it did not do was put a rising share of its working-age population into work: the highest third term of the 53 cards that carry one, beside the lowest second term of the same 53.
That combination is also why the pole matters to the book’s central conditional. The rung Ethiopia is climbing, the light-manufacturing export rung on which unskilled labour has historically been paid for, is the rung Chapter 1’s labour-redundant world removes; the assets it built in the same decade, hydroelectricity at a scale nothing else in Africa approaches and land nobody else is using, are what that world wants. One pole holds both halves of the bet.
1. The pole in the identity
Chapter 1 set the identity the book runs on: output is output per worker, times the employment-to-working-age ratio, times the working-age population, so that in growth rates GDP growth is approximately the sum of the three. Table 29.1 reports all three terms for the pole’s two cards over 2014 to 2024. The gap column is implied growth less observed, and it is small in both, so the decomposition can be quoted.
| Country | Term one: working-age population | Term two: employment ratio | Term three: output per worker | Implied growth | Observed growth | Gap | Wage employment (percent of employment) | Non-agricultural employment (percent) | Confidence |
|---|---|---|---|---|---|---|---|---|---|
| Ethiopia | 3.46 | -1.58 | 5.91 | 7.79 | 7.92 | -0.13 | 15.4 | 39.0 | low |
| Djibouti | 2.28 | -0.20 | 3.33 | 5.41 | 5.46 | -0.06 | 48.7 | 98.8 | medium |
All figures are annual growth rates in percentage points except the last three columns, which are shares and a flag. Term one is the working-age population aged 15 to 64; term two is modelled employment aged 15 and over divided by that population; term three is the residual output-per-worker series. Sources: UN World Population Prospects 2024, ILOSTAT modelled estimates (November 2025), and the IMF World Economic Outlook (April 2026), via the country cards.
Read the Ethiopian row against the other fifty-two and it stops being a good record and becomes an anomaly. Observed growth of 7.92 percent a year is the highest on any card, and so is output-per-worker growth of 5.91 percent, against a continental median for that term of 0.74 percent. The employment ratio fell at 1.58 percent a year, the largest decline of any card that carries the term. One country holds the top of one distribution and the bottom of another.
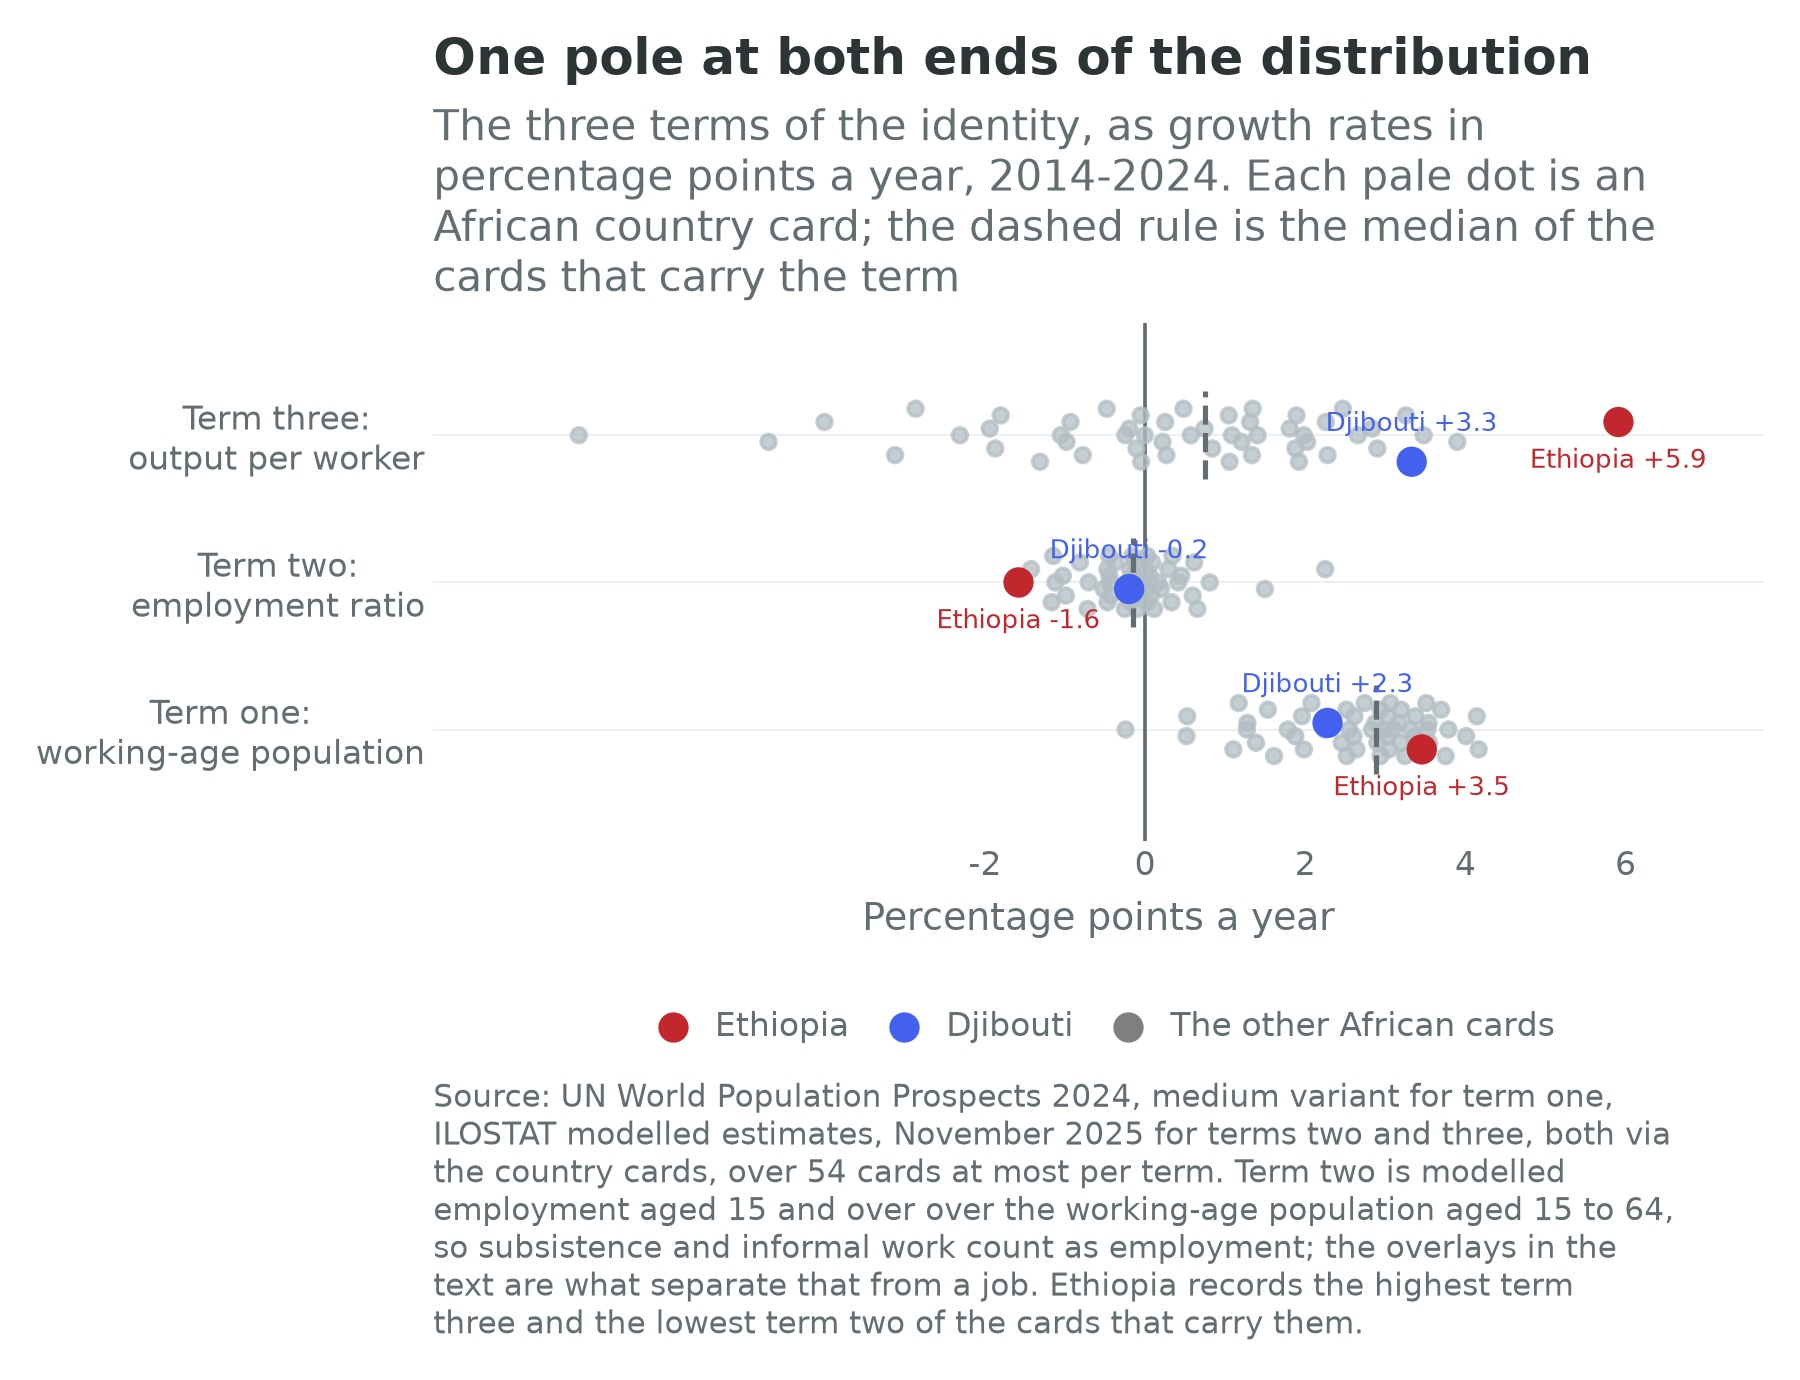
The middle column is doing more work than it looks. Chapter 1 warned that a modelled employment series, which counts subsistence farmers, flatters every African country, and Ethiopia is where the flattery is thickest: 39.0 percent of employment is non-agricultural against 98.8 percent of Djiboutian, only 15.4 percent is waged, and informal employment is 77.7 percent. A ratio that already counts everyone who touched a hoe, falling at 1.58 percent a year in an economy growing at nearly 8 percent, is as sharp a statement of the jobs problem as this book contains, and sharper than it looks, because the wage-employment share says the stock of real jobs behind it was small to begin with.
Djibouti’s overlays say something different and equally uncomfortable. Its employment ratio is nearly flat, its wage-employment share of 48.7 percent is three times Ethiopia’s, and its non-agricultural share is the highest of the 53 cards carrying the overlay: this is not a farming country but a port, a garrison and a capital. It also records the highest share of young people not in employment, education or training of the 48 cards that carry the overlay, 51.0 percent, beside a female employment rate of 12.4 percent against a male rate of 35.0. An economy of rents can post a respectable third term and employ almost nobody.
Term three splits, following Chapters 6, 9 and 10, into the part from firms within a sector getting better and the part from workers moving between sectors. Ethiopia’s card carries the split, over the window the transformation database covers, 2008 to 2018: 4.21 percentage points a year within sectors and 1.67 between them, both positive, and the within-sector component is the largest of the twenty-one African cards the database reaches. Djibouti has no split at all, because the database does not cover it, and this chapter will not guess at one.
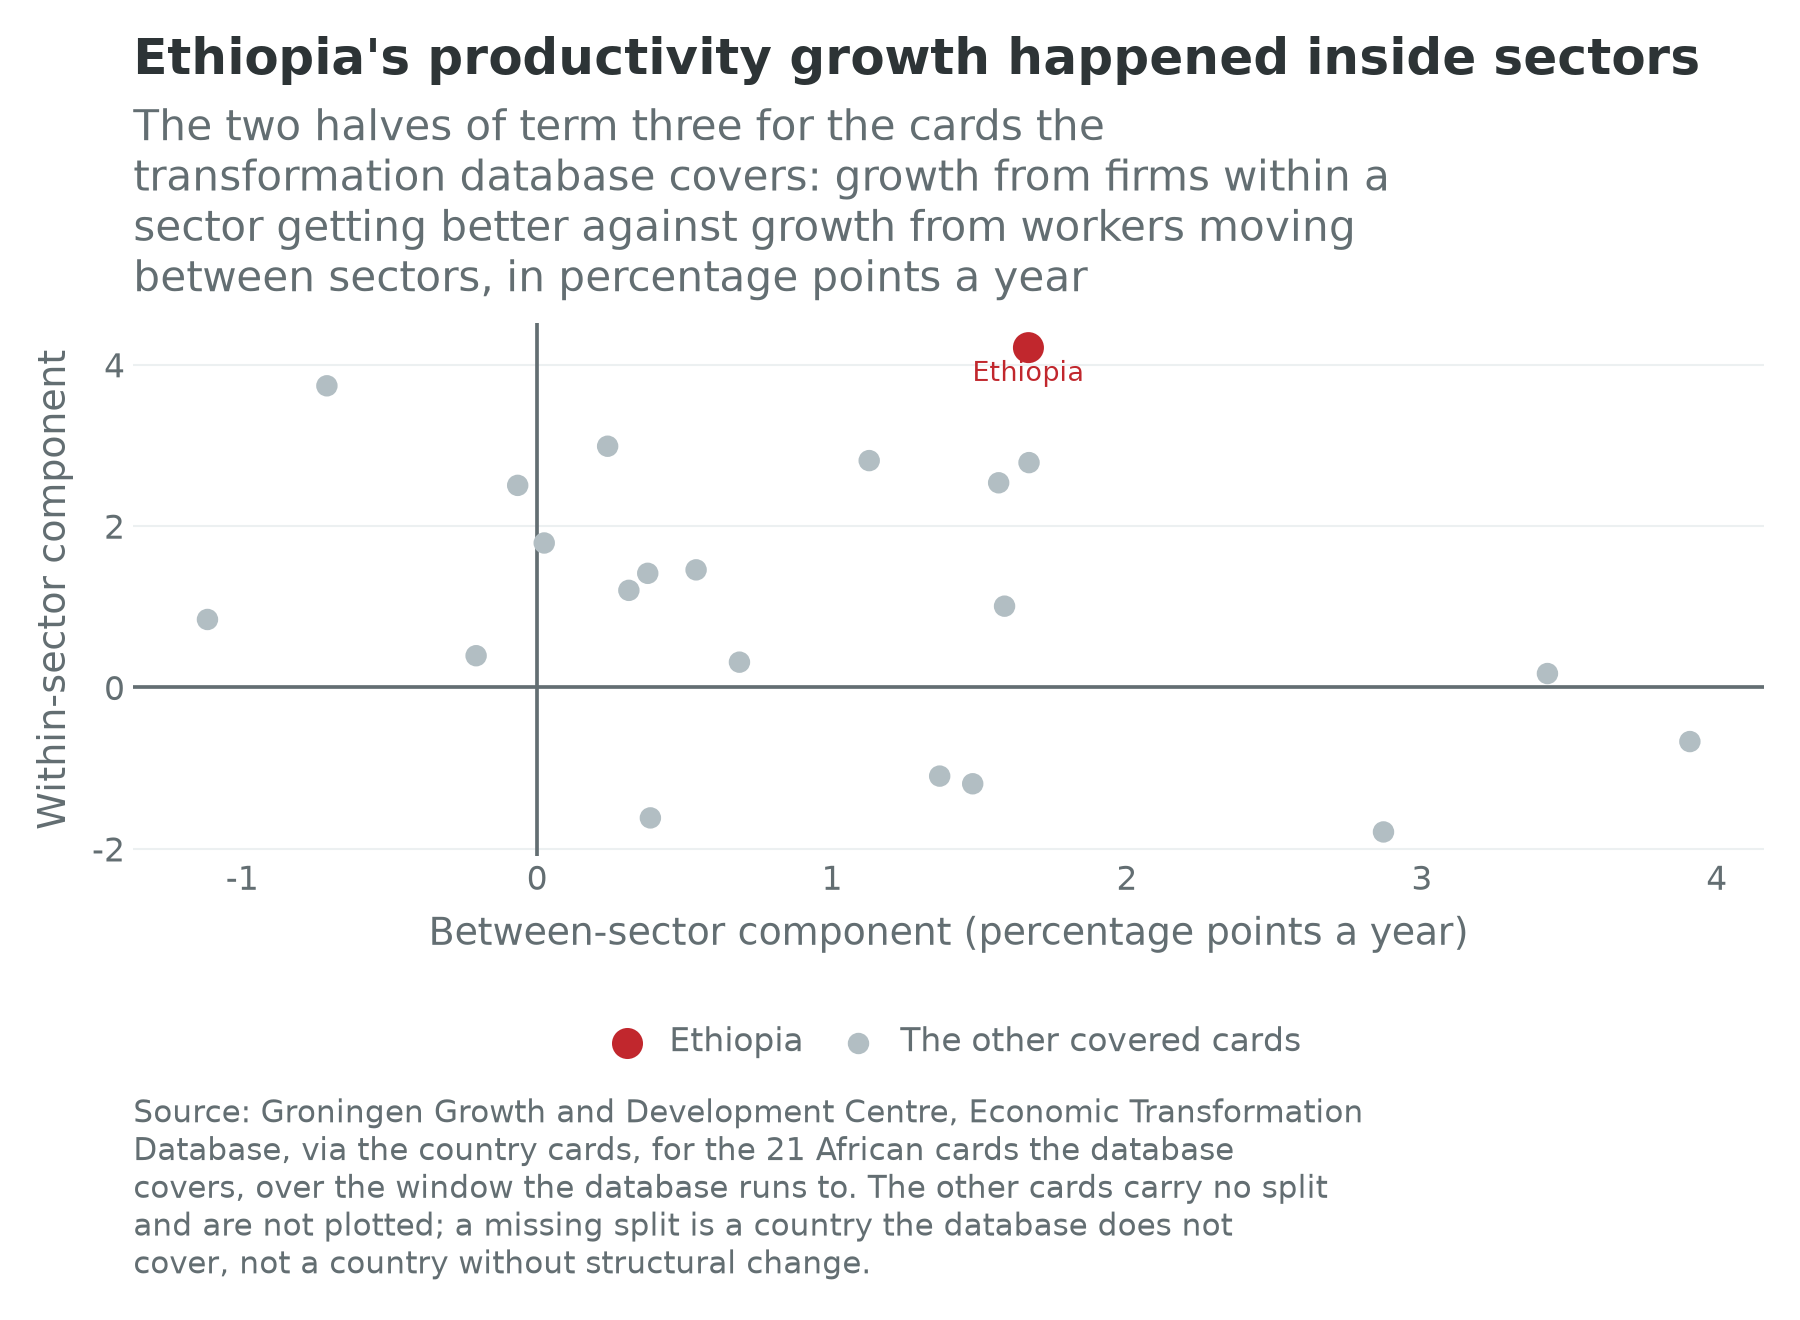
That is a good structural-change record, and it makes the falling employment ratio stranger rather than less strange. In the account of Diao, Ellis, McMillan and Rodrik (2021), which uses Ethiopian firm data as one of its two cases, large firms raise productivity without adding employment while small firms add employment without raising productivity. Ethiopia is the extreme version: state utilities, an airline, some foreign-invested factories and a construction sector building at a rate no African country has matched, all of them employing few people per unit of capital, while agriculture, which still holds most of the workforce, is where the falling ratio was recorded.
What the pole becomes in two worlds
This is the pole where Chapter 1’s two worlds diverge most sharply, because they want opposite things from the same country.
In the labour-abundant world Ethiopia is the best remaining African candidate for the East Asian sequence: 132.1 million people now and 225.0 million by 2050, a median age of 18.9 years, wages until recently among the lowest quoted anywhere in apparel sourcing, and a state that has shown it can build, staff and power an industrial estate. The missing ingredient was never capability; it was export discipline and a currency to support it, and the reforms of 2024 addressed both. On this reading the parks of section 6 are early rather than failed.
In the labour-redundant world the same endowment is a liability, with two exceptions. Cut-and-sew apparel for rich-country retailers is the first rung a machine takes, and in Ethiopia it has already been taken once by a political decision rather than by a robot, when the loss of American trade preference emptied part of Hawassa in a single year: a country planning to employ millions sewing shirts is exposed twice, to the tariff and to the machine. The exceptions are what that world is short of. Ethiopia has the largest hydroelectric plant in Africa and a grid built to export from it, at a moment when the binding constraint on compute is turning out to be electricity, and it has land and sun. Whether that makes a growth century or a rent depends on who owns the machine at the other end of the wire, which Chapters 32 and 35 take up.
2. The pole on the balance sheet
Table 29.2 gives the stock side from the two cards.
| Country | External debt stock (\(bn) | Multilateral (\)bn) | Official bilateral (\(bn) | Bonds (\)bn) | Other private (\(bn) | Chinese loan commitments, 2000 to 2024 (\)bn) | |||
|---|---|---|---|---|---|---|
| Ethiopia | 36.5 | 15.7 | 12.5 | 1.0 | 5.7 | 14.0 |
| Djibouti | 3.4 | 0.9 | 1.9 | none recorded | none recorded | 1.6 |
Sources: World Bank International Debt Statistics (2025 release) for the stock and the creditor lines; the Boston University Chinese Loans to Africa database (2000 to 2024 release) for the commitment column, which is a cumulative flow of commitments and not a stock. The creditor columns are publicly guaranteed long-term debt and do not add to the stock, which also carries short-term debt, Fund credit and private non-guaranteed borrowing.
Three features decide the rest of the chapter. The first is that this is an officially financed pole rather than a bonded one. Ethiopia sold exactly one international bond, for $1.0 billion, and $28.3 billion of its $36.5 billion external debt stock, 77.3 percent of it, is owed to multilateral institutions and bilateral governments. This is what a state-led investment programme looks like on the liability side, and the opposite of the bonded West African pole of Chapter 24: contractors’ credits, project loans and export-credit lines arranged government to government, rather than a market that reprices every morning.
The second is the Chinese line, the largest in this book after Angola’s. The loan database records $14.0 billion of cumulative commitments to Ethiopia between 2000 and 2024, second on the continent, and $1.6 billion to Djibouti, which is 36.0 percent of a year of Djiboutian output. The balances still outstanding put numbers on what that bought. Ethiopia owes $7.4 billion to creditors in China, the second-largest Chinese claim on the continent and 22 percent of everything it owes under a government guarantee; Djibouti owes $1.4 billion, which is 50.5 percent of its guaranteed external debt and the third-highest Chinese share on any card. Both owe China more than they owe the whole Paris Club, Ethiopia $7.4 billion against $4.6 billion and Djibouti $1.4 billion against $132 million, and Djibouti’s ratio of eleven to one is the starkest in the book outside the resource states. Chapter 32 explains why neither figure may be added to the bilateral column beside it: a creditor country and a creditor type are different classifications of the same debt. The railway, the water pipeline, much of the grid and several of the parks were financed the same way, and the creditor list is what that looks like afterwards: one creditor, one revenue stream, one currency.
The third is the default, the most instructive recent passage of African debt history after Ghana’s, because it is the case where almost nothing was owed to bondholders and the restructuring took longest anyway. Ethiopia entered the G20 Common Framework in 2021, agreed a standstill with its official creditors in November 2023, and missed a $33 million coupon that December, defaulting on the only Eurobond it had ever sold (International Monetary Fund, 2026b). Five years of process followed for one billion dollars of bonded debt. A preliminary agreement reached in mid-2026 would exchange the matured bond for $880 million of new notes at 6.15 percent amortising between July 2026 and July 2029, with the three missed coupons of $99.375 million paid in full and a consent fee of half a percent, a haircut of 12 percent on principal; bilateral creditors rejected those terms in January 2026 as failing the comparability-of-treatment test and accepted them in August 2026 (International Monetary Fund, 2026b). The lesson is not that Ethiopia was badly treated but that the machinery is slowest where the private claim is smallest, since comparability has to be established whether that claim is thirteen billion dollars or one, and the process cost does not scale down. A country was cut off from market financing for most of a decade while trying to finish the largest investment programme in its history.
Beside the default sits the reform. On 29 July 2024 the central bank abandoned the managed rate and let the birr float, and the same day the Fund approved a four-year arrangement of about $3.4 billion (International Monetary Fund, 2026b). By the fifth review in July 2026 about $2.65 billion had been disbursed, all quantitative performance criteria had been met, reserves had risen from $1.1 billion in June 2024 to $3.4 billion a year later, and headline inflation had fallen into single digits, reaching 9.7 percent in February 2026 (International Monetary Fund, 2026b). Export earnings hit a record $10.7 billion in 2025/26, of which gold was about $5.5 billion and coffee a record $3.0 billion (National Bank of Ethiopia, 2026). Those are the numbers of a successful stabilization, and section 3 explains why their composition matters more than their size.
Djibouti’s balance sheet is smaller and starker. Recorded external debt is $3.4 billion against output of $4.4 billion, 78.2 percent, the sixth-highest ratio of the fifty cards carrying both. Public debt rose from 34.9 percent of output in 2013 to 68.9 percent at the end of 2024, the external debt is assessed as in distress and unsustainable, Chinese institutions hold more than half of it, and in October 2023 the Chinese export-import bank agreed a moratorium on the railway and water-pipeline loans that reprofiled $314 million of arrears, about 8 percent of output, and cut payments falling due between 2024 and 2027 from about $276 million to about $20 million (International Monetary Fund, 2025a). A creditor that reschedules quietly is what Chapter 32 says the Chinese lender usually is, and Djibouti’s debt problem is accordingly settled bilaterally rather than in public.
Ownership completes the picture. Ethiopia’s commanding heights are state property: the airline, the utility, the grid, the railway share, the parks and, until 2021, the telephone network. Djibouti’s are foreign: the container terminal is run by a Chinese state port group after the government expelled its Emirati operator, and the largest single line of national income is rent from other people’s armies.
3. The binding constraint
Growth diagnostics, in the form Hausmann, Rodrik and Velasco (2005) gave it, asks one disciplined question: of everything wrong with an economy, which single thing, fixed first, would raise private investment most? The method walks down a tree, testing each branch by its shadow price rather than by whether it is bad.
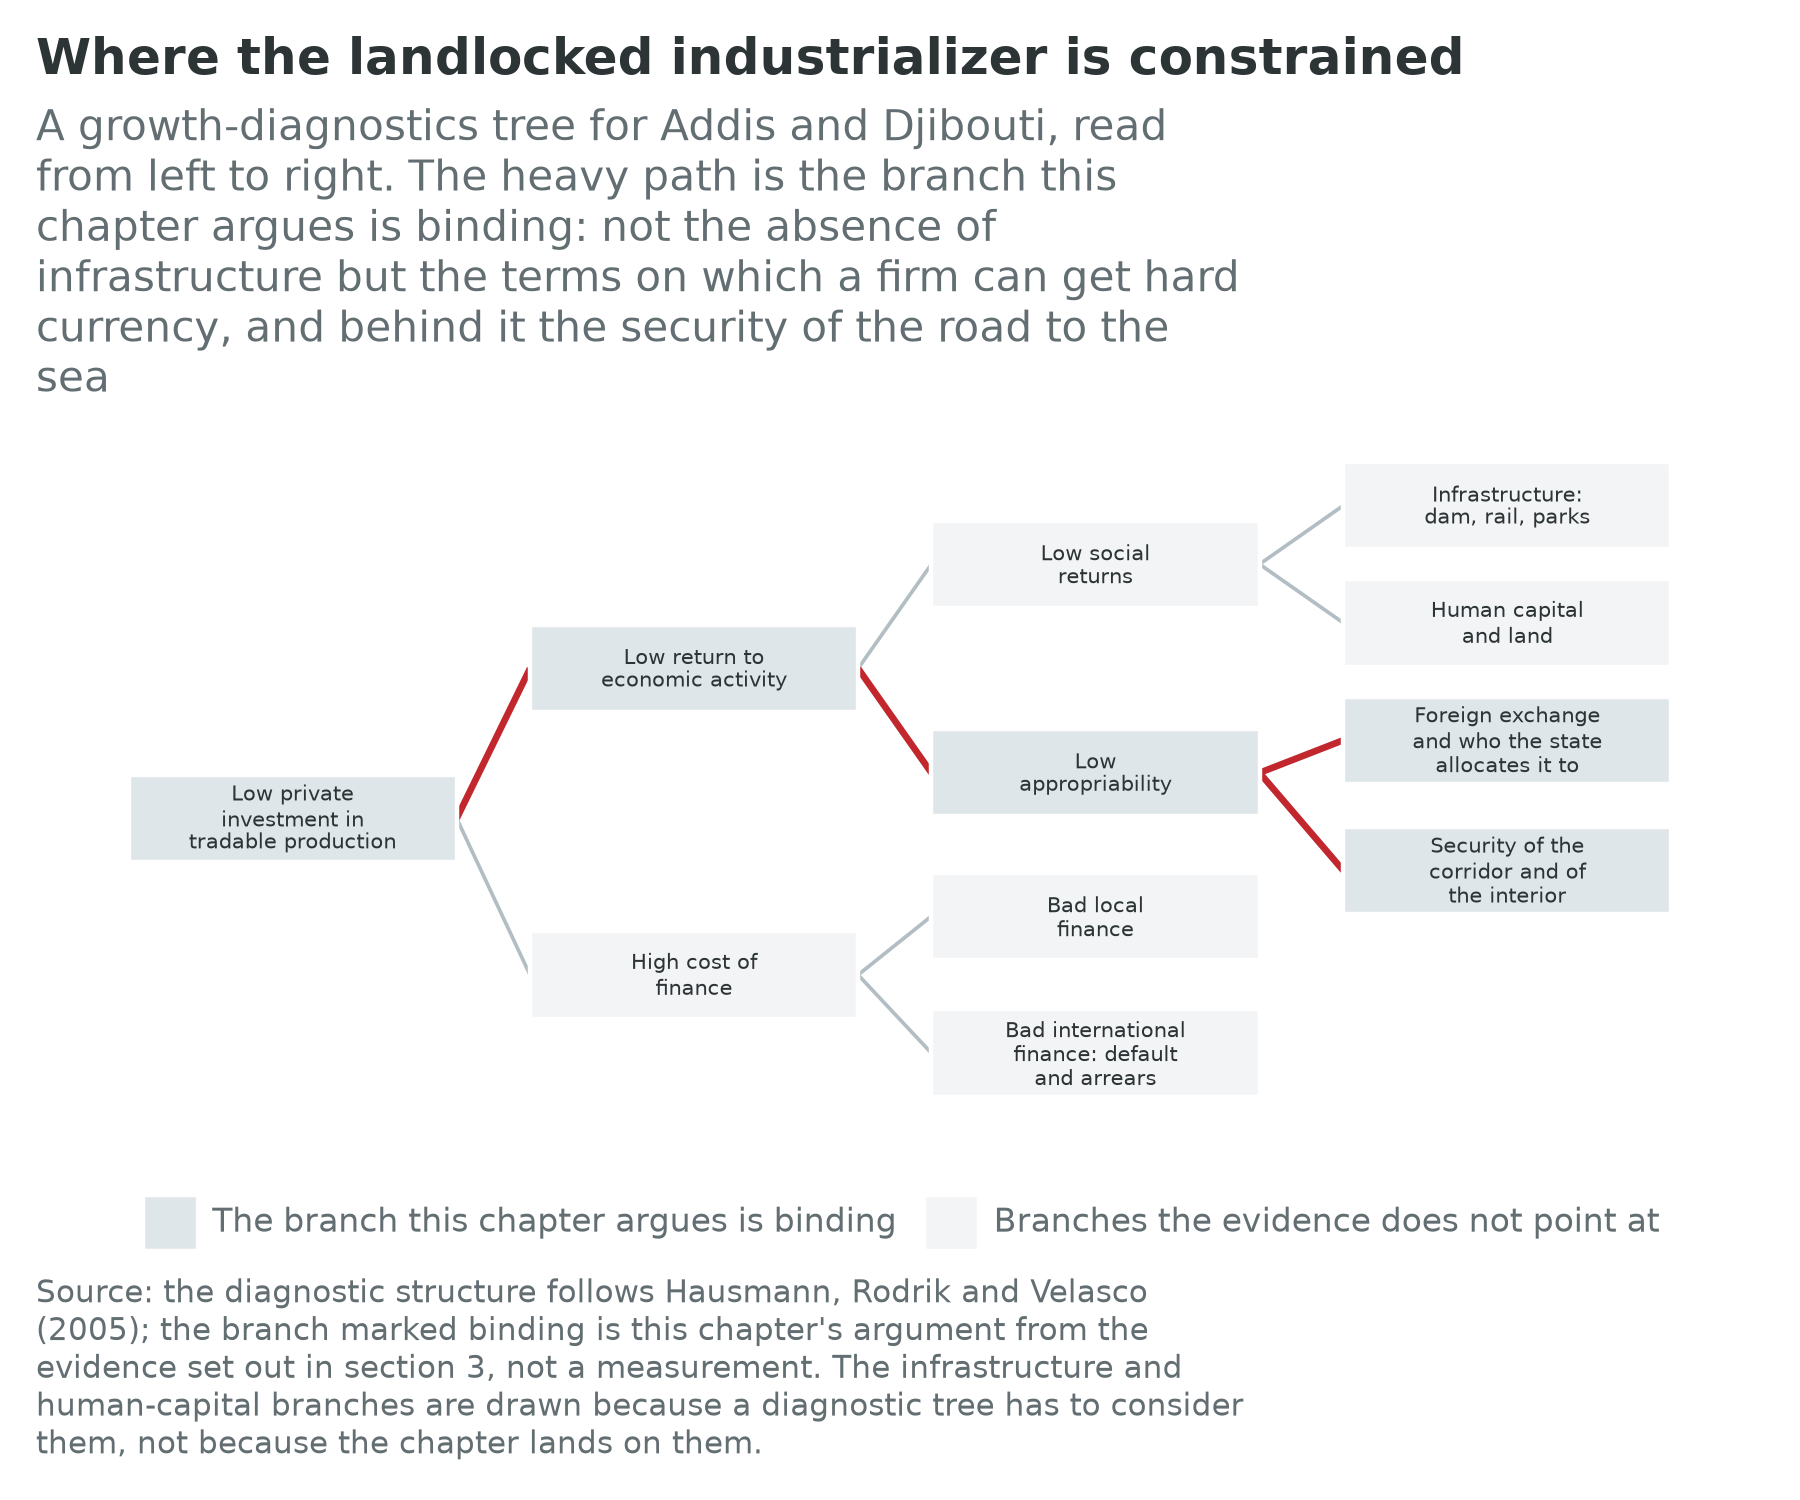
Begin by eliminating the branch every other pole chapter lands on, because eliminating it is what makes this pole interesting. Infrastructure does not bind here. Ethiopia has the largest hydroelectric plant in Africa, an electrified standard-gauge railway to a deep-water port, ten industrial parks with power, water and customs on site, and an airline with a global network; occupancy in the best parks has run above 80 percent (World Bank, 2022b). The state built what sections 3 of Chapters 24 and 25 find missing elsewhere, and it built it first, which is the content of the phrase “state-led”. Two qualifications keep the claim honest: only 56.6 percent of Ethiopians had electricity in 2024, 95.1 percent in urban areas against 44.8 in rural ones, so the grid is a national failure and an industrial success at once (World Bank, IEA, IRENA, UNSD and WHO, 2025); and a single corridor is a fragile thing.
Eliminate human capital next, with the usual hesitation. Ethiopia’s schooling indicators are poor and its universities expanded faster than their staff, and Chapter 20 takes both seriously. But the diagnostic test asks whether the return to skill is being bid up, and the observable pattern runs the other way: youth not in employment, education or training runs at 17.5 percent, low by continental standards, because so much of the young labour force is absorbed into agriculture and informal trade rather than queueing for a job it cannot get.
What binds sits on the appropriability side and has a specific name: the availability of foreign exchange and the state’s decision about who gets it. Before July 2024 Ethiopia ran a rationed currency at an administered rate with a large parallel premium, and a firm inside a park could import its fabric only when the central bank released the dollars. The complaint from tenants was never that power failed or the road was bad; it was that inputs waited weeks for an allocation, that profits could not be repatriated, and that the conversion price was set by an official who could be lobbied. A World Bank assessment found the parks employing about 19 percent of their capacity and realising about 15 percent of their export potential, against an estimate that full operation would mean roughly 300,000 jobs and $1.3 billion of exports a year, more than coffee, oilseeds and cut flowers combined (World Bank, 2022b). That is a shadow price written as a gap: capital built and left idle for want of a claim on hard currency.
The diagnosis is testable, and one that cannot be wrong is not worth making. If the constraint was appropriability through the currency, floating the birr should be followed by a rise in the share of output sold abroad by private manufacturers rather than by state agencies. Two years in, the direction is right and the composition is not: the record export year of 2025/26 was about half gold and most of the rest coffee, a windfall from formalised artisanal mining and a good harvest rather than a manufacturing response (National Bank of Ethiopia, 2026). A reader who wants to know whether this chapter is right should watch the manufactured-export line for the rest of the decade and nothing else.
Behind the currency stands a second constraint, which a diagnostic tree renders as micro risk and a firm as an insurance premium. This pole has one road. Between November 2020 and the end of 2022 a war in the north destroyed a large part of the country’s productive capital, and since 2023 an insurgency in Amhara has intermittently closed roads between the capital and its second industrial region (Human Rights Watch, 2026). The corridor to Djibouti has not itself been cut, which is worth stating plainly, but an investor pricing a twenty-year plant asks about the distribution rather than the realisation.
One branch is set aside with less confidence. The cost of finance does bind in its international form, and the domestic banking system has been an instrument of directed credit rather than an allocator of capital. It is set aside because it is downstream of the same decision: a state that rations dollars is a state that directs credit, and both are the settlement of section 4 acting through the financial system.
4. The political settlement
Chapter 5 supplies the vocabulary: Khan (2010) on institutions working only when they fit the underlying distribution of organizational power, Pritchett, Sen and Werker (2018) on whether deals are ordered or disordered and open or closed, and Dercon (2022) on whether the elite has bet on growth or on dividing what exists. Ethiopia is the country Dercon uses more than any other to make his case, having advised the government he writes about, and it also supplies his hardest qualification.
The settlement that built this pole was assembled after 1991 by the Ethiopian People’s Revolutionary Democratic Front: a coalition of ethnically defined regional parties under the effective control of one of them, running a developmental state on an explicitly Asian model, with land in public ownership, the commanding heights held by state enterprises and party-linked endowment conglomerates, and a leadership that read the East Asian literature and acted on it. In Dercon’s terms that was as close to a genuine development bargain as post-independence Africa has produced; in Pritchett, Sen and Werker’s it was ordered and closed, and the order was the point; in Khan’s, the written rules mattered less than the fact that one organization could enforce a decision from the capital to the district.
It delivered the third term of Table 29.1 and broke on the second. A settlement that distributes through employment can absorb a growing cohort; one that distributes through public investment, land allocation and state jobs cannot, and by the mid-2010s an expanding, educated, urban and largely Oromo young population was outside the bargain. The protests of 2015 to 2018, about land around the capital and about who was in the coalition, ended it. The Prosperity Party formed in 2019 dissolved the ethnic-coalition structure into a single national party, a genuine attempt to widen the settlement and, to the party that had dominated the old coalition, an expropriation. War followed in Tigray in November 2020.
The economic cost is the largest single number in this chapter. Damage to infrastructure has been put at $22.7 billion with a further $6 billion of productivity losses between November 2020 and December 2021 alone, about 26 percent of a year’s output, with cumulative losses reaching roughly $125 billion by 2027, on which reckoning the economy will be about 19 percent smaller than it would otherwise have been; around 90 percent of Tigray’s health facilities were damaged or destroyed and the regional poverty rate rose from 27 to 45 percent (Oxford Initiative on Peace and Recovery in Ethiopia, 2022). The identity covers 2014 to 2024, so it contains the war, and Ethiopia still posted the continent’s highest output-per-worker growth: not a paradox to explain away but a statement about how much of the growth sat in places and sectors the war did not touch.
The settlement since has been neither restored nor replaced. The Pretoria agreement of November 2022 stopped the northern war; the Amhara insurgency that followed was not stopped by the agreement the African Union and IGAD brokered with one Fano faction in December 2025, and attacks rose by more than half in the spring of 2026 against the preceding quarter (Human Rights Watch, 2026). Apply Dercon’s test now and the answer is unresolved. For a bargain on growth: the float, the Fund programme, the opening of telecommunications and banking to foreigners, and a leadership that has spent political capital on unpopular macroeconomic decisions. Against: an elite bargain that cannot include two of the largest regions, a capital rebuilt by demolition, and an electoral process that has not been competitive. Ethiopia is Dercon’s own illustration that a bargain on growth is not a bargain on power sharing, and that the second can destroy the first.
Djibouti’s settlement is older and simpler. One family and one party have held the presidency since independence in 1977, the state’s income is rent from geography, and the elite bargain is about dividing that rent. It is ordered and very closed, and it is not, on the evidence of Table 29.1, a failure: 3.33 percent output-per-worker growth a year and 48.7 percent of employment waged are respectable figures. What a rent settlement cannot do is employ the young, and Djibouti’s 51.0 percent rate of youth inactivity is the highest of the 48 cards carrying the overlay. Rent buys the state; it does not buy a labour market.
5. Geography and infrastructure
Addis Ababa sits at roughly 2,350 metres on a highland plateau, and the sea is about 750 kilometres away and 2,350 metres down, across the Afar depression, one of the hottest inhabited places on earth. Everything follows: the interior is temperate, fertile and crowded, and the route to the world is a single hot descent through a foreign country.
The railway. The Addis Ababa to Djibouti standard-gauge line, 752 kilometres of electrified track, was built by two Chinese state contractors, financed largely by the Chinese export-import bank at a cost of about $4.5 billion, and began commercial operation in January 2018, replacing a colonial metre-gauge line that had ceased to function. Freight passed 2 million tonnes in 2023, with about 2.3 million expected in 2025, and about 95 percent of revenue is cargo rather than passengers (Global Infrastructure Hub, 2020). The debt was renegotiated in 2018 and 2019, extending repayment from ten to thirty years, and Djibouti’s share sat inside the moratorium of 2023 (International Monetary Fund, 2025a). A railway that works and cannot service its debt on the original schedule is not an engineering failure; it is a mismatch between the tenor of the loan and the tenor of the traffic, which is the standard African infrastructure-finance problem stated in one asset.
The ports. Djibouti handles about 95 percent of Ethiopian foreign trade, and Ethiopian cargo is worth on the order of a quarter of Djibouti’s national income (World Politics Review, 2024). The complex is several ports: the old city port, the Doraleh container terminal, the Doraleh multipurpose port with a stated capacity of 8.2 million tonnes a year and 220,000 twenty-foot equivalent units, and the smaller port at Tadjoura built for Afar potash (Port de Djibouti, 2026). The container terminal is the pole’s largest legal dispute: the government terminated its Emirati operator’s concession in 2018 and handed the terminal to a Chinese state port group, and arbitration has run ever since, with awards against Djibouti of roughly $685 million unpaid and further claims of about $1 billion outstanding by DP World’s account of the October 2025 ruling (DP World, 2025b).
The alternatives. Ethiopia’s search for a second outlet is the pole’s live geopolitical question. A memorandum signed with Somaliland on 1 January 2024 would have leased 20 kilometres of coast for fifty years in exchange for commercial access at Berbera and, reportedly, recognition; it produced a regional crisis, a Turkish-brokered declaration in Ankara at the end of that year, and no port (International Crisis Group, 2024). Berbera has since been rebuilt by the same Emirati operator that lost Doraleh, with a deep-water quay and a road corridor into eastern Ethiopia, which makes the Horn’s port map one commercial rivalry with two governments attached (DP World, 2021).
Power. The one network here that genuinely works as a network is electricity. Ethiopia exports power to Djibouti and Sudan, signed a purchase agreement with Kenya in 2022 with full transmission from November that year, and more than 96 percent of its own generation is hydroelectric (Bogale, 2022); it has since begun trial transmissions to Tanzania (Le360 Afrique, 2025). A pole in which the landlocked partner sells electrons and the coastal partner sells passage is an unusually clean division of comparative advantage, and the one part of the relationship neither side has litigated.
6. Megaprojects and cities
Both cards carry an agglomeration population, Addis Ababa at 4.9 million and Djibouti city at 0.6 million, against 8.4 and 0.8 million in 2050. Africapolis counts built-up continuity rather than administrative boundaries, so these are smaller than the metropolitan figures usually quoted and the rule is named wherever the number is used, which matters more than usual here: Addis Ababa’s own count is a projection off the census of 2007, so the built-up reading and the national one are both estimates resting on an eighteen-year-old enumeration. Read this section for what is being built.
The dam. The Grand Ethiopian Renaissance Dam was inaugurated on 9 September 2025 after fourteen years of construction, at a cost of about $5 billion, with an installed capacity of 5,150 MW and an expected annual output of about 15,700 GWh, making it the largest hydroelectric plant in Africa (Webuild Group, 2025). Two things matter more than the megawatts. It was paid for by bonds sold to citizens, payroll deductions from public employees and diaspora contributions, with no multilateral or Chinese project finance for the dam itself, which is why it survived the default. And in its first full year it supplied 51.5 percent of the state utility’s generation (Diop, 2026), while electricity exports earned a little over $118 million in 2024/25, the year before (Le360 Afrique, 2025). A dam is capital-intensive and employs almost nobody once built: a term-three asset in a country whose problem is term two.
The parks. Ten publicly built industrial parks, of which Hawassa is the flagship: a $250 million single-industry apparel campus on 130 hectares, opened in July 2016 with an American apparel group as anchor tenant and expected to create about 60,000 jobs (Abiye, 2016). The programme has attracted $740 million of foreign investment from more than sixty investors, employs more than 150,000 people, mostly young women, and produced about $500 million of manufactured exports in 2023; both halves of the verdict are true, since this is by a wide margin the largest industrial-estate programme in Sub-Saharan Africa and it has produced a manufacturing sector still worth about 5 percent of national output against a plan that called for 18 percent by 2025 (World Bank, 2022b).
What the preference did. The United States removed Ethiopia from its African trade preference on 1 January 2022 over the conduct of the war. The central bank’s count of the consequence was about 11,500 jobs lost and eighteen foreign companies leaving, 4,321 of those jobs at Hawassa, 2,885 at Mekelle and 1,097 at Bole Lemi (National Bank of Ethiopia, 2026). That is this book’s jobs thesis compressed into one year: a park built for 60,000 workers and emptied further by a decision taken in a foreign capital about a war fought in a different part of the country, which employed 28,000 in November 2023 (Mulat, 2024). The preference lapsed at the end of 2025 for every other African beneficiary too, which Chapter 33 takes up. A development strategy whose terminal market access is renewed by a foreign legislature every few years is not a strategy; it is a lease.
The airport and the capital. Ethiopian Airlines broke ground in January 2026 on a new airport at Abusera, about 45 kilometres from the capital, budgeted at $12.5 billion, with four runways and an eventual capacity of 110 million passengers a year; about $4.8 billion had been pledged at groundbreaking, of which the airline put up $3.2 billion of equity and the regional development bank $500 million of debt (African Development Bank, 2025c). It is the largest single project announced anywhere in Africa this decade and deserves the discipline this book applies to every megaproject: what is the traffic forecast, who bears the demand risk, and what happens to the sovereign if it is wrong. Meanwhile the capital is being rebuilt by demolition. The corridor development project approved in February 2024 rebuilt 40 kilometres of the central city in a first phase completed that September and launched a second in October covering 132 kilometres and 2,817 hectares, and Amnesty International documented at least 872 people forcibly evicted from two sub-cities in November 2024 alone, with satellite imagery confirming about 29 hectares of dense built-up area cleared (Amnesty International, 2025). A boulevard is not a labour market, and Chapter 22 carries the argument.
7. Firm profiles
Ethiopian Airlines Group
Ethiopian Airlines is the most successful state-owned enterprise in Africa and the strongest counter-example this book has to its own scepticism about state ownership. In the year to June 2026 the group reported revenue of $9.1 billion, up 20 percent, carrying 20.7 million passengers and 897,000 tonnes of cargo on a fleet of about 170 aircraft, with a stated plan of $25 billion of revenue and 67 million passengers by 2035 (Ethiopian Airlines Group, 2026). It has been profitable through a pandemic and a civil war and is by a wide margin the largest African carrier.
The mechanism is what makes it instructive. A hub carrier earns by moving people and freight between other people’s countries through one airport, which means hard currency from customers who never enter Ethiopia and are untouched by Ethiopian macroeconomics: in the vocabulary of section 3, an activity whose returns the owner can appropriate without an import licence. It also has the property this book keeps finding in African champions, being capital-intensive relative to its payroll, so that its excellence has not moved the second term of the identity. It is not a jobs programme, and no plausible expansion of it would be.
Safaricom Ethiopia
The second profile tests whether the settlement of section 4 has really changed, because it is the first serious foreign entrant into a sector the state monopolised for a century. A consortium led by the Kenyan operator won a licence in 2021 for $850 million, paid a further $150 million for permission to run mobile money, and has raised about $2.65 billion in all; by June 2026 it had 14.7 million active customers and 5.69 million active mobile-money users, annual losses in the year to March 2026 had fallen to 21.2 billion Kenyan shillings, KSh, less than half the previous year’s, and the Kenyan parent’s cumulative investment stood at KSh159.6 billion, about $1.234 billion, with break-even targeted for 2027 (Safaricom PLC, 2026).
The entry itself is evidence for the reform: a government that had refused for a century to let anyone else own a network let one in and then floated the currency, which is what a foreign investor in a network business actually needs. The losses are evidence for section 3, since the returns were real and the ability to repatriate them was not. And mobile money here is being built against an incumbent state operator and a bank-led payments system rather than into a vacuum, which is why the Kenyan template has not replicated itself across the border. The largest foreign direct investment in Ethiopian history is a bet on the reform of section 3 rather than on the demography of section 1.
8. What the experiments say
The factory job is not the prize the model assumes it is
Ethiopia is one of the most heavily experimented-on labour markets in Africa, and its experiments were run on exactly the workers the parks were built for.
Factory work, offered at random, did not raise incomes. Blattman and Dercon (2018) worked with five Ethiopian firms, randomising applicants into an offer of an industrial job, an entrepreneurship package of about $300 with business training, or neither. The job offer doubled exposure to industrial work, but most who took it quit within months, and after a year there was no effect on employment or income; exposure significantly increased reported health problems. The entrepreneurship arm raised earnings by about 33 percent. The five-year follow-up found the pattern persisting: a factory job served as insurance against a bad shock rather than as a career, and when the barrier to self-employment was relieved applicants preferred to work for themselves (Blattman, Dercon and Franklin, 2022).
Search frictions are real, and relieving them moves the worker rather than the vacancy. Franklin (2018) randomly gave unemployed young people in Addis Ababa the bus fare to look for work in the centre of the city; search intensity rose, formal methods were used more, and treated jobseekers were more likely to end in permanent jobs. Abebe, Caria, Fafchamps, Falco, Franklin and Quinn (2021) ran that transport subsidy against a two-day workshop helping applicants document and certify skills employers could not otherwise observe. The subsidy raised search intensity, the workshop raised search efficacy, both helped most among the most disadvantaged, and both worked by fixing information and distance rather than by creating a job.
Together these are awkward for the parks and instructive for the identity. The recipe assumes a factory job is a rung: worse than what comes next, better than what came before, worth holding. At the wages and conditions actually on offer it was not better than what came before, which is why the second term did not move even where the first and third did. That is not an argument against industrialization but an argument that the rung has to be worth standing on, and that the wage at which a park attracts capital and the wage at which it keeps a worker are two different numbers with a currency regime sitting between them.
9. Climate exposure
Three exposures bind here, each attached to a different one of the pole’s assets.
Drought, on the workforce. Between late 2020 and 2023 the Horn of Africa recorded five consecutive failed rainy seasons, the worst drought in forty years, leaving more than 20 million people acutely food insecure and killing millions of livestock across Ethiopia, Kenya and Somalia, with an attribution analysis finding the event roughly a hundred times more likely because of human-caused warming (World Weather Attribution, 2023). This matters to the identity and not only to the humanitarian ledger: the falling employment ratio of Table 29.1 describes a labour force still mostly agricultural and pastoral, and a drought of that magnitude destroys the asset that employment consists of. Chapter 23 takes up the safety-net programme built to absorb it, the largest in Africa outside South Africa.
Hydrology, on the dam. The pole’s largest single asset is a reservoir on a river whose flow varies year to year and is claimed by two downstream states. Egypt has objected since construction began, no binding agreement on filling or on drought-year operation has been reached, and the 2025 inauguration changed the facts on the ground rather than the dispute (Al Jazeera, 2025). A country that has concentrated its generation, its export hopes and a decade of public saving in one structure has taken a hydrological position as well as a diplomatic one, and a run of low-flow years would hit the export line, the industrial tariff and the trade balance at once.
Heat and water, on the coast. Djibouti receives roughly 150 to 165 millimetres of rain a year, has no permanent rivers, and has renewable water of about 185 cubic metres per person a year, deep inside the range agencies call absolute scarcity, with summer highs above 40 degrees Celsius (World Bank, 2023b). Its fresh water arrives by pipeline from Ethiopia and by desalination, so the coastal partner depends on the landlocked one for water in exchange for the sea: stable while both sides need each other, and an obvious pressure point if either stops.
10. Data quality
Data quality is a layer in this book rather than a caveat, so it gets its own table.
| Country | Last census | Last GDP rebasing | Last labour-force survey | Statistical performance score | Confidence flag |
|---|---|---|---|---|---|
| Ethiopia | 2007 | none recorded | 2021 | 61.7 | low |
| Djibouti | 2024 | none recorded | 2025 | 38.1 | medium |
Sources: the national statistical offices for census, rebasing and survey years; the World Bank’s Statistical Performance Indicators for the score; the confidence flag is this book’s own rule, described on the About the data page.
The anchor is Ethiopia’s census of 2007 and the round due in 2017 that has been postponed ever since; the card says so on its face. Every Ethiopian population figure here, and therefore every figure per head, is a projection carried forward for nearly two decades from an enumeration taken before the parks, the railway, the urban expansion of the 2010s and two internal wars that moved millions of people. Term one, which for most countries is the term nobody has to earn, is here the term with the largest measurement error.
The second gap is the national accounts: no rebasing year could be sourced for Ethiopia at all. The published series runs on a base year fixed in the middle of the last decade, and a change of base has been announced without being published. Chapter 1’s argument about rebasing applies with unusual force to a country whose structure of production changed this fast, because a stale base undercounts precisely the activities that grew. Whether Ethiopia’s 5.91 percent output-per-worker growth is 5.9 or something rather different is a question this book cannot settle, and a reader who suspects that the highest measured productivity growth on the continent belongs to the country with the largest unmeasured structural change is asking fairly.
The labour side is better and still thin. Ethiopia’s 2021 labour force and migration survey was the country’s first integrated survey of its kind, and it is five years old. Djibouti is the mirror image: a census in 2024, a first nationally representative labour survey in 2025, and still the fourth-lowest statistical performance score of the fifty-three cards that have one, at 38.1. A country can enumerate itself and still have almost no statistical system around the enumeration, which is why the flag reads the system rather than one input.
What the numbers can bear, then: the ordering is robust, and the finding that Ethiopia has the continent’s fastest third term beside its worst second term does not depend on any single series, because both are extreme rather than marginal. The levels are weaker, and a precise Ethiopian figure per head, a metropolitan population for Addis Ababa and any Djiboutian series before 2024 should each carry the qualification. The within-and-between split ends in 2018, so it describes the decade before the war rather than the decade the identity covers.
11. Data sources
- UN World Population Prospects 2024, medium variant: every population figure here, national rather than metropolitan, and the working-age series behind term one. Ages 15 to 64 throughout.
- ILOSTAT modelled estimates, November 2025: terms two and three and the wage-employment, non-agricultural, youth-inactivity, informality and employment-by-sex overlays, modelled rather than surveyed, which is why section 10 lists the survey years beside them.
- IMF World Economic Outlook, April 2026: output levels, output per head, observed growth and the five-year forecast.
- Groningen Growth and Development Centre, Economic Transformation Database: the within-and-between split of term three, for Ethiopia only, over 2008 to 2018.
- World Bank International Debt Statistics, 2025 release, and the Boston University Chinese Loans to Africa database, 2000 to 2024 release: the debt stock and its creditor composition, in which bilateral lending is not split by creditor country, and the Chinese column, which is a cumulative flow of commitments rather than a stock.
- World Bank Statistical Performance Indicators, the Ethiopian Statistical Service and the Institut National de la Statistique de Djibouti: the data-quality table (Ethiopian Statistical Service, 2021).
- IMF country reports and debt sustainability analyses for Ethiopia and Djibouti: the programme, the default and the restructuring narrative, and the Djiboutian debt assessment.
- National Bank of Ethiopia, Ethiopian Electric Power and Webuild, with the Ethiopian press and LSE reporting on the parks: export earnings, reserves, the park record, generation and the dam.
- Port de Djibouti and the port operators: terminal capacity and the concession dispute.
- Company reports: Ethiopian Airlines Group and Safaricom.
12. Exercises
Discussion questions
Ethiopia posts the highest output-per-worker growth and the largest fall in the employment ratio of any card in this book. Give the two most plausible accounts of how both can be true at once, one a measurement story and one a real story, and say what observation available before 2030 would distinguish them.
Section 3 argues that the binding constraint here was the availability of foreign exchange and the state’s allocation of it rather than the absence of infrastructure. Construct the strongest case against that reading: what would have to be true for infrastructure, or for human capital, to bind despite a dam, a railway and ten industrial parks, and how would you test it?
Dercon uses Ethiopia to argue that a development bargain is a bargain about growth rather than about power. Ethiopia then fought a war that cost roughly a fifth of the economy it had built. Argue for one of two readings: that the war shows the bargain was never a bargain, or that a growth bargain is genuinely separable from a political one and can be destroyed by it. Then say which reading would change how you assess a settlement elsewhere in Part VI.
Try it
Open the three cards side by side: Ethiopia, Djibouti and Kenya, in that order. Read down the identity block, where the three columns share one scale, then the overlays, then the data-quality block. Write one paragraph on a single question: Ethiopia and Kenya are the two large economies of the Horn, one of which ran a state-led industrialization and one of which did not, so which has had the better decade, and does your answer survive the confidence flags? Then say what you would need to know about Ethiopia’s census and base year before quoting its figures per head.
Data exercise
Download all fifty-four cards from the country cards page on this site, as cards.csv or cards.json, and build a table with these fields: identity.working_age_pop_growth, identity.employment_to_wa_growth, identity.output_per_worker_growth, identity.gdp_growth_observed, overlays.wage_employment_share, overlays.output_per_worker_within, overlays.output_per_worker_between and data_quality.confidence_flag. Then do four things. First, reproduce the two rows of Table 29.1 and confirm that the three terms sum to implied growth and that implied growth is close to observed. Second, rank the cards by output-per-worker growth and again by employment-ratio growth, count how many appear in the top ten of the first and the bottom ten of the second, and say whether Ethiopia is an anomaly or an extreme case of a general pattern. Third, restrict to the cards carrying the within-and-between split, test whether a large within-sector component goes with a falling employment ratio, and say honestly what a sample of that size can support. Fourth, drop every card whose confidence flag is low, note that Ethiopia is one of them, and say which conclusions here survive. Treat nulls as missing, never as zeros.