16. Finance and Fintech
About $1.4 trillion moved through mobile money in Sub-Saharan Africa in 2025, roughly two thirds of the global total, on a continent that holds more mobile-money accounts than any other (GSMA, 2026). In the same year the banking system of the continent’s most populous country lent its entire private sector less than a fifth of national output (World Bank, 2026g). Both numbers describe the same financial system. This is the one part of the African economy that leapfrogged rather than caught up, and it is worth being precise about what it leapfrogged: not banking, but the branch.
Learning Objectives
After reading this chapter, you should be able to:
- Say what African finance is for, and where it sits in the identity.
- Describe how a mobile-money float actually works: agents, trust accounts, interoperability, and the regulator.
- Distinguish payments from credit, and explain why the first scaled and the second has not.
- Read a bank’s balance sheet in a country where the sovereign is the best borrower in the market.
- Trace where a pension pool’s money goes, and say what that means for the cost of local capital.
Prior work: the mobile-money and continental-payments material is set out in the companion volume, The New Regional Economics, chapters 13 and 14 (Wilse-Samson, 2026), and cited here rather than repeated.
1. Overview
Finance moves no identity term of its own. It is an intermediary, and its contribution shows up in other sectors’ output per worker, or fails to. So the question is not how large the sector is but where the money goes. Payments were solved. Credit to firms was not: banks hold government paper because the sovereign pays more than the small manufacturer and defaults less often, which is a rational allocation and a growth problem at once. The balance-sheet lens of Chapters 1 and 21 is, at bottom, a question about this sector.
| Identity term | What this sector does to it | Value |
|---|---|---|
| One: working-age population | Nothing | On the cards |
| Two: employment-to-working-age ratio | Small directly; the agent networks are the largest visible effect, and they are self-employment | Continental median minus 0.15 percent a year |
| Three: output per worker | Indirect and decisive: whichever firms get credit are the ones that can grow | Continental median 0.74 percent a year |
Terms are annual growth rates over 2014 to 2024, medians across the cards carrying each field. Sources: UN World Population Prospects 2024 for term one; ILOSTAT modelled estimates, November 2025, for terms two and three; via the country cards.
Chapter 9 called finance the third ingredient of the East Asian recipe: not cheap money, but money pointed at the firms that export. That is a claim about allocation rather than depth, and it is the claim this chapter tests. Table 16.1 sets the ten countries whose financial systems the chapter discusses, together 47.7 percent of Africa’s people and 56.0 percent of its output, against the continental middle.
| Country | Term one | Term two | Term three | Wage employment (percent) | Non-agricultural employment (percent) | Confidence |
|---|---|---|---|---|---|---|
| Kenya | 2.94 | -1.17 | 2.84 | 35.1 | 53.5 | high |
| Nigeria | 2.90 | 0.29 | -1.94 | 13.6 | 65.9 | low |
| South Africa | 1.61 | -0.45 | -0.48 | 82.7 | 94.6 | high |
| Egypt | 1.96 | 0.07 | 2.26 | 72.9 | 82.0 | high |
| Morocco | 1.10 | -0.45 | 1.88 | 59.6 | 71.7 | high |
| Ghana | 2.52 | -1.56 | 3.48 | 32.2 | 64.8 | medium |
| Ethiopia | 3.46 | -1.58 | 5.91 | 15.4 | 39.0 | low |
| Mauritius | -0.24 | 0.61 | 2.02 | 81.8 | 95.1 | high |
| Côte d’Ivoire | 2.88 | 0.11 | 2.90 | 28.7 | 53.7 | medium |
| Rwanda | 2.83 | 0.65 | 3.26 | 59.1 | 63.5 | high |
| Median of the cards | 2.89 | -0.15 | 0.74 | 31.0 | 59.0 | 11 high, 20 medium, 20 low |
Table 16.1: The ten financial systems this chapter discusses. Identity terms are annual growth rates in percentage points over 2014 to 2024; the two overlays are levels. The median row is taken column by column across the cards carrying each field, so it is not a country. Sources: UN World Population Prospects 2024 for term one; ILOSTAT modelled estimates, November 2025, for terms two and three and the overlays; the confidence flag from the country cards.
Two columns matter. Wage employment runs from 13.6 percent in Nigeria to 82.7 in South Africa: a retail customer in South Africa has a payslip, in Nigeria she does not, and a lender that requires one is lending to about an eighth of the workforce. Beside it, Ethiopia posts the table’s fastest third term at 5.91 percent a year with the second-lowest wage share, and Nigeria posts minus 1.94 percent. Neither country has a financial system that could have caused either number. On the evidence available, finance is downstream.
The cards carry no sector fields, here as everywhere in Part III: no financial-sector value added, no bank employment, no credit series. What they do carry is the sovereign side of the balance sheet. The field for Eurobonds outstanding is empty on every card, and the reason is not that nobody has counted. An instrument-level register of African sovereign issuance exists and covers all fifty-four countries; it licenses its data for non-commercial use only, and a book that may be sold cannot build a column on it, so the field stays empty by decision rather than for want of a source. The bond line inside the external-debt creditor breakdown is filled on 23 of the 54, and it is the debt statistics’ own bondholder category rather than a count of Eurobonds: South Africa’s bondholders account for $77.4 billion of a $175.9 billion external stock, Ethiopia’s for $1.0 billion of $36.5 billion. Chapter 21 owns what those bonds cost. This chapter owns who bought the domestic ones.
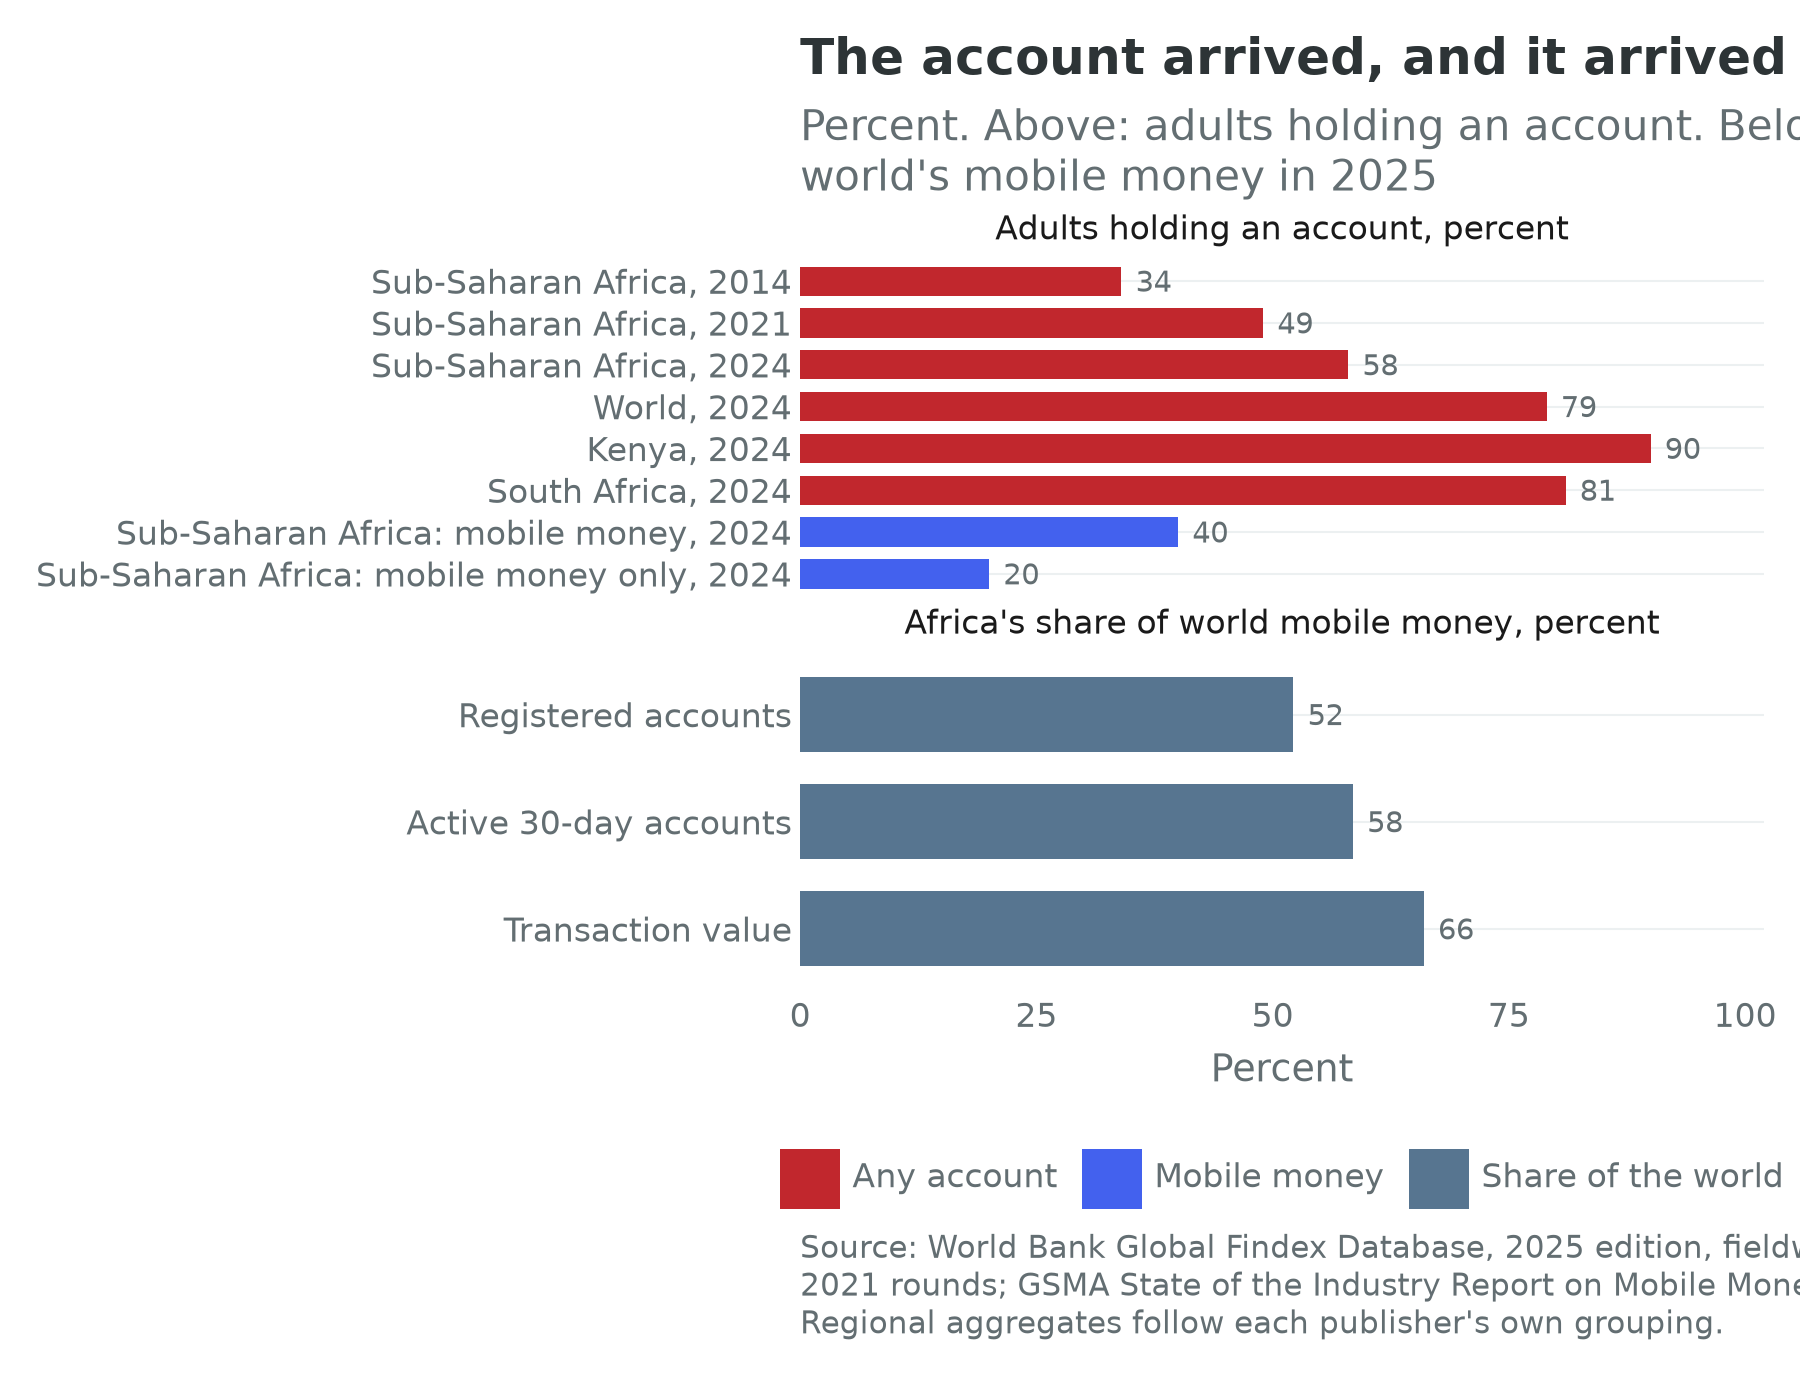
The access story is genuinely good and deserves stating without hedging first. Account ownership in Sub-Saharan Africa rose from 34 percent of adults in 2014 to 49 percent in 2021 and 58 percent in 2024, against a world figure of 79 percent; 40 percent of the region’s adults hold a mobile-money account, the highest share of any region on earth, and for 20 percent that wallet is the only financial account they have, with Kenya at 90 percent of adults and Ghana and South Africa at 81 percent each (World Bank, 2025g). Nothing in African development has moved that far that fast.
Now the hedge, which is the rest of the chapter. An account is an instrument for receiving, holding and sending money. It is not credit, it is not insurance, and it is not a claim on a productive asset. The lower panel of Figure 16.1 makes the point from the other side: Africa’s share of the world’s mobile money rises from about 52 percent of registered accounts to 58.5 percent of active accounts to 66 percent of transaction value (GSMA, 2026). The continent is where this technology is actually used, and the part of the system that was transformed is the part that moves money, not the part that allocates it.
Finance in two worlds
In the labour-abundant world of Chapter 1, this is a chapter about firms. A financial system’s job is to take a household’s savings and hand them to a manufacturer who will hire a shift, and every argument below about crowding out, collateral, pension mandates and rate caps is about whether that transfer happens. On that reading the sector’s failure is the central one: Africa built a magnificent payments rail on top of a credit system that reaches a small minority of its firms.
In the labour-redundant world the question gets harder. If income arrives as rent rather than as wages, a financial system’s job is not to lend to the maize miller; it is to collect a rent, invest it, and distribute the proceeds to households at low cost, which describes a sovereign fund plus a payments network rather than a banking system. Chapter 8 makes the monetary version of that argument; the version that belongs here is about the asset side. Somebody has to lend to the data centre and finance the solar farm, and on current arrangements that somebody is a development-finance institution, a Gulf sovereign fund or a Chinese policy bank, none of them African and all taking the return away, while the continent’s largest domestic capital pools are confined by prudential rule to the government paper this chapter complains about. Whether those pools end up owning the machines is a policy choice available now, and it is the question the chapter leaves open.
2. How the industry works
The bank balance sheet where the sovereign borrows at home
Start on a Tuesday morning in a treasury department in Nairobi, Accra or Lagos. The bank funds itself with current-account and savings deposits that are cheap, short and, in a country with an unstable currency, prone to leave. It has two serious places to put them. The first is a treasury bill: it settles the same day, needs no credit officer, no site visit, no collateral valuation and no lawyer, carries a zero risk weight under the Basel rules as most African supervisors have adopted them, so consumes no capital, can be repurchased at the central bank in a squeeze, and usually yields more than the bank could safely earn on a corporate loan. The second is a five-year loan to a maize miller, whose collateral is a building on land with a contested title, in a registry Chapter 22 describes, and enforcing it means a court queue measured in years. That loan carries a full risk weight, so it consumes capital the bank must raise from shareholders, and the credit file has to be built from nothing because the miller has no audited accounts and the bureau record, where there is a bureau, covers a fraction of borrowers.
The choice between them is not a failure of nerve. It is the correct answer to the question the country has posed. This is crowding out, and the description fits Africa in a way it often does not elsewhere, because the crowding happens through the quantity of credit rather than its price. The clearest recent illustration is Kenyan: private-sector credit shrank by 1.4 percent in the twelve months to December 2024 (People Daily, 2025), banks held 44 to 46 percent of the government’s domestic securities in March 2025 (Wandera, 2025), and in 2025 they increased their holdings of government securities by 18.2 percent while loans and advances to customers grew 6.6 percent (Kajilwa, 2026). The pattern holds in smaller systems: in Guinea, banks’ total sovereign exposure rose from 15 percent of assets at the end of 2014 to almost 30 percent by December 2023 (International Monetary Fund, 2024).
Figure 16.2 shows what is left over. Private credit runs at 89.7 percent of GDP in South Africa, which is the world figure of 89.5 percent to within a rounding, and at 80.5 percent in Morocco, 31.8 percent in Kenya, 27.6 percent in Egypt, 13.1 percent in Nigeria and about 9 percent in Ghana (World Bank, 2026g). A factor of nearly ten separates the top of that list from the bottom, on one continent, and it tracks income per head only loosely: Egypt is richer per head than Kenya and lends less, and Ghana is richer per head than Nigeria and lends about seven tenths as much.
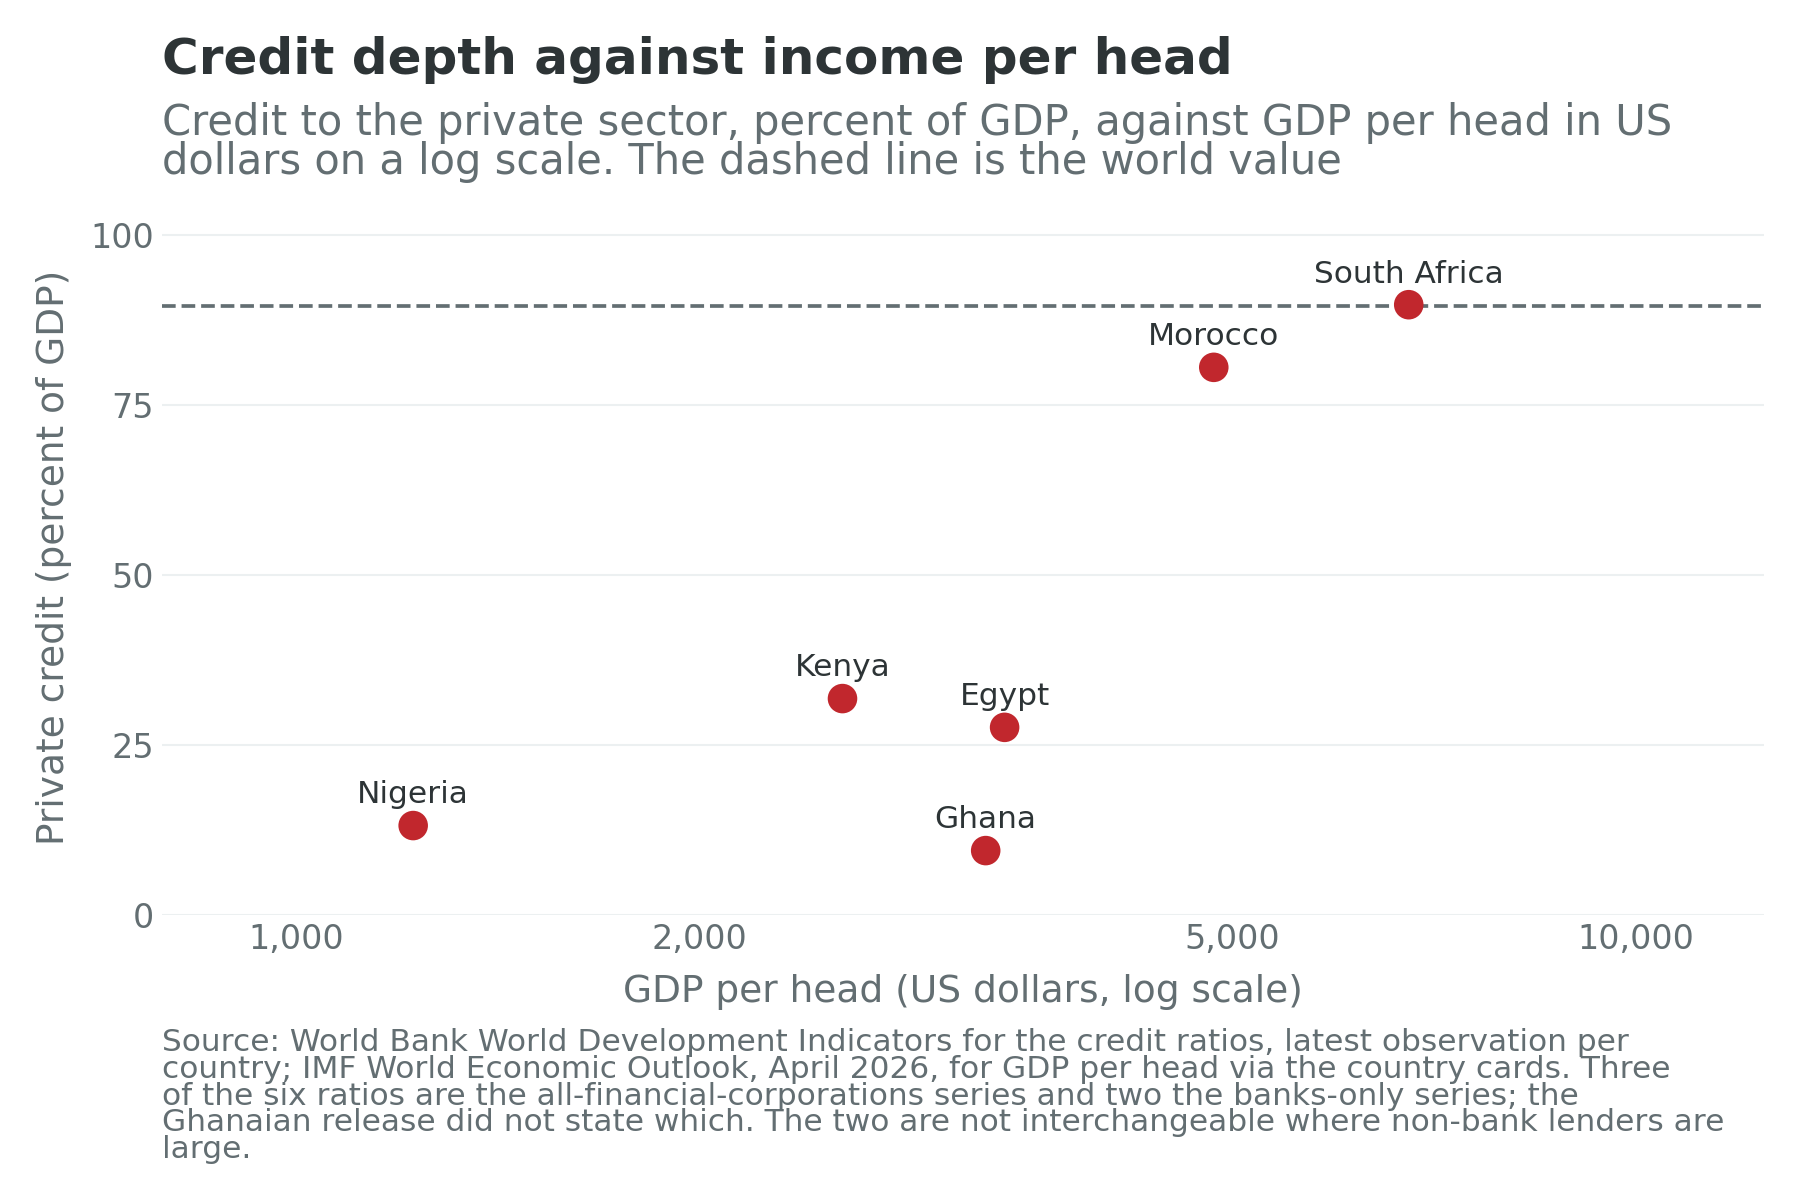
Ghana shows what the sovereign asset costs when the sovereign stops paying. It defaulted on its external debt in December 2022 and completed a domestic debt exchange in February 2023, in which holders of local-currency government bonds took new bonds with longer maturities and lower coupons (Ghana, Ministry of Finance, 2023; International Monetary Fund, 2026d). Chapter 8 records what that did to the central bank’s balance sheet. What belongs here is what it did to everybody else’s: domestic banks, pension funds and insurers were the holders, they took the loss in a single accounting period, several banks needed recapitalisation, and the ratio in Figure 16.2 is what remained. That is the part of the crowding-out argument its critics usually miss. Holding government paper is prudent for one bank and fragile for a banking system, because the correlation across banks is one. A country whose banks are heavily exposed to their own sovereign has converted a fiscal problem into a banking problem in advance.
The wallet, the agent and the float
A mobile-money system is a ledger of electronic value plus a distribution network for turning that value into cash and back. The ledger is easy. The network is the business, and it is made of people. An agent is usually a shopkeeper who already sells something else; she buys electronic value, e-float, from the operator with her own cash, and when a customer deposits she takes his notes and sends him e-float, so her cash rises and her float falls, with the reverse on a withdrawal, earning a commission on each leg. Her real job, and the reason the network is hard to build, is liquidity management: an agent in a market town on payday runs out of e-float, an agent by a bus station at month end runs out of cash, and rebalancing means a trip to a bank branch or a superagent that costs time and carries robbery risk. The operators that scaled solved rebalancing, usually by layering aggregators and master agents above the shopkeepers and paying commissions that make the trip worth taking. Almost everything told as a technology story about mobile money is downstream of that logistics problem.
Behind the ledger sits the float. Every unit of e-money in circulation is matched by real money the operator holds in a trust account at one or more commercial banks, the legal device that lets a telecommunications company issue something that behaves like a deposit without being one. Three contested consequences follow. The float is a monetary aggregate no central bank designed, as Chapter 8 notes. The trust account is not deposit insurance, so if the operator or its bank fails, who bears the loss is answered by trust law rather than a resolution regime. And the float earns interest, which some jurisdictions require to be passed to customers or a foundation and others let the operator keep, a difference worth a great deal and settled by a regulator rather than a market.
Interoperability is the next layer and the slow one. Two wallets on two networks are, absent a switch, as separate as two banks in two countries, for the reason Chapter 8 gives about cross-border payments, and the fix is a national switch routing wallet-to-wallet and wallet-to-bank instructions, usually mandated by the central bank. The inclusion evidence suggests it works: Egypt’s account ownership grew by about 76 percent after it launched an instant payment network in 2022, against about 5 percent in Ethiopia in the years after its own switch, and Ghana’s roughly doubled after its cross-domain system went live (World Bank, 2025g). The cross-country comparison is not clean, but the mechanism is obvious. A payment instrument becomes worth holding when it reaches everybody.
Why credit did not follow
Payments scaled because the constraint was distribution and the answer was a shopkeeper. Credit has not, because the constraints are information and collateral, and only one of them has an answer. The information problem has a partial one, and it is the most interesting thing happening in African finance: a wallet generates a record of how much a person receives, from whom, how regularly and what is left at month end, which is a credit file for people who have never had one, and is why every large operator now has a lending product attached. In Kenya these run from small savings-and-loan accounts to an overdraft that completes a transaction when the wallet is short and charges a fee for the days the balance is negative. They are genuinely useful, and they are small and short: a few thousand shillings for a few weeks, at rates that annualise alarmingly and are rarely quoted annually. Two arguments run about them. The first is over-indebtedness, since digital credit is easy to take, easy to roll and reported to the bureau, so a household that misses a payment on a tiny loan can be listed and locked out of formal credit entirely, and Kenyan listings ran into the millions before the government ordered small defaults removed. The second is what the lending is for: a bank loan to a firm buys a machine, while digital credit overwhelmingly smooths consumption and working capital. That is worth having, and Section 10 says so. It is not capital formation.
The collateral problem has no answer of comparable elegance. Movable-collateral registries, which let a firm pledge equipment, receivables or livestock, are the most promising piece of plumbing in the sector and still need a functioning court behind them. Credit guarantees shift risk to the state and tend to be captured by borrowers who would have been lent to anyway. Leasing works where the asset can be repossessed and resold, which is why African equipment leasing is mostly vehicles.
Three further pieces belong in the mechanics. Remittances are the largest external flow to African households and Chapter 8 prices the corridors; what belongs here is that the wallet has collapsed the retail price where it reaches while leaving the wholesale currency spread, the larger cost, intact, and that a household receiving a regular transfer from abroad is a creditworthy household almost nobody lends to. Islamic finance is real and under-covered: sovereigns from Egypt, Morocco, Nigeria, Senegal, Côte d’Ivoire and Togo have raised money through sukuk, certificates structured around ownership of an asset rather than a debt, and Ethiopia and Kenya licensed interest-free windows for savers who had stayed out of banking on religious grounds. And microfinance, the oldest answer to the credit problem, has the most evidence against its strongest claims, which Section 10 reports; the rotating savings clubs beneath it belong to Chapter 6 and supply commitment rather than credit.
3. Industry structure
Banks, by who owns them
State-owned banks are large in Egypt, Ethiopia, Algeria and much of Francophone Africa: they finance the state and its projects, are the most exposed to the sovereign, and are often the largest banks in their markets. Ethiopia is the limiting case, with a state commercial bank of overwhelming size, a policy bank beside it and, until recently, no foreign entrant at all, which Chapter 29 reads as the financial expression of a developmental settlement. Domestic private banks are the growth story of the past two decades, showcased in Nigeria and Kenya: founder-led, aggressive about branch and agency expansion, increasingly regional.
Pan-African banks are the genuinely new form. Ecobank, headquartered in Lomé, operates in more African countries than any other bank; Standard Bank runs a network out of Johannesburg; Attijariwafa Bank has built a West and Central African book out of Casablanca, which Chapter 28 profiles; Nigeria’s Access Bank and United Bank for Africa and Kenya’s Equity Group and KCB have each pushed into a dozen or more markets. The strategic logic is that a bank following its clients across a border beats a foreign bank arriving cold, and that a group can move liquidity from a surplus market to a deficit one. The supervisory logic is less comfortable, since a bank with subsidiaries in a dozen jurisdictions is supervised by a dozen regulators with no consolidated view. Meanwhile foreign banks have retreated, with Barclays selling down its African business and several European groups leaving retail for corporate and trade finance; the correspondent-banking withdrawal of Chapter 8 is the wholesale version of the same movement, and the vacancies were filled by pan-African and domestic private banks, which is good for African ownership and ambiguous for supervision.
The telecommunications companies, read as financial firms
The second column of the industry is not in the banking statistics at all. MTN’s fintech arm reached 69.5 million monthly active mobile-money customers and 23.3 billion transactions worth $500.3 billion in 2025 (MTN Group, 2026), and MTN Ghana ended the year with 19.3 million active mobile-money accounts in a country of 34.4 million people (MTN Ghana, 2026). Airtel Money and Orange Money run comparable networks across East, West and Central Africa, and Vodacom’s Congolese wallet is the largest financial network in a country whose banking system Chapter 31 describes. Chapter 17 owns these firms as telecommunications operators. The point here is what they are on the other side of the ledger: retail deposit-takers in substance without being deposit-takers in law, with distribution no bank could afford to build and credit books that are, by banking standards, negligible.
The fintechs, and what a payments company earns
Beneath the operators sits a layer of firms that process the transaction without owning the customer: Interswitch built Nigerian card and switching infrastructure, Flutterwave and Paystack sell payment acceptance to merchants, OPay and PalmPay run wallets at enormous scale in Nigeria, Chipper Cash moves money across borders for individuals, Wave has attacked the price of a domestic transfer in Francophone West Africa, and M-Pesa Africa carries the Kenyan product into other markets.
The economics are widely misunderstood. A payments company earns a fraction of what it moves: M-Pesa’s Kenyan revenue of KSh 182.7 billion on KSh 41.68 trillion of transaction value in the year to March 2026 is a take rate of about 0.4 percent (Safaricom, 2026). That is a good business at enormous volume and a bad one at small volume, which is why payments consolidates and why the number of viable wallets per country is one or two rather than five. Two thirds of the world’s mobile-money value crosses a continent whose payments industry earns a small fraction of what a mature banking system earns from its customers.
The institutional investors, and the marginal lender
The largest pools of domestic long-term money in Africa are pension funds. South Africa’s private pension and life-assurance industry is by a wide margin the largest, and it is why Chapter 25 can say that South African sovereign borrowing is overwhelmingly domestic and in rand, R; Nigeria’s contributory scheme, profiled in Section 9, is the largest in West Africa, and Kenya’s and Namibia’s are large relative to their economies. What the pools do with the money is the crux. Prudential rules almost everywhere set a floor on government securities or a ceiling on everything else, on the sound reasoning that a pension fund should not gamble with a retirement, so Africa’s largest savings pools are the second-largest buyer of the same paper the banks are buying. Very little reaches infrastructure, private equity or listed African equities outside South Africa, partly because the rules restrict it and partly because there is nothing to buy: an exchange with a handful of liquid lines cannot absorb a pension allocation, and an infrastructure project without a rated, sized, tradeable instrument attached is not investable by a fiduciary. Insurance is the thinner half of the story, since penetration outside South Africa, Morocco, Kenya, Namibia and Mauritius is very low, so households bear risks they could have pooled and the economy loses the long-dated liability that would justify a long-dated asset.
For anything long-dated, then, the marginal lender is not a bank, a pension fund or a bond market but a development-finance institution. The African Development Bank, Afreximbank, the Eastern and Southern African Trade and Development Bank, the Africa Finance Corporation, the American development finance corporation and the European bilaterals are the entities whose money actually appears in the capital stack of a port, a transmission line or a fertiliser plant, and Chapter 8 profiles Afreximbank as the institution that solved continental settlement by being willing to hold the imbalance. They do what a commercial market will not, at tenors it will not offer, and are therefore the price-setter for African infrastructure finance rather than a supplement to it.
One paragraph on the informal fringe, because Chapter 6 owns it. Almost no informal enterprise is financed by a bank; it runs on retained earnings, family, supplier credit and the savings clubs, with a moneylender in every market charging what monopolists charge. What has changed is that the informal firm now has a wallet, so it has a record, so it could in principle be lent to on the basis of what it does rather than what it owns. That has not yet become credit at scale, and the gap between the legibility and the lending is this chapter’s central puzzle.
4. Geographic distribution
Financial services concentrate more sharply than any other sector in this book, because their inputs are lawyers, regulators, exchanges and each other. Four cities do most of the work. Johannesburg is the continent’s only financial centre in the full sense: a deep bond market, a large exchange, a pension industry and the head offices of banks with continental networks, and Chapter 25 explains why that depth has not converted into growth. Casablanca is the deliberate one, built around Casablanca Finance City’s regulatory and tax offer, a flat 20 percent corporate tax for member firms and five years’ exemption for new ones (Casablanca Finance City Authority, 2022), and around a bank with real books in fourteen African countries besides Morocco (Attijariwafa Bank, 2025); Chapter 28 argues that the bank is what makes the district real. Nairobi is the innovation centre, with the most-copied payments product on the continent, a disproportionate share of its venture funding and an international-financial-centre authority formalising what already exists. Cairo has the largest banking system in North Africa and hosts Afreximbank, whose continental mandate has nothing to do with Egyptian conditions.
Three more places matter for reasons unrelated to size. Port Louis is a conduit rather than a centre, since Mauritius built a treaty network and a fund-administration industry through which a large share of institutional investment into African assets is structured, making a country of 1.27 million people a node in the continental balance sheet out of all proportion to its economy. Kigali is the newest entrant, aiming at fund domiciliation and at being the neutral jurisdiction for regional deals, of a piece with the settlement Chapter 31 describes. Lagos is the anomaly: the largest single financial market on the continent by customers and by fintech firms, and not a financial centre, because a centre is where other people’s money comes to sit and Nigerian capital controls and currency risk have made that unattractive for two decades.
The exchanges follow the same map and add a discouraging fact. Africa has more than twenty securities exchanges, from Johannesburg’s to the two regional bourses shared by the West and Central African monetary unions to the Ethiopian exchange that opened in 2025, and most are illiquid: a handful of counters trade, turnover is a small fraction of capitalisation, and a listing offers a founder no exit and an institution no position it can sell. That is why African growth companies list in London or New York or not at all, and why the money in Section 7 arrived as private capital. The chapter’s data file for the map records the exchanges, the financial-centre designations and the central banks by seat city; the market-capitalisation and listing-count fields are deliberately empty, because no comparable, current, verified series across the continent’s exchanges was available to fill them.
5. Workforce
Finance is a small direct employer with an unusually high wage share, and the two are the same fact. A bank employs tellers, credit officers, compliance staff and treasury dealers, all on payroll, all inside the wage-employment overlay, and there are not many of them relative to output. A payments business is more extreme: Safaricom serves about 41 million monthly active M-Pesa customers with a few thousand direct employees, as Chapter 26 records, through an agent network of about 299,000 outlets (Safaricom, 2025, 2026).
Those agents are the sector’s largest visible employment effect and exactly the work Chapter 10 built its overlays to distinguish from a job. An agent is a self-employed shopkeeper earning a commission that supplements another income, with no contract, no leave and no pension. She is employed on the International Labour Organization’s definition and she is not what a finance minister means by a job. Counting agents as employment is not wrong; treating the count as a labour-market outcome is. Where wage employment is thinnest, Nigeria at 13.6 percent and Ethiopia at 15.4, the distinction carries almost the whole argument.
Two further features. The agent network runs female in most markets, which is one reason the welfare evidence in Section 10 finds effects concentrated among women; bank management runs male, sharply. And the sector’s graduate employment, the analysts and operations staff in Nairobi and Lagos, sits in the occupational categories Chapter 17 identifies as most exposed to automation, which is the labour-redundant world arriving at the sector that is supposed to finance the response to it.
6. Regulation and policy
Financial regulation here is made by central banks, which means by the institutions of Chapter 8 with the priorities of Chapter 8. Four themes recur.
Licensing the new entrant. The most consequential regulatory decision of the past twenty years on this continent was the Central Bank of Kenya’s, to let a telecommunications company hold a trust account and iterate rather than demand a bank licence first; regulators that took the other route got nothing for a decade. Most central banks now run tiered licensing, with payment-service-provider and e-money-issuer categories beneath the bank licence, and several run sandboxes. The lesson drawn was not that regulation should be light but that a new instrument needs a category of its own, since forcing it into the bank category kills it and leaving it unregulated stops being an option once the float is large.
Nigeria’s cashless policy and the note redesign. Nigeria has pursued a cashless agenda for over a decade, with withdrawal limits and charges on large cash transactions, on the reasoning that a cash economy is untaxable and expensive to run. In late 2022 the Central Bank of Nigeria announced a redesign of the higher-denomination naira, ₦, notes, with a short exchange deadline and a deliberately restricted supply of new ones. The result in early 2023 was a severe cash shortage in a country where most retail transactions are cash, queues at banks, protests and a Supreme Court intervention extending the deadline; electronic payment volumes rose sharply and some of the rise stuck. A state that removes the medium of exchange from a cash economy has conducted a monetary contraction whether it meant to or not.
Capital and price controls. In 2024 the Central Bank of Nigeria ordered every bank to raise its minimum paid-in capital, the largest requirement falling on banks with international licences, with a deadline of 31 March 2026 (Edeh, 2024); devaluation had shrunk the dollar value of bank capital. The consequence has been a wave of rights issues, placements and mergers, and a smaller number of larger banks; whether a more concentrated system lends more to small firms is an open question and the international evidence is not encouraging. Kenya ran the other kind of intervention, capping commercial lending rates in September 2016 at four points above the central bank’s rate and repealing the cap in November 2019. The intent was cheaper credit. The effect, as analysts described it at repeal, was that private-sector lending slowed and banks moved their money into government paper, because they would not lend to borrowers they could not price (CNBC, 2019). A price ceiling on a rationed good reduces the quantity rather than the price.
Data, open banking and prudential rules. Kenya brought digital credit providers under central-bank licensing after a period in which unlicensed lenders scraped borrowers’ phone contacts for collection, and that regime is now the template others copy; data-protection statutes modelled on the European regulation have passed in a majority of African countries, which matters for a sector whose core asset is behavioural data; and open banking, under which a bank must release a customer’s data to a third party the customer authorises, has been adopted in Nigeria and is the instrument most likely to convert the payments layer’s information into credit. The Basel capital and liquidity standards have been adopted in name across most of the continent and in substance unevenly, with the zero risk weight on domestic sovereign exposure doing the most economic work; anti-money-laundering supervision and the de-risking it provoked belong to Chapter 8; and the two CFA franc unions run genuine banking unions with supranational supervisors, giving fourteen countries a consolidated view of their banks that most of the continent lacks.
7. Recent trends
The venture cycle turned, and the instrument changed. African technology funding, which is overwhelmingly fintech funding, ran at $2.02 billion of equity in 2019, fell to $1.43 billion in the pandemic year of 2020, then peaked at $5.2 billion in 2021 (Partech, 2026). It has not been near that since: $4.9 billion in 2022, about $2.2 billion in 2023 and again in 2024, and $2.4 billion across 462 deals in 2025 (Partech, 2026). What grew instead is debt. Venture debt more than doubled to $1.5 billion in 2022, fell to $1.0 billion in 2024, and reached a record $1.64 billion in 2025, taking total funding to $4.1 billion, up 25 percent on the year and still well below 2022’s $6.5 billion (Partech, 2026).
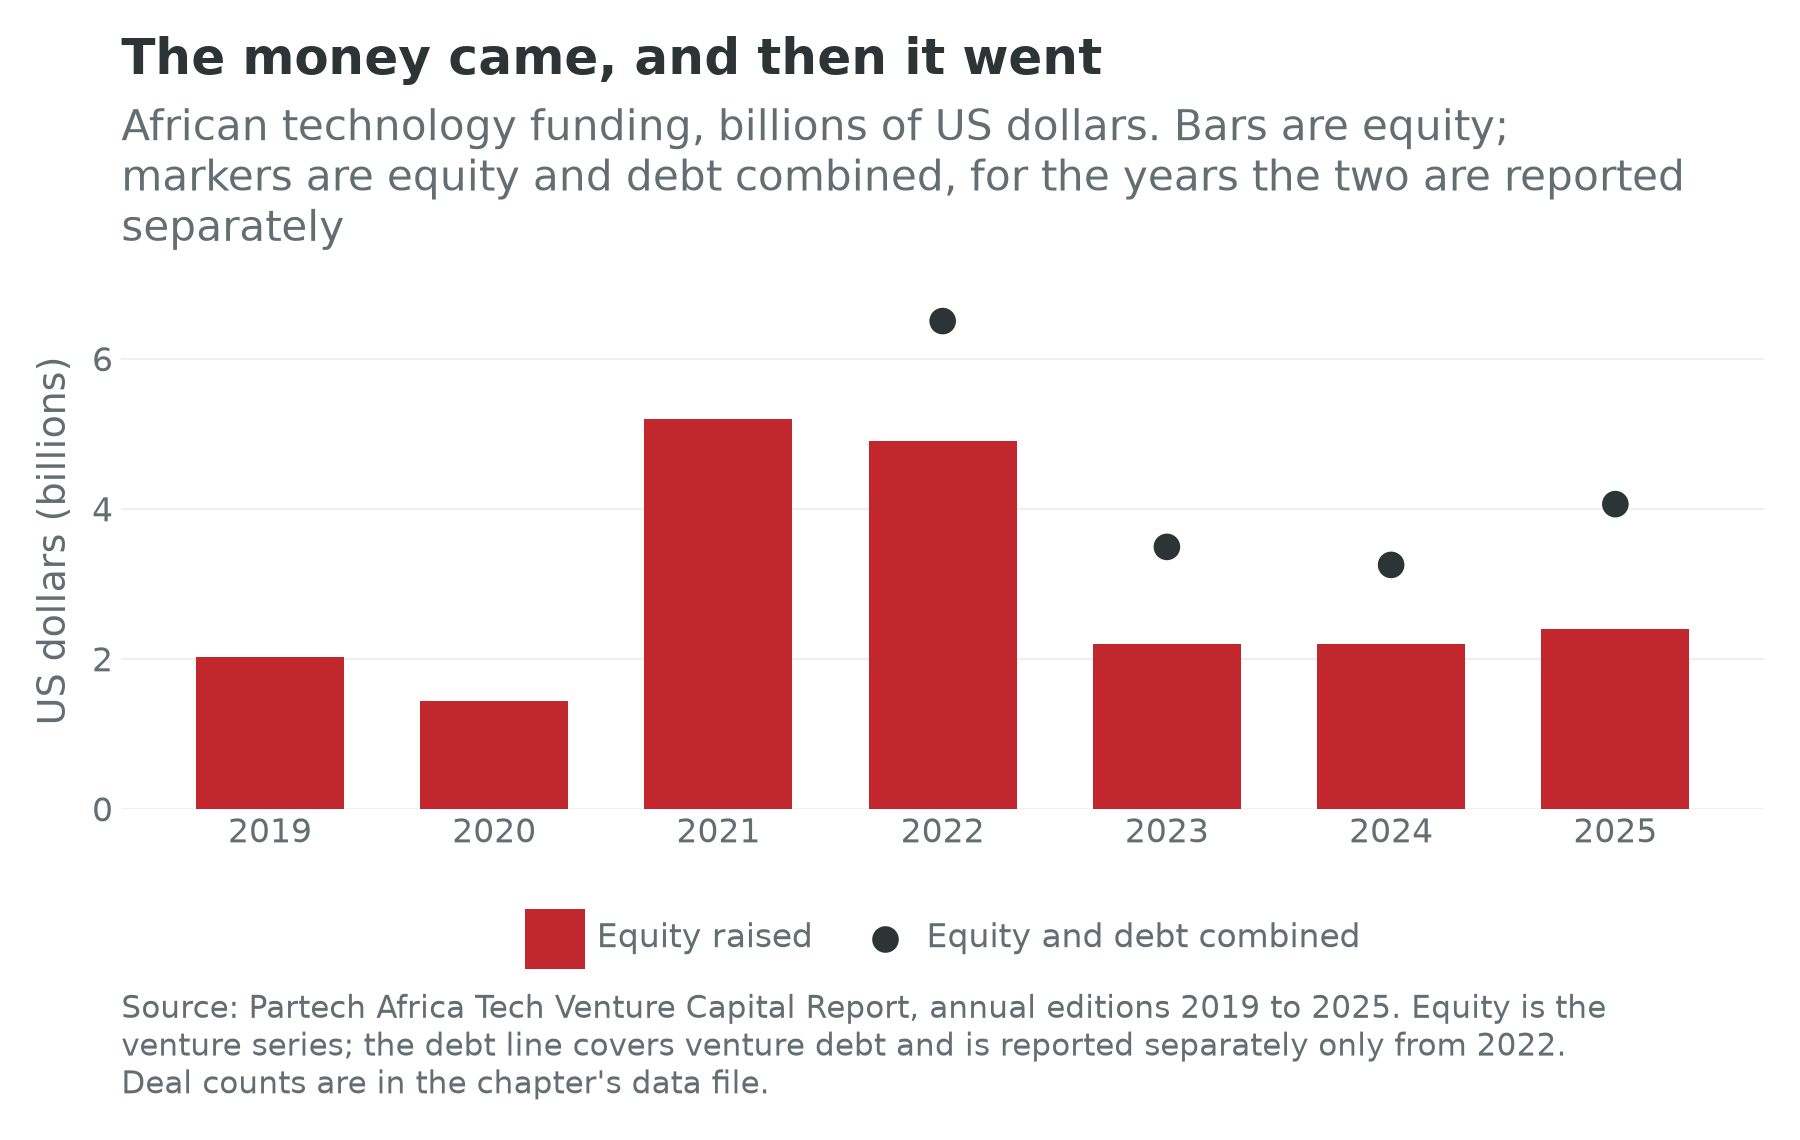
The shift from equity to debt is more interesting than the cycle. Venture debt is lent against a receivable or a loan book rather than against a story, so it flows to firms that have one, which means the funding mix has moved from companies that were promising to companies that are lending. That is a maturing market, and it is also a market whose entire annual capital is smaller than a single mid-sized European fundraising, for a continent of 1.513 billion people.
The geography of the money is narrow. Kenyan startups raised $984 million in 2025, close to a third of all African startup funding, and Nairobi alone took 54.2 percent of continental startup funding in the third quarter of that year (Partech, 2026). Nigeria, Egypt and South Africa take most of the rest, and forty-nine countries share what is left, which is a reason to read the sector’s continental claims with the map in hand. Payments is also a scale business, so the market is consolidating, through acquisitions of smaller wallets, cross-border roll-ups and operators’ own fintech arms entering markets a startup opened; several celebrated unicorns of 2021 have raised at lower valuations, changed model, or both.
Crypto and stablecoins. Nigeria is regularly reported among the world’s heaviest users of cryptocurrency, and the reason is not speculative enthusiasm: a dollar-denominated stablecoin is a dollar bank account for somebody who cannot get one, in a country whose official market rationed foreign exchange for years and where Chapter 8’s parallel premium was the price of a licence. Stablecoins are increasingly a settlement rail too, moving value between Lagos and Nairobi faster and cheaper than correspondent banking. The Central Bank of Nigeria banned banks from servicing exchanges in 2021, reversed the ban in 2023 and has since moved to licensing, which is the usual arc. The policy question is genuine: a stablecoin is dollarisation with an application programming interface, and a central bank that has spent a decade defending its currency has reason to dislike it.
Instant payments, and fintech’s second act. The most consequential recent development is not a firm but the spread of central-bank instant payment systems that make wallets, bank accounts and merchants interoperable at low cost, whose effect on account ownership Section 2 reports; the continental version is the settlement rail of Chapter 8. And every serious African payments company is now trying to become a lender, because payments earn 0.4 percent of what they move and lending earns more. That is the sector’s most important experiment. If the wallet record turns out to substitute for collateral, the credit constraint that has bound this continent’s firms since independence loosens. If it does not, the sector will have built an excellent rail with a small consumer-credit book on top.
8. Climate exposure
Finance’s climate exposure runs through its borrowers rather than its buildings. On the asset side, African bank books are weighted towards agriculture, trade and property in cities with severe flood exposure, and a drought that halves a maize crop is a wave of non-performing loans; almost no African bank publishes a climate stress test that would let an outsider size this. On the liability side, green, blue and sustainability-linked bonds have been issued by South African, Moroccan, Egyptian, Nigerian, Kenyan and Ivorian issuers and by the African Development Bank, but volumes remain small and the pricing benefit modest, so the label is more a marketing device than a cost-of-capital instrument. Chapter 34 carries the climate-finance argument; the point here is that a banking system which cannot lend at ten years cannot finance an adaptation project that pays back over twenty, whatever colour the bond is.
9. Firm profiles
M-Pesa, Kenya
The profile earns its place for the unit economics rather than the story, which Chapter 26 tells as part of the Nairobi pole and Chapter 29 continues across the Ethiopian border.
In the year to March 2025 M-Pesa carried 37.15 billion transactions worth KSh 38.29 trillion, served 35.82 million one-month active customers and earned KSh 161.1 billion, which was 44.2 percent of Safaricom’s Kenyan service revenue, through an agent network of about 299,000 outlets (Safaricom, 2025). In the year to March 2026 it moved KSh 41.68 trillion across 46.41 billion transactions for 40.99 million monthly active customers, earning KSh 182.7 billion, or 45.6 percent of Kenyan service revenue, with the merchant base up 71.0 percent to 3.1 million (Safaricom, 2026).
Three readings. The take rate first: KSh 182.7 billion on KSh 41.68 trillion is about 0.4 percent of the value moved, the number to hold beside any headline about trillions flowing through African wallets (Safaricom, 2026). Then the composition of growth: volume grew 25.1 percent while value grew 8.9 percent, so the average transaction is getting smaller and the product is moving down-market into everyday retail, which the merchant number records and which is the precondition for a lending business. Then the limit. A firm serving 41 million customers employs a few thousand people directly, as Chapter 26 records (Safaricom, 2026), and the credit layered on the rail is small-ticket and short-dated. The transformation is in the rail, and a rail is not capital formation, however impressive the throughput.
Wave, Senegal and Côte d’Ivoire
Wave is the clearest demonstration on the continent that mobile-money pricing was a rent rather than a cost. The company began operating in Senegal in February 2018 and has since spread to Côte d’Ivoire and four more markets, with a flat charge of one percent on a send and free deposits and withdrawals (Wave, 2026; African Business, 2023b). It built its own agent network, about 13,000 agents in Senegal alone, and sold transfers through a smartphone application rather than the standard handset menu (African Business, 2023b; Onukwue, 2021). By the company’s own account, Orange Money, the incumbent, cut its transfer rates by close to 80 percent in response (African Business, 2023b), and West African domestic transfers are now materially cheaper than they were.
The lesson is uncomfortable for two constituencies at once. For incumbents, it establishes that the price of a domestic transfer in a concentrated market had been well above cost, which is what Section 3’s arithmetic predicts when the number of viable wallets is one or two. For enthusiasts, it establishes how thin the resulting business is: at one percent of a small transfer, a payments firm needs enormous volume and near-zero marginal cost to survive, and no version of it generates the margin to fund a lending book out of retained earnings. Cheap payments are a consumer surplus, not a capital market.
Ecobank Transnational Incorporated, Lomé
Ecobank is the continent’s most complete attempt at a pan-African bank, profiled for what its existence proves and what its performance does not. Founded in 1985 at the initiative of the West African chamber of commerce and the regional development bank, and headquartered in Togo rather than in any of its large markets, it operates in more African countries than any other bank, on a single brand and a shared platform, with a payments product that moves money between member states inside the group, and it is supervised at group level by the West African monetary union’s banking commission, which makes it one of very few African financial groups with a consolidated home supervisor (Ecobank, 2026).
What that proves is that the obstacles to a continental bank are surmountable: the licences can be obtained, the platform can be run, and an African-owned institution can be the incumbent in the markets European banks are leaving. What it has not proved is that the model produces continental credit, since a group present everywhere still lends mostly to governments, large corporates and traders, because the binding constraint in each market is the collateral and enforcement problem of Section 2 and a cross-border licence does not touch it. Set beside Attijariwafa, which Chapter 28 profiles, the two make the same point from opposite ends of the continent: African cross-border banking is real, and it has so far been better at moving money than at financing production.
The Nigerian contributory pension pool
The last profile is an institution rather than a firm, because the most important thing in African finance over the next twenty years is where the pension money goes.
Nigeria’s contributory scheme was created in 2004 to replace an unfunded and largely unpaid public pension system, and is regulated by the National Pension Commission, which licenses the fund administrators, sets the investment rules and publishes the industry’s portfolio: ₦23.33 trillion at the end of March 2025, 62 percent of it in federal government securities (Adeniran, 2025). The design is orthodox: mandatory contributions from employer and employee, individual retirement savings accounts, competing administrators, a custodian separate from the manager, and multi-fund categories with different equity limits by member age. The interesting part is the allocation, and it is the same in Lagos, Nairobi, Accra and Windhoek. The overwhelming majority sits in federal government securities. The rules permit infrastructure funds, private equity and corporate bonds within limits, and very little goes there, for three reasons that reinforce one another: the government paper yields well and is liquid; the alternatives are mostly unrated and unlisted, so the rules restrict them; and administrators are ranked publicly on short-horizon returns, which punishes an illiquid position that will look bad for five years before it looks good.
Read that against Section 1’s two worlds. In the labour-abundant world the pool’s failure to fund production is a growth problem: the savings exist, the projects exist, the intermediation does not. In the labour-redundant world it is a sovereignty problem, because the assets that will earn the returns are the machines, the data centres and the solar farms, and who owns them is being settled now, largely by foreign balance sheets, while the continent’s own long-term savings sit in treasury bills. The regulations that produce that are prudent, defensible and rewritable.
10. What the experiments say
Four findings, and the difference between smoothing and building
The systems question is whether financial access raises firm productivity and employment or mostly smooths consumption. The randomized evidence answers it more sharply than the observational literature, and not in the way the sector’s advocates do.
Savings first. Dupas and Robinson (2013) gave market vendors and bicycle-taxi drivers in western Kenya free access to a basic bank account. Female market vendors increased business investment and private expenditure; effects on men were negligible. The account paid negative real interest after fees, so the mechanism was not the return but that the money was out of reach of the household and the extended family. Brune, Giné, Goldberg and Yang (2016) made the same point with a commitment device: Malawian tobacco farmers offered an account into which they could commit crop proceeds spent more on inputs, planted more land and raised output and household consumption, with the commitment arm outperforming a plain savings account. Together these are the strongest evidence in the sector that what a small African producer is short of is a savings instrument, not a loan.
Then microcredit, which underdelivered. Banerjee, Karlan and Zinman (2015) introduced six independent randomized evaluations of microcredit expansions, in Ethiopia, Morocco, Mexico, Mongolia, Bosnia and India, and summarised a consistent result: modest increases in business activity, no transformative effect on average household income or consumption or on the social indicators the industry had promised, and no evidence of the widespread harm its critics alleged. The Ethiopian study found little effect on the outcomes it was powered to detect (Tarozzi, Desai and Johnson, 2015), and the Moroccan study, used in Chapter 28 for the rural-lending case, found that credit helped households that already had a business and did little for the rest (Crépon, Devoto, Duflo and Parienté, 2015). Microcredit is a useful financial product and was not a poverty-elimination technology.
Then the digital layer. Chapter 8 sets out what the staggered rollout of Kenya’s agent network did to household risk-sharing and to poverty (Jack and Suri, 2014; Suri and Jack, 2016), and this chapter takes it as read. The finding that belongs here is the next one along: Suri, Bharadwaj and Jack (2021) asked whether the same rails carrying credit rather than transfers do harm, and found that digital loans made eligible households less likely to cut spending after negative shocks, without the deterioration critics predicted. Payments help households absorb shocks, and so, at the margins studied, does the small credit layered on top.
And the scoring question. Björkegren and Grissen (2020) showed that behaviour observable in ordinary mobile-phone usage predicts loan repayment well enough to be commercially useful, which is the empirical foundation of the digital-lending industry and of Section 2’s claim that the wallet record substitutes for a credit file. It is also the foundation of the worry, since a model built on call and top-up patterns is opaque to the borrower, hard to contest, and can encode exactly the exclusions a credit bureau was meant to remove. Karlan, Mullainathan and Roth (2019) supply the caution from outside Africa: market vendors in India and the Philippines whose high-cost moneylender debt was cleared for them mostly fell back into it, so a debt trap is a household equilibrium rather than a one-time shock.
What this adds up to. Financial access reliably smooths consumption and raises resilience, sometimes shifts women out of agriculture into small business, and rarely raises firm productivity or creates wage employment at any scale. It moves the identity’s second term barely and its third through a narrow channel. That is a real welfare gain and not the structural transformation the sector’s rhetoric claims.
11. Data sources
Three of this chapter’s series are unusually good and three are unusually bad, and the list says which.
- GSMA, State of the Industry Report on Mobile Money, for accounts, active accounts, transaction value, agents and live services. A census of operator returns rather than a sample, whose weaknesses are definitional: transaction value counts each leg, so cash-in, transfer and cash-out on the same money are counted more than once, and registered accounts are not people.
- World Bank Global Findex Database, for account ownership, mobile-money ownership, saving and borrowing. Nationally representative on a consistent instrument across the 2014, 2021 and 2024 rounds, which makes it the best cross-country financial data on the continent, on a sample too small for fine sub-national breakdowns (Demirgüç-Kunt, Klapper, Singer and Ansar, 2022).
- Partech Africa, for venture equity and debt by year, country and stage. A compilation of announced rounds, complete for what was announced and blind to the rest.
- World Bank World Development Indicators and the IMF Financial Access Survey, for credit depth and access. The credit ratio exists in two variants, all financial corporations and banks only, quoted interchangeably in the secondary literature, which is why Figure 16.2 names the variant behind every point and treats six points as magnitudes rather than a ranking.
- National regulators for insurance and pension aggregates, which are compiled on national definitions at different frequencies and are not comparable across borders without work nobody has done; and the African Securities Exchanges Association for the exchanges. There is no current, verified continental series of market capitalisation and listing counts this chapter was willing to print, which is why the map’s exchange records carry those fields empty rather than filled from memory.
- Central banks and company reports, cited by name: the Central Bank of Kenya, the Central Bank of Nigeria, the Bank of Ghana, Nigeria’s National Pension Commission, Safaricom, MTN and MTN Ghana, Attijariwafa Bank and Ecobank.
- The country cards, which carry no financial-sector field at all. Their contribution is the identity terms and overlays of Table 16.1, the data-quality block behind them, and the sovereign creditor mix. Two of the ten countries in the table carry low confidence flags, Nigeria and Ethiopia, and both are systems this chapter discusses at length; Côte d’Ivoire’s last labour-force survey was in 2019, so its overlay row should be read more loosely than its neighbours’.
12. Exercises
Connections to other chapters
- Chapter 6 (The Informal Economy) owns the savings circles and the informal firm’s balance sheet; this chapter owns whether a wallet record can make that firm bankable.
- Chapter 8 (Money) owns the currency zones, the central banks, the parallel premium, fiscal dominance, the continental payment rail, remittance costs and de-risking. This chapter begins where the money stops and the firms start.
- Chapter 9 (The Recipe) puts financial control third among the ingredients, and Chapter 17 (Digital) owns the telecommunications operators as network businesses.
- Chapter 21 (Capital and Sovereign Debt) owns Eurobonds, the repayment wall and restructuring; the domestic holders of that debt are this chapter’s banks and pension funds, and Chapter 23 owns the transfers the payments rails deliver.
- Chapters 24, 26, 27, 28 and 29 carry the poles whose financial firms appear here, and each owns its own firm profiles.
- Chapters 32 and 33 carry the external lenders whose balance sheets substitute for the domestic ones this chapter finds missing.
Discussion questions
Payments scaled and credit did not. Give two explanations, one about information and one about collateral, and say what evidence would separate them. Then say which of the two an open-banking regime addresses, and what would still be missing afterwards.
Kenyan banks increased their holdings of government securities by 18.2 percent in 2025 while their loans to customers grew 6.6 percent (Kajilwa, 2026). Is crowding out the right description of what follows? Construct the strongest case that it is not, using the Ghanaian domestic debt exchange as your counter-example, and say what you would need to observe to settle it.
A trust account is not deposit insurance. Ask what a mobile-money float is in law, who earns the interest on it, and who bears the loss if an operator or its bank fails. Then say whether an economy whose largest retail payment system is run by a telecommunications company is more or less fragile than one where banks run it, and be specific about the failure you have in mind.
Try it
Open the three cards side by side: Kenya, Nigeria and Ghana. Read the balance-sheet block on each, in particular external_debt_by_creditor.eurobond against external_debt_stock, then the wage-employment overlay. Say where a domestic manufacturer in each country would go for a five-year loan, and what the sovereign’s own creditor mix implies about the terms it would be quoted. Then open the Growth Pole Map, switch on the financial-centres layer, and turn on the confidence toggle. The layer places the exchanges, the financial-centre designations and the central banks this chapter names; say whether the countries that fade under the toggle are the ones whose financial systems the chapter leaned on.
Data exercise
Using cards.csv from the country cards page on this site, build a table of all fifty-four countries with balance_sheet.external_debt_by_creditor.eurobond, balance_sheet.external_debt_stock, overlays.wage_employment_share and data_quality.confidence_flag. Compute the bondholder share of the external stock for every card carrying both fields, and confirm that only 23 of the 54 carry the bond line at all, noting which fields are null rather than zero and never imputing a null as a zero. Rank by that share and ask whether the market-financed sovereigns are the ones with the highest wage-employment shares, a crude proxy for the formality of the economy a bond investor is lending against. Then open the chapter’s own data file on the book site, which carries the credit-to-GDP ratios with the variant and year on every row, and merge it in for the six countries it covers. Write two paragraphs: one on whether sovereign access to international bond markets goes with domestic financial depth or substitutes for it, and one on how much weight your answer can bear, given that six of the fifty-four have a published credit ratio here and that balance_sheet.eurobond_outstanding is empty on every card.
Data Sources and Further Reading
Key data sources
Section 11 lists them with the caveat each carries. The vintages are the GSMA’s 2026 edition covering 2025; the Global Findex 2025 edition, fieldwork in 2024, from nationally representative surveys of about 145,000 adults in 141 economies, with the 2014 and 2021 rounds beside it; World Development Indicators at the latest observation per country; and the Partech Africa annual editions covering 2019 to 2025. The Global Financial Centres Index supplies the standing of African centres against the rest of the world.
Further reading
- Patrick Honohan and Thorsten Beck, Making Finance Work for Africa (2007), still the best single statement of the structural problem, with Thorsten Beck and Robert Cull (2013) for the banking evidence a decade later and Franklin Allen and others (2014) on the development and inclusion gaps.
- Tavneet Suri and William Jack (2014, 2016, and with Prashant Bharadwaj in 2021) for what cheap payments and digital credit do to households, read beside Chapter 8, and Isaac Mbiti and David Weil (2016) for the Kenyan case at chapter length.
- Abhijit Banerjee, Dean Karlan and Jonathan Zinman (2015) for the six microcredit evaluations read together, and Pascaline Dupas and Jonathan Robinson (2013) for the savings result that has aged better than any of them.
- Daniel Björkegren and Darrell Grissen (2020) on phone-data credit scoring, and Asli Demirgüç-Kunt and co-authors (2022) for the 2021 Findex round and the methodology behind the series plotted here.