33. The Other Partners
Between 2019 and 2023, companies from the United Arab Emirates, a federation of about eleven million people on the far side of the Red Sea, announced roughly $110 billion of investment projects in Africa, of which about $72 billion was in renewable energy, on the count of the Financial Times’s investment-tracking service, and Carlos Lopes of the University of Cape Town calls the federation Africa’s largest investor (Carrera Espriu, 2025). Announcements are not outturns, and a good share of that money will never reach financial close. But the direction of the arrow is what this chapter is about: the list of countries that matter to Africa’s external accounts has been rewritten inside a decade, and China did not do all the rewriting.
Learning Objectives
After reading this chapter, you should be able to:
- Read any external partnership through the same five questions: what the partner buys, what it sells, what it finances, what it wants, and what the relationship does to the identity’s three terms.
- Place the Gulf states, India, Turkey, Russia and the Western donors on one comparative table, and say what such a table can measure, what it can only report, and why the two are not the same.
- Explain why Gulf capital has become the marginal buyer of African coastline, ports, farmland and mines, and what a central-bank deposit does for a currency that a project loan does not.
- State what the aid-effectiveness and trade-preference literatures can and cannot settle about whether a partnership is good for the country receiving it, and name the identification problem in each case.
- Say why none of these partners moves the identity’s first term, why they act on the third through capital and market access, why they touch the second hardly at all, and what changes if the frontier of production stops needing workers.
Prior work: the mirror-statistics problem that makes bilateral African trade figures disagree with themselves, and which sits underneath every number in this chapter’s first table, is worked through in the companion volume, The New Regional Economics, chapter 14 (Wilse-Samson, 2026). This chapter cites that material rather than repeating it.
One boundary before the argument. China is the largest single external actor in Africa on almost every measure that can be counted, and Chapter 32 owns it entirely. It appears here twice, in the comparative table and in the figure that draws the contrast, because a table of partners with the largest one missing would be a table about nothing.
1. Five questions, one table
The literature on Africa’s external partners is written mostly as geopolitics, in which the interesting question is who is winning. That framing has the disadvantage of being unanswerable and the further disadvantage of being uninteresting to anyone living in the countries concerned. This chapter asks five narrower questions of each partner, in the same order every time.
What does it buy? Almost always a commodity, and usually an unprocessed one, which is the oldest fact about African trade and the one that has survived every change of buyer. What does it sell? The composition of the sale says what kind of economy the partner is and which part of the African economy it competes with. What does it finance? Here the partners differ most, because a concessional loan, a central-bank deposit, an equity stake, a contractor’s credit and a grant have five different consequences for an African balance sheet, and a chapter that lumps them together as “engagement” has thrown the information away. What does it want? Food security, votes at the United Nations, transit, minerals, migration control, a market for a defence industry, or a story to tell at home. What does it do to the identity? GDP growth is approximately the growth of output per worker, plus the growth of the employment-to-working-age ratio, plus the growth of the working-age population. Section 8 answers that one for all of them at once, and the answer is more uniform than the other four.
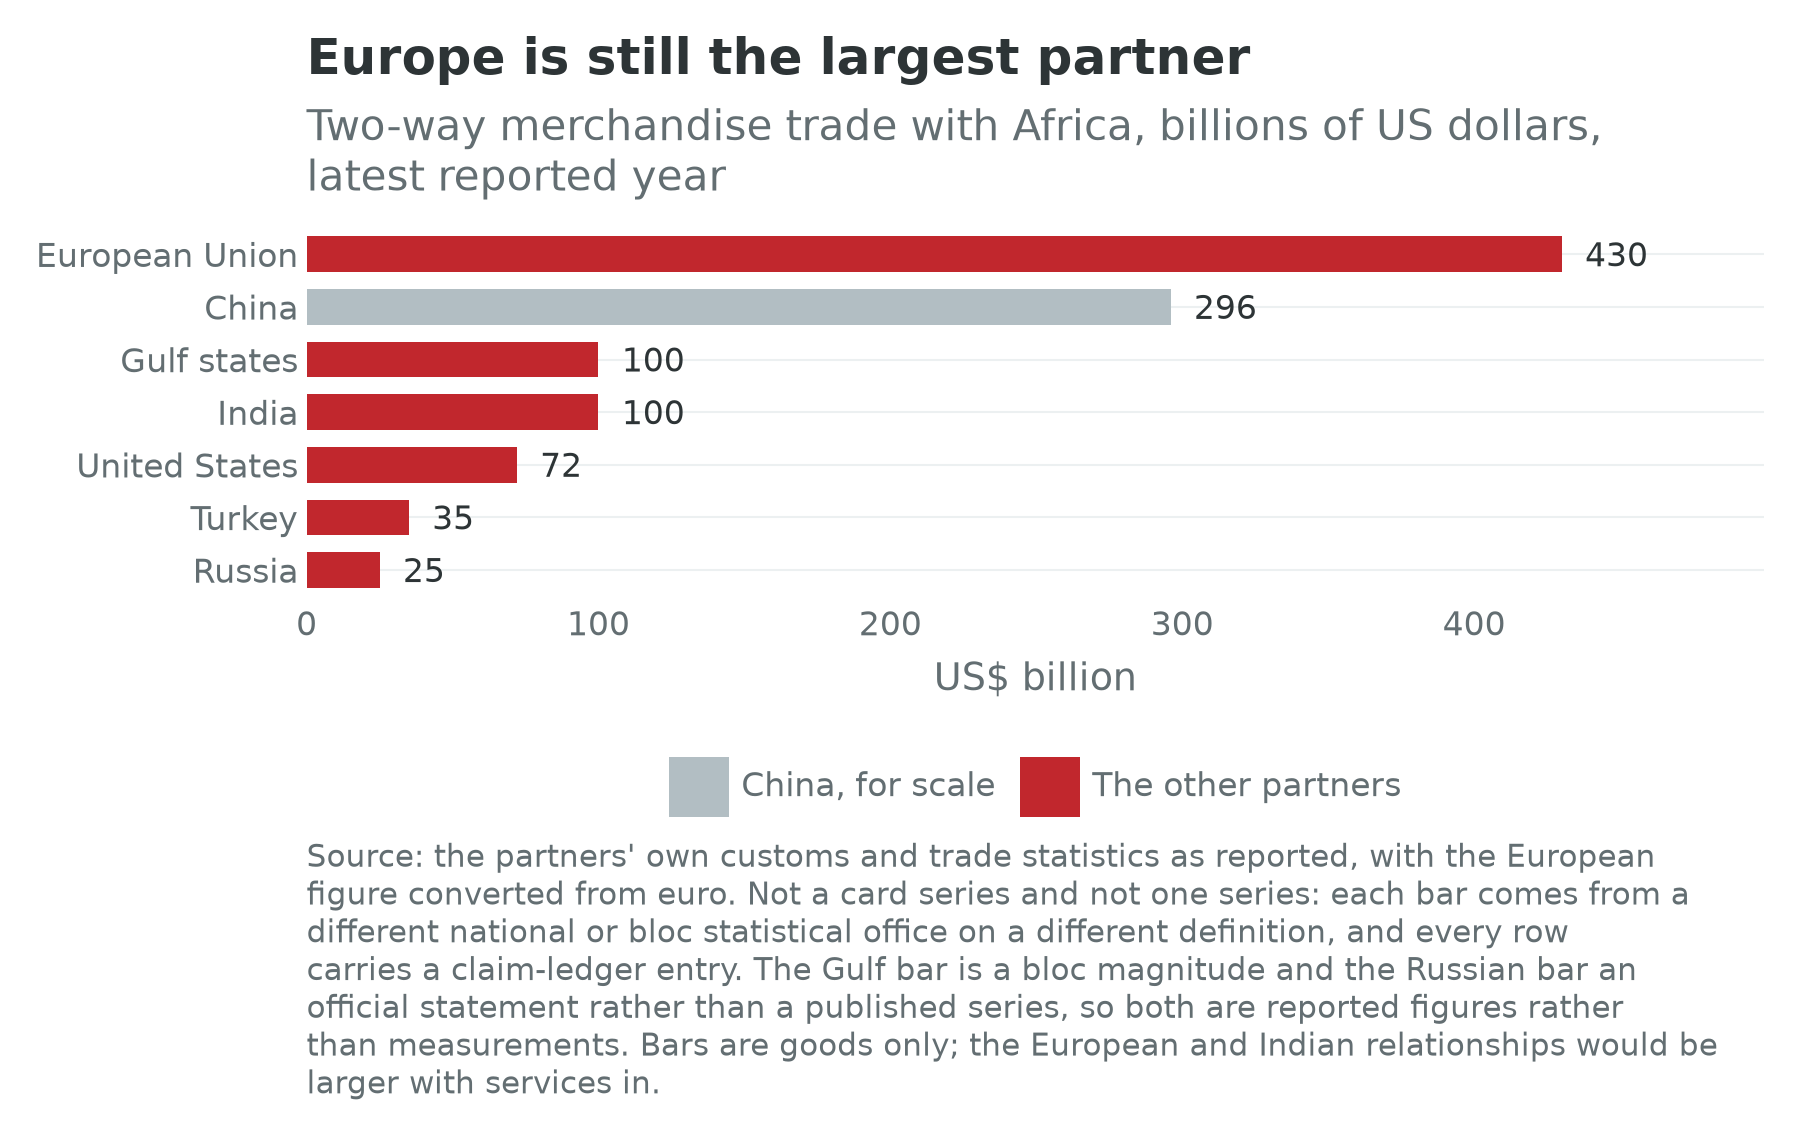
Table 33.1 puts the partners side by side, with a caution that is the honest content of this chapter’s data-quality section. None of these cells is a card field. Every one is reported by a statistical office, a customs administration, a ministry, a commercial database or a summit communiqué, and the definitions do not match across rows: the trade column is goods only, the investment column mixes announced projects with measured stocks, and the official-finance column mixes a mobilisation target with a disbursement record. It is a map of orders of magnitude and is presented as one.
| Partner | Two-way goods trade | Investment | Official finance | Instrument of choice |
|---|---|---|---|---|
| European Union | About $430 billion (2024) | The largest foreign-investment stock in Africa | Global Gateway: a €300 billion mobilisation target to 2027, of which about half is the Africa package (2021 to 2027) | Market access conditioned on regulation: partnership agreements, carbon and deforestation rules |
| Gulf states | On the order of $100 billion (2024), the United Arab Emirates the large majority | About $110 billion of announced projects from the United Arab Emirates alone (2019 to 2023) | The Kuwait Fund (from 1961), the Saudi Fund, the Arab Bank for Economic Development in Africa (from 1973), the Islamic Development Bank (from 1975) | Equity in the asset itself: ports, coastline, farmland, mines; and central-bank deposits |
| India | On the order of $100 billion (2024) | Substantial and badly measured, much of it routed through Mauritius | Exim Bank of India concessional lines of credit: about $12 billion across roughly 200 projects | A tied concessional credit that buys Indian goods and Indian contractors |
| United States | About $72 billion (2024) | A stock on the order of $50 billion, concentrated in oil and gas | The development finance corporation, the Millennium Challenge Corporation, and until 2025 the largest bilateral health programme in the world | A unilateral trade preference renewed by a foreign legislature, and disease-specific health aid |
| Turkey | About $35 billion (2024), against about $5.4 billion in 2003 | Modest, and concentrated in construction and manufacturing | Turkish Eximbank credits and the development agency’s project grants | Contractors, an airline network, and armed drones |
| Russia | About $25 billion (2024) | Negligible outside mining and nuclear | About $23 billion of Soviet-era and Russian claims written off (1996 to 2023) | Security services exchanged for mining concessions; grain and fertiliser; reactors |
| China, for the comparison | About $296 billion (2024) | A stock on the order of $40 billion | About $176 billion of cumulative loan commitments to 49 African governments, 2000 to 2024 | Policy-bank lending against resources and infrastructure contracts |
Trade figures are the partners’ own customs statistics as reported, converted where necessary, and are goods only; the European figure is converted from euro. Investment figures mix announced project values from a commercial database with measured stocks and are not comparable across rows. Official finance mixes mobilisation targets, cumulative commitments and disbursement records. The Chinese commitment total is the sum of the cumulative-commitment field across the 49 country cards carrying it, and is a cumulative flow of promises rather than a debt stock.
2. The Gulf: buying the coastline
The Gulf is the newest of the five and the one whose behaviour is hardest to place in the existing categories. It is not an aid donor in the Western sense, not a policy lender in the Chinese sense, and not a colonial successor in the French sense. It is a set of rent economies with more capital than domestic uses for it, buying the assets that generate rents somewhere else.
What it buys, and what it sells
The Gulf buys food, and the reason is arithmetic: the Arabian peninsula has almost no arable land and almost no fresh water, and its states import the overwhelming majority of their calories. So it buys grain, sugar, oilseeds and meat, and more consequentially the firms and the land that produce them. Chapter 11 records the largest of those transactions, the progressive acquisition of Olam Agri, one of the two firms that dominate the trading layer of African agriculture, by the Saudi Agricultural and Livestock Investment Company, which took a minority stake in 2022 and agreed to buy the balance in a transaction valuing the business in the billions (Olam Group, 2025). Chapter 22 records the land purchases themselves, from Sudanese irrigation schemes to Ethiopian flower farms, which are older than the current wave.
It also buys gold, and this is the least documented flow in African external trade. The overwhelming share of artisanal African gold leaves the continent for Dubai, much of it without appearing in the producing country’s export statistics at all. Swissaid’s reconciliation of producer and destination records put the discrepancy at about 435 tonnes in 2022, worth something over $30 billion, with the United Arab Emirates the largest single destination (Swissaid, 2024). That is a reconciliation of mirror statistics rather than a measured flow, which is why no gold line appears in Table 33.1, and at that magnitude it is a larger annual transfer than most of the official finance in this chapter.
What the Gulf sells is refined products, chemicals, aluminium and, increasingly, logistics and telecommunications services. The last of those matters more than the goods.
What it finances
Three instruments, and they behave differently.
The first is equity in the asset. Chapter 19 sets out the port map: DP World, of Dubai, has terminals, concessions or announced projects at Sokhna, Dakar, Berbera, Luanda and Banana, as well as a share in the consortium holding the Maputo concession, while AD Ports of Abu Dhabi is the minority partner in the Indian-led venture that took a thirty-year concession over the main container terminal at Dar es Salaam in 2024 (The East African, 2022; The Maritime Executive, 2024; Adani Ports and Special Economic Zone, 2024). Chapter 30 records the mining version: in March 2024 a 51 percent stake in Mopani Copper Mines was sold to a vehicle of International Resources Holding of Abu Dhabi for a commitment of up to $1.1 billion, with the Zambian state holding company retaining the balance. Chapter 18 records the tourism version and puts it sharply: the largest capital flows into African tourism now come from the Gulf and buy land rather than operate hotels. Chapter 27 records the largest transaction of all, the February 2024 agreement under which an Abu Dhabi sovereign fund agreed to pay $24 billion for development rights to 170 square kilometres of Egyptian Mediterranean coast at Ras El Hekma and to convert a further $11 billion of existing Emirati deposits into local-currency investment (ADQ, 2024).
The second instrument is the deposit, and it is the one this book finds most interesting because it is the only external instrument that acts directly on a currency. A Gulf central-bank deposit at an African central bank is formally a short-term liability. In practice it is rolled, year after year, and it counts as reserves, so it lets a central bank defend a rate it could not otherwise defend. Chapter 8 records what that did in Egypt, where the float of March 2024 closed a parallel-market premium of about 125 percent within months because it arrived beside the Emirati commitment and an enlarged Fund programme (ADQ, 2024; International Monetary Fund, 2026a). Gulf states held about $18.3 billion at the Egyptian central bank in October 2026 by an official’s count, of which about $10.3 billion was Saudi, and the direction of travel is from deposit to equity as the older deposits convert (Ragab, 2026). That conversion is the whole story in one sentence: the Gulf is moving from lending Egypt money to owning Egyptian assets.
The third instrument is old-fashioned concessional lending, the part of the relationship with the longest history and the least attention. The Kuwait Fund for Arab Economic Development, established in 1961, is the oldest development fund in the Arab world; the Arab Bank for Economic Development in Africa was established in 1973 to lend to non-Arab African states; the Saudi Fund for Development dates from 1974; and the Islamic Development Bank, founded in Jeddah in 1975, has 57 member countries of which 27 are African (Islamic Development Bank, 2025). They lend concessionally and behave much as a multilateral development bank behaves, and they are now small beside the equity flows above, which is the change: for three decades official Arab finance was the Gulf’s presence in Africa, and it is now a rounding error beside a single coastal land sale.
The United Arab Emirates, in particular
The Emirati case deserves separating from the bloc. A federation of eleven million people has become, on the announcement data, the fastest-growing source of investment into a continent of 1.51 billion, and the portfolio is coherent when read as one thing: ports, free zones, telecommunications, renewable generation, farmland, mines and coastline. It is the physical infrastructure of trade and the assets underneath it, bought at frontier prices where political risk deters the multilateral lenders.
The counter-case has to be on the page and it is uncomfortable. The same appetite for political risk has made the United Arab Emirates a party to the continent’s largest war. The United Nations panel of experts on the Sudan reported credible evidence of arms transfers reaching the Rapid Support Forces through Amdjarass in eastern Chad; the Emirati government denies supplying the force; and Sudan brought proceedings against the United Arab Emirates at the International Court of Justice in March 2025, which the Court removed from its list on 5 May 2025 for want of jurisdiction rather than on the merits (United Nations Panel of Experts on the Sudan, 2024; International Court of Justice, 2025). Sudan’s card carries what has followed: output per worker falling at 2.87 percent a year over the decade, observed growth of minus 4.91 percent, and an implied decomposition four and a half points away from the observed number because the employment series does not carry the collapse. Chapter 36 owns the war. What belongs here is the general point: an investor prepared to take political risk in a fragile state is, in some fraction of cases, an investor with an interest in which faction wins, and the distinction between commercial and strategic capital is one the recipient cannot enforce.
Saudi Arabia, Qatar and Kuwait
Saudi Arabia’s posture is more conventional: it buys food and sells energy and petrochemicals. Its firms are visible in three places in this book, in agriculture through the Olam Agri acquisition of Chapter 11, in power generation, where ACWA Power reports about $7 billion of investment across African projects and signed a framework with the African Development Bank in Rabat in December 2025 aiming to mobilize up to $5 billion between 2025 and 2030 (ACWA Power, 2024; Moho Amer, 2025a), and in the Egyptian deposits above. The Saudi-Africa Summit in Riyadh on 10 November 2023 was the first of its kind and announced financing of about $25 billion to Africa by 2030 (Saudi-Africa Summit, 2023): an envelope rather than a disbursement, on the principle that applies to every summit number here. Qatar’s presence is smaller, in aviation, gas contracting and a sovereign fund with telecommunications and banking positions. Kuwait’s is almost entirely the Fund, which makes it the one Gulf relationship this chapter can describe without a hedge.
What the Gulf wants
Food security first, at a scale the peninsula cannot supply from its own territory. Second, control of the logistics of the Indian Ocean and the Red Sea, which is what the port portfolio is and which becomes more valuable as African trade grows. Third, a place to put a rent with a finite life: the Gulf states know better than anyone what a hydrocarbon economy is worth in 2060, and buying land, ports and renewable generation elsewhere is what an intelligent rentier does with the proceeds while they last. Section 10 returns to that one.
3. India: the partner nobody counts
India trades with Africa at roughly the same order of magnitude as the entire Gulf, and receives a fraction of the attention. The two-way figure for 2024-25 has been reported both as about $82 billion and, by India’s junior foreign minister, as $100 billion, depending on the definition and on whether services are counted, which is why this chapter says “on the order of $100 billion” and declines to be more precise (Seli, 2026; Jha, 2025).
What India buys is crude oil, gold, coal, pulses and cashew. The cashew trade is the sharpest case in this book of an African export that leaves unprocessed: the companion volume records that the large majority of West African raw nuts go to India and Vietnam to be shelled, and Chapter 11 takes up why the shelling has proved so hard to move to the growing country (Wilse-Samson, 2026).
What India sells is the more interesting half, because it is the one partner here whose exports compete at the bottom of the market rather than the top. India supplies a significant share of the generic medicines used across the continent, which makes the Indian pharmaceutical industry a more consequential health institution in Africa than most bilateral aid programmes (Ndalamba, 2026). It sells motorcycles and three-wheelers, and the taxi fleets of Lagos, Kampala, Kigali and Mombasa run largely on Indian machines. It sells pumps, tractors, transformers and generators specified for a poor and hot country, because it is one. Chapter 15’s argument has to reckon with the fact that the goods African consumers buy at the margin are increasingly Indian rather than Chinese, at exactly the price points a nascent African manufacturer would have to hit.
What India finances is a tied concessional credit. Exim Bank of India has extended about $12 billion in lines of credit to African governments across roughly 200 projects in more than 40 countries, and the credits buy Indian goods, Indian equipment and Indian contractors (Export-Import Bank of India, 2025). That is the instrument the Western donors abandoned in the 1990s and the one the Chinese policy banks use: a subsidy to the lender’s exporters paid by the lender’s taxpayer, whose value to the borrower is the gap between its terms and what the borrower could otherwise raise.
Two further pieces matter. The first is Mauritius, and Chapter 9 has told the story: the double-taxation treaty of 1982 made the island for three decades the largest recorded single source of foreign direct investment into India, until it was renegotiated in 2016. That arrangement turned a great deal of what is recorded as Indian investment in Africa, and much of what is recorded as Mauritian investment in India, into the same money passing through a jurisdiction, and it is the clearest instance in this book of why bilateral investment figures should be read as accounting rather than as economics. Beside it sits the oldest institution in this chapter, the Indian commercial diaspora of East and Southern Africa, which still holds a disproportionate share of the trading, manufacturing and retail economy from Durban to Kampala; the Ugandan expulsions of 1972 are the reference case for what happens when a settlement decides a commercially successful minority is the problem, and Chapter 5’s vocabulary is the right one for reading it.
The second is diplomacy, where India’s largest contribution to African economic governance was made. At the New Delhi summit on 9 September 2023, under India’s presidency, the African Union was admitted as a permanent member of the Group of Twenty (Group of Twenty, 2023). That is a real institutional gain obtained at no cost to the recipient, and the sort of thing money cannot buy. Set against it, India’s own flagship, the India-Africa Forum Summit, has met three times, in 2008, 2011 and 2015, and not since (Ministry of External Affairs of India, 2025). India’s Africa policy has more substance than pageantry, which is the reverse of the usual complaint.
4. Turkey: the Ankara model
Turkey’s method is the most easily described of the five because it is the most deliberate, and it has been executed in the same order everywhere.
First the embassy: Turkey had 12 embassies in Africa in 2002 and 44 by 2024, one of the largest networks on the continent (Daily Sabah, 2025). Then the airline. Turkish Airlines serves more than 60 destinations in Africa, 63 after Port Sudan was added in September 2025, so a businessman in Ouagadougou or Antananarivo reaches a global hub with one connection through Istanbul (Daily Sabah, 2025; American Journal of Transportation, 2025). Lift is the binding constraint on much African commerce, as Chapter 18 argues, and Turkey solved it by flying to places whose traffic no European carrier would justify. Then the contractors. The müteahhit, the Turkish contracting firm, is one of the two or three genuinely world-class Turkish export industries, and its cumulative project value in Africa is on the order of $85 billion: airports, stadiums, mosques, hospitals, roads and public buildings across the Maghreb, the Sahel and the Horn (Turkish Contractors Association, 2025). Then the goods: white goods, furniture, textiles, steel and food processing equipment, at price and quality points between Chinese and European.
And then the weapons. The Bayraktar TB2, a medium-altitude armed drone cheap enough for an African defence budget and effective enough to change a counter-insurgency campaign, has been sold to at least a dozen African states, among them Ethiopia, Mali, Niger, Burkina Faso, Togo, Morocco, Tunisia, Somalia, Nigeria, Angola, Djibouti and Kenya (Africa Defense Forum, 2025a). A government that can buy air power for the cost of a stretch of road has different options in a civil conflict than one that cannot, and Chapter 36 has to carry what that has meant in the Sahel and the Horn.
Turkey’s largest single position is Somalia, and it is the case that best shows what the model is for. Turkey entered during the famine of 2011, when almost nobody else would fly into Mogadishu, and it stayed: a hospital, the airport, the port, scholarships, and from 2017 the country’s largest overseas military facility, which trains a substantial share of the Somali army. A defence and economic cooperation framework agreed in 2024 provides for ten years of Turkish support to Somali maritime security and for Turkey to build, train and equip a Somali navy (Duvar English, 2024; Voice of America, 2024b). Somalia’s card shows what that has and has not bought: a working-age population growing at 3.79 percent a year, the second fastest of the 54, an employment ratio essentially flat at minus 0.09 percent, output per worker growing at 1.05 percent, and no recorded Chinese loan commitment at all, which makes it one of the very few African states where the external creditor question is not a Chinese question.
Turkey also does something none of the other four does at all, which is mediate. The Ankara Declaration of December 2024, which defused the crisis produced by Ethiopia’s memorandum with Somaliland over access to the sea, was brokered in Turkey between two governments that had both spent the year buying Turkish equipment (International Crisis Group, 2024). Chapter 29 carries the port politics. The point here is that a partner with commercial relationships on both sides of a dispute has an instrument that a partner with a relationship on one side does not.
5. Russia: security for resources
Russia is the smallest of the five on every economic measure and the largest on one that this book’s identity does not contain. Its two-way trade with Africa was about $24.5 billion in 2023, about a twelfth of China’s, and even that figure is a deputy minister’s statement rather than a published series (TASS, 2024).
What Russia sells is concentrated in three things. The first is grain and fertiliser, and it is genuinely important: Russia and Ukraine together supplied more than two fifths of the wheat African countries imported in the three years before 2022, about 32 percent from Russia and 12 percent from Ukraine by value, and the disruption that followed was the sharpest external shock to African food prices in a generation (UNCTAD, 2022). Russia has since become the single largest supplier of wheat to the continent, and has used grain shipments as an explicit instrument of diplomacy, announcing free deliveries to a handful of governments at the St Petersburg summit of July 2023. The second is nuclear technology. Rosatom is building Egypt’s El Dabaa station, four reactors totalling 4,800 MW in a project of about $30 billion financed mainly by a $25 billion Russian loan, and Chapter 14 records that its first reactor pressure vessel was installed in November 2025, with completion planned for 2028 to 2029 (Nuclear Engineering International, 2025). Nuclear is the one sector in which Russia offers something no other partner in this chapter offers on the same terms, including the financing and the fuel.
The third is security, and it is the relationship’s organising principle. The Wagner Group entered Africa as a private military company with a mining arm attached, and after its founder’s death in August 2023 its African operations were reorganised during 2024 into a structure of the Russian defence ministry usually called the Africa Corps. Russian personnel operate in Mali, Burkina Faso, the Central African Republic and Libya, whose bases also supply Sudan’s Rapid Support Forces (Africa Center for Strategic Studies, 2025c). The model is consistent enough to state as a formula: a government facing an insurgency or a coup risk receives troops, trainers, equipment and an information campaign, and pays in mining concessions, in cash from the treasury, or in both.
Chapter 31 describes what that arrangement looks like from inside in the Central African Republic, where the settlement rests on external security provision in exchange for concessions, which is to say on sovereignty rented out for protection with the rent paid in resources. The card is the darkest in this book: an economy of $3.19 billion, external debt of $1.05 billion, and a confidence flag that is not low but blank, because the country has never run a labour-force survey. Mali is the larger case and the more consequential one: a working-age population growing at 3.54 percent a year, the fourth fastest of the 54, an employment ratio falling at 0.72 percent, and a state that in the space of three years expelled a French force, a United Nations mission and a European training mission and replaced them with Russian contractors.
What Russia finances is close to nothing. There is no Russian development bank in Africa, no meaningful concessional window and no measurable investment outside mining and the nuclear programme. What there is instead is forgiveness of old claims: something on the order of $23 billion of Soviet-era and Russian debt has been written off across the two Russia-Africa summits and the preceding decades, which is a real transfer and also the cheapest possible one, since most of it was never going to be repaid (Government of the Russian Federation, 2023). A partnership whose principal financial instrument is the cancellation of an uncollectable claim is a partnership that costs its sponsor very little, which is the point.
What Russia wants is votes, bases, gold and the demonstration that the Western security order is not the only one on offer. The first is measurable in General Assembly roll calls and the last is not measurable at all, which has not stopped it from working.
6. The West: rules, preferences and a retreat
“The West” is not one partner and treating it as one is the error that makes most commentary about it useless. It is a trade bloc that regulates, a superpower that grants preferences and cuts them, a former colonial power withdrawing under pressure, and a set of multilateral institutions that are the real instrument of all of them. Take them in that order.
The United States
The American relationship with Africa has three legs and two of them broke in 2025.
The first is trade preference. The African Growth and Opportunity Act, enacted in 2000, granted duty-free access for apparel and other goods from qualifying African countries and is the reason there is an African cut-and-sew industry at scale. It lapsed in 2025 and was restored retroactively, for a single year to the end of 2026, by a law enacted in February 2026 (United States Congress, 2026). Chapters 15 and 29 carry the consequences: during the lapse, Kenya’s trade-weighted average American tariff rose from about 10 percent to about 28 percent, Lesotho’s from about 15 to about 32, and Madagascar’s to about 23, and orders were cancelled and plants closed (UNCTAD, 2025a). Chapter 29 records what removal from the preference did to Ethiopia in 2022: about 11,500 jobs lost and eighteen foreign companies gone, on the central bank’s own count (National Bank of Ethiopia, 2026).
The tariff regime introduced in 2025 compounded it. A general baseline duty with higher country-specific rates applied from April 2025, and Lesotho, a country of about 2.3 million people whose apparel exports go almost entirely to the United States, was assigned a rate of 50 percent, the highest of any country in the world, before it was suspended and later reset at 15 percent (United States Executive Order, 2025). There is no economic reading of that sequence in which the Lesotho number was about Lesotho: it was the arithmetic consequence of a formula applied to a bilateral trade balance, and it fell on the African country most dependent on a single foreign market. Chapter 15 owns the identity content, and it is direct. Apparel is the one African industry that reliably converts term one into term two, and its terminal market is decided annually by a legislature in another hemisphere.
The second leg is development finance, and it is the leg that grew. The American development finance corporation and the Partnership for Global Infrastructure and Investment are how the United States has re-entered African infrastructure in explicit competition with Chinese lending, and Chapter 30 describes the flagship: $753 million of debt financing for the Lobito Atlantic Railway concession, raised alongside the Development Bank of Southern Africa, with a greenfield line from eastern Angola into the Zambian Copperbelt in preparation.
Sitting in front of those tools, rather than instead of them, is Prosper Africa: an interagency deal-facilitation platform, market intelligence and transaction support across a set of American agencies, and a path into the finance instruments those agencies already have (Millennium Challenge Corporation, 2025). It is a rail, not a mega-fund, and it will not underwrite the Union’s infrastructure list. Chapter 19 is where that list is taught as a published filter of sixty-nine projects rather than as a pipeline of claims. The complementary American friction, recorded as a field note rather than as a statute, is that America-based persons typically want a United States institution handling the compliance before money crosses a border. Nigeria’s 2017 diaspora issue showed that a dual-listed, registered structure can clear; Ethiopia’s earlier marketing to United States persons is the enforcement case (Debt Management Office of Nigeria, 2017; Securities and Exchange Commission, 2016). The wrapper is necessary and not sufficient. Bankability, foreign exchange and governance usually fail first.
The third leg is health aid, and it broke hardest. The President’s Emergency Plan for AIDS Relief, launched in 2003, has received more than $130 billion in appropriations and reports having saved an estimated 26 million lives (KFF, 2026). It is by a wide margin the most consequential thing the United States has done in Africa this century, sustained across administrations of both parties for twenty years. During 2025 the American aid apparatus was dismantled: the great majority of the development agency’s programmes were cancelled and its residual functions absorbed into the State Department from 1 July 2025. A modelling study published in The Lancet estimated that maintaining the reductions could be associated with about 14 million additional deaths by 2030, roughly a third of them children (Cavalcanti et al., 2025). That is a projection under a maintained-cuts scenario rather than an observation, and it should be read as one. It is also the largest number in this chapter.
The European Union
Europe’s relationship with Africa is the largest in trade, the largest in investment stock, the oldest in institutional form, and the one most likely to be described by both sides as unsatisfactory.
Its trade instrument is the Economic Partnership Agreement, the reciprocal arrangement negotiated from 2002 to replace unilateral preferences the World Trade Organization found incompatible with its rules, and never completed as designed. What exists is a patchwork: a full regional agreement with the Southern African group, interim bilateral arrangements with individual West and East African states that signed rather than lose access, and regional agreements for West Africa and the East African Community that were concluded in 2014 and are still not in force because the groupings could not agree among themselves, Nigeria having never signed the West African one (European Commission, 2026b). The reason matters for Chapter 7. A reciprocal agreement between the European Union and a subset of a regional community’s members punches a hole in that community’s common external tariff, because a good entering duty-free through the signatory can then move inside. African negotiators said so at the time. Europe’s own architecture is, in this specific and well-documented way, a competitor to African regional integration rather than a support for it.
Its money instrument is Global Gateway, a mobilisation target of €300 billion to 2027 of which about half is the Africa-Europe Investment Package, launched in 2021 and pitched openly as an alternative to Chinese infrastructure finance (European Commission, 2025). A mobilisation target is not a budget: it counts grants, loans, guarantees and the private capital those are expected to leverage, the additionality of that last tranche is exactly what nobody can verify, and a substantial share of the total was committed under other headings first.
Its regulatory instruments have the sharpest edge. The carbon border adjustment mechanism will price the embedded carbon of imported cement, steel, aluminium and fertiliser at the European frontier, hitting African exporters twice, once on the carbon intensity of the product and once on that of the grid it was made with, as Chapter 15 sets out. The deforestation regulation bars cocoa, coffee, palm oil, rubber and other commodities from the European market unless the operator can show with plot geolocation that the land was not deforested after the end of 2020, which is Chapter 11’s subject and the most consequential regulation of the decade for West African cocoa (European Union, 2023a). Neither was designed as African policy. Both are African policy in effect, made by a legislature in which no African state is represented, and both apply the American preference’s logic: market access on the buyer’s terms, revised on the buyer’s schedule.
Underneath all of it sits migration, the actual driver of European policy toward Africa and generally the last thing named in a communiqué. The pattern since 2023 is explicit: financial packages agreed with North African governments in exchange for border enforcement, of which the memorandum with Tunisia in July 2023 and the €7.4 billion package agreed with Egypt in March 2024 are the largest (European Commission, 2024). Chapter 10 gives the proportions that make this strange. About 67,000 people arrived in Europe on the central Mediterranean route in 2024, against about 25 million Africans living in another African country, so the crossings that dominate European politics are roughly a quarter of one percent of intra-African migration (Frontex, 2025; UN DESA, 2025a). Europe is buying enforcement of a small flow from governments that understand exactly what it is worth to the buyer.
France, and the end of Françafrique
Françafrique names the post-independence system through which France retained decisive influence over its former African colonies: a currency arrangement, garrisons, an intelligence relationship, concessions in extractive industries, and personal relationships between presidencies that ran outside the ordinary machinery of either state. As an economic fact it had been eroding for thirty years; as a political fact it ended in the four years to 2025, and the military map tells it plainly. France closed or handed over its bases in Mali in 2022, in Burkina Faso and Niger in 2023, and in Chad, Senegal and Côte d’Ivoire in 2025, leaving Djibouti as its only substantial permanent facility on the continent (Lawal, 2023; Agence France-Presse, 2025). Some of those were expulsions by governments that had taken power in the coups Chapter 5 counts; some were negotiated withdrawals by governments in no danger at all, which is the more telling category, because Senegal and Côte d’Ivoire asked France to leave from a position of strength.
The currency half is Chapter 8’s and has moved less. The 2019 to 2021 reform ended the requirement to hold half the West African union’s reserves at the French Treasury, closed the operations account and withdrew French representatives from the central bank’s organs. The peg to the euro at 655.957 and the French guarantee of unlimited convertibility both remain, and in the Central African union nothing changed at all. That asymmetry is the honest summary: the political and military architecture is gone and the monetary architecture is not, for the reason Chapter 8 gives, which is that the zone’s critics have to explain what happens on the first morning after.
Britain, Japan, Korea, and the multilaterals
Britain’s post-Brexit arrangement is the Developing Countries Trading Scheme, which replaced the European preferences it had left and is somewhat more generous on rules of origin. Against that it cut its aid: the government announced in February 2025 that assistance would fall from 0.5 percent to 0.3 percent of gross national income from 2027, the second reduction in five years (United Kingdom Government, 2025). Japan’s instrument is the Tokyo International Conference on African Development, meeting since 1993, whose ninth edition was held at Yokohama in August 2025 (Ministry of Foreign Affairs of Japan, 2025); Japanese engagement is quieter than any other here, weighted toward quality infrastructure and the Mombasa and Nacala corridors, and notable for surviving three decades without a rebranding. South Korea held its first Africa summit in Seoul on 4 and 5 June 2024, with delegations from 48 African countries, and announced $10 billion in development assistance by 2030 and $14 billion in export finance (Republic of Korea, 2024). Both are worth watching for one reason: their own development sequences are the closest of any partner to the recipe of Chapter 9, and neither has found a way to transfer it.
The multilaterals are the West’s real instrument. The World Bank’s twenty-first replenishment of its concessional window raised a headline $100 billion in December 2024 against a $120 billion ask, on donor pledges of about $23.7 billion; the African Development Fund’s seventeenth replenishment raised $11 billion in December 2025 against an initial $25 billion target, with 23 African countries pledging $182.7 million between them (World Bank, 2025h; African Development Bank, 2025a). The African contribution is small in money and large in signal: it is the first replenishment in which the borrowers put in their own money in order to argue about the terms. The African Development Bank elected a new president on 29 May 2025, its first from Mauritania, who took office that September, and the succession mattered because the bank is the one institution here whose governors are majority African (African Development Bank, 2025b).
7. The aid retreat after 2025
The single most consequential thing that happened to Africa’s external relationships in the period this book covers was not a summit or a corridor. It was that the aid stopped.
Official development assistance from the donors of the Development Assistance Committee fell 23.1 percent in real terms in 2025, to $174.3 billion, or 0.26 percent of their combined national income, and bilateral assistance to Sub-Saharan Africa fell 26.3 percent, to $29.2 billion; the American reduction alone was 56.9 percent, and the committee projects a further fall in 2026 (OECD, 2026). These are preliminary figures, revised at the final release, and they are the largest one-year contraction in the sixty-year history of the series.
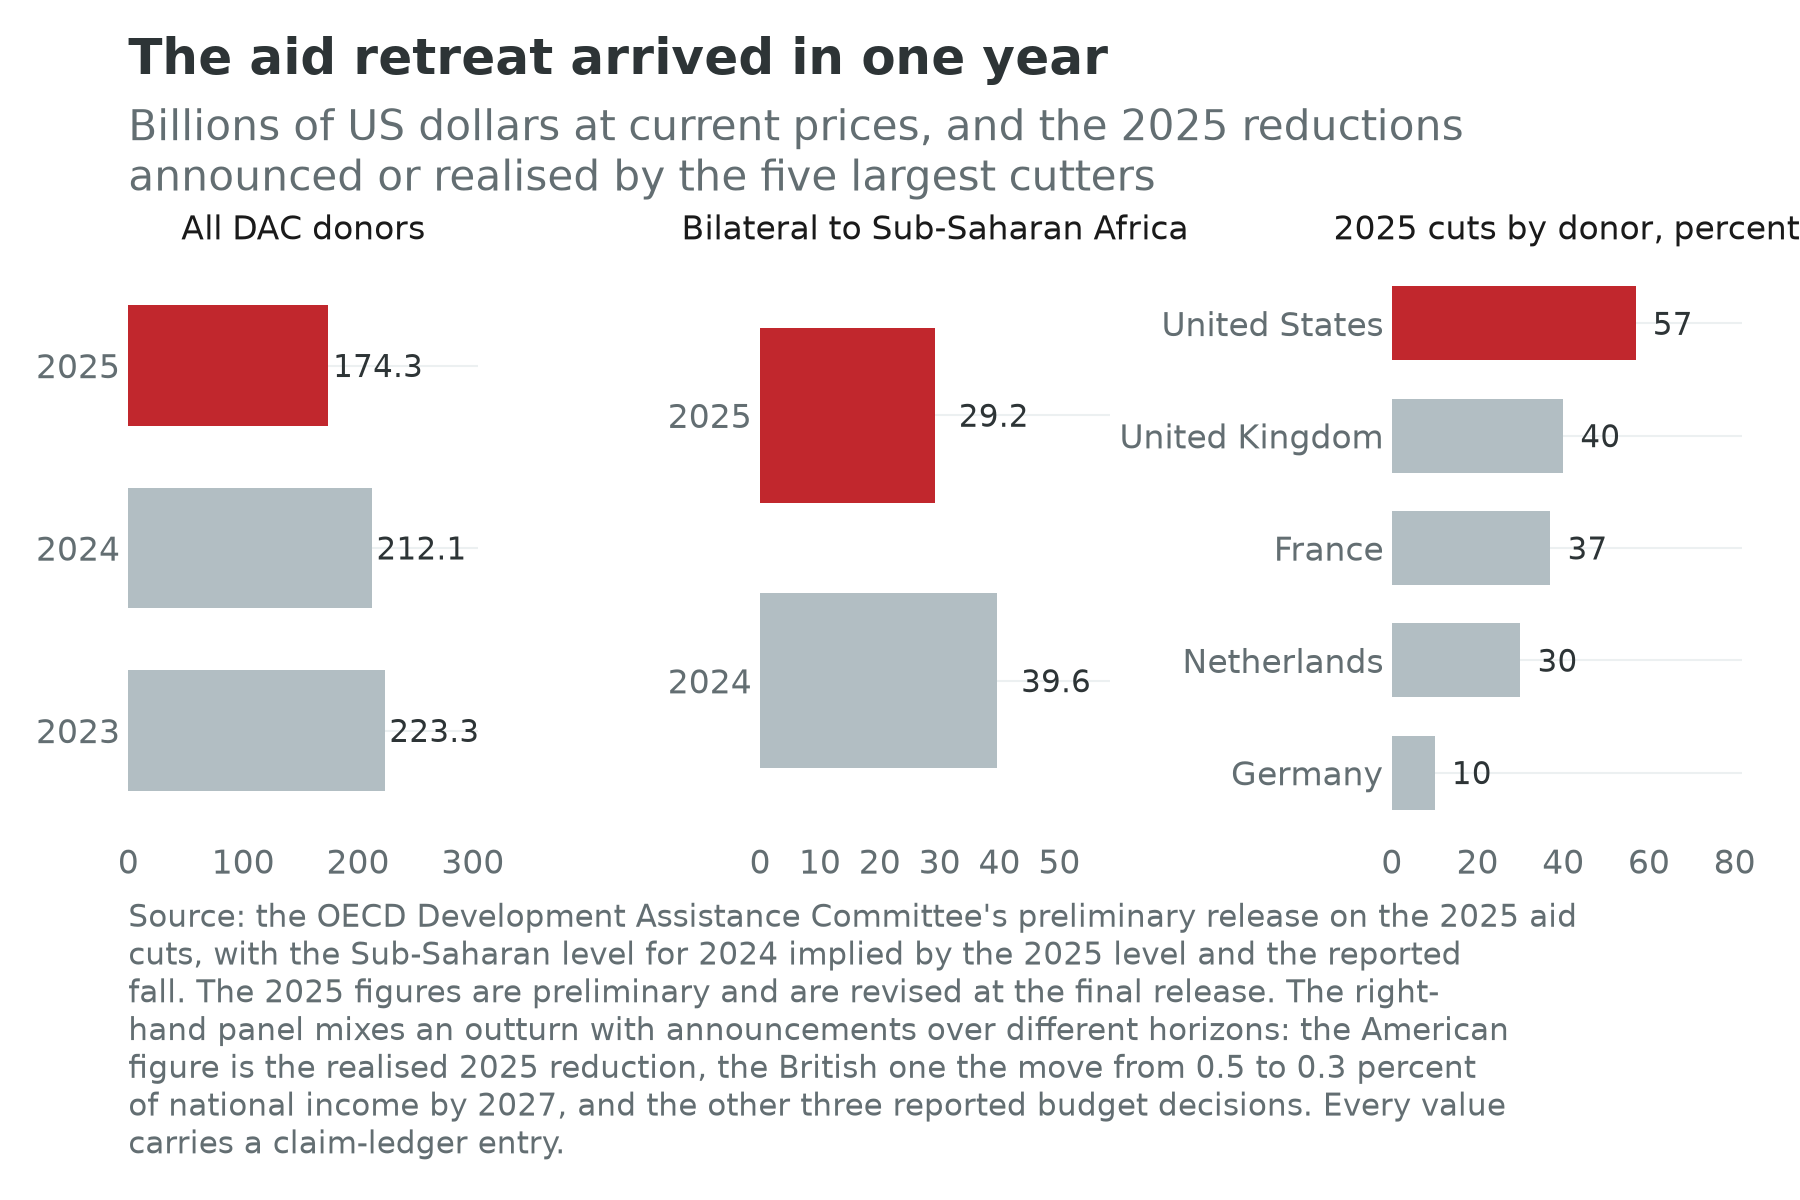
The cuts were not one decision. The United States dismantled its development agency. The United Kingdom announced the move from 0.5 to 0.3 percent of national income. France cut its development budget by something on the order of a third in the 2025 finance law, the Netherlands announced a phased reduction of comparable proportion to 2027, and Germany reduced its development ministry’s budget with further reductions flagged. Five governments, five domestic political arguments, one continent on the receiving end of the sum.
Where the cuts landed is not evenly distributed and the pattern is grim. Aid is concentrated in health and humanitarian response, because those are the sectors donors can point at, and it is concentrated in exactly the states with the thinnest fiscal capacity to substitute. Chapter 23 takes up the health arithmetic and the specific question of what happens to an antiretroviral programme that has kept several million people alive for two decades when its financing is withdrawn inside a single budget cycle. What belongs here is the balance-sheet observation. A country whose health system is largely externally financed does not have a health system with a funding gap; it has somebody else’s health system, and Chapter 5’s finding is why: the governments of the 36 African countries in the continental revenue statistics collected on the order of 16 percent of their output in tax in 2022, against more than 30 percent across the rich democracies (OECD, African Union Commission and ATAF, 2024).
The African response has taken two forms, and the more interesting one is rhetorical. “Aid is over” has become a standard formulation in African finance ministries since 2025, and it is being used to argue for something: domestic resource mobilisation, continental institutions, African credit ratings, African capital markets. There is something bracing about a discourse that treats a catastrophe as a liberation, and something evasive about it too, because raising an African tax ratio from its typical 16 percent of output to 20 is a decade of administrative work (OECD, African Union Commission and ATAF, 2024), as Chapter 5’s Kananga experiment shows at the scale of one city, and the money that has gone was going to hospitals this year. The second form is the reordering of who the partners are. Every actor in Sections 2 to 5 is more important in 2026 than in 2024, and none of them because they did anything: the denominator moved.
8. Where the partners sit in the identity
Now the arithmetic, which is the least ambiguous part of the chapter.
None of these partners moves term one. The growth of the working-age population is set by births fifteen to sixty-four years earlier and is unaffected by a summit, a preference or a port concession. The one channel that touches it at all is migration, since a corridor taking workers out reduces the domestic working-age population, and Chapter 10 shows those flows to be small relative to the cohorts.
They move term three, through capital and market access, and less than they claim. This is the term every partnership announcement is implicitly about. A port that clears containers faster, a transmission line, a fertiliser plant, an assembly plant serving a duty-free market: all raise output per worker if they work. The difficulty is that the effect is easy to see in the anecdote and hard to see in the aggregate.
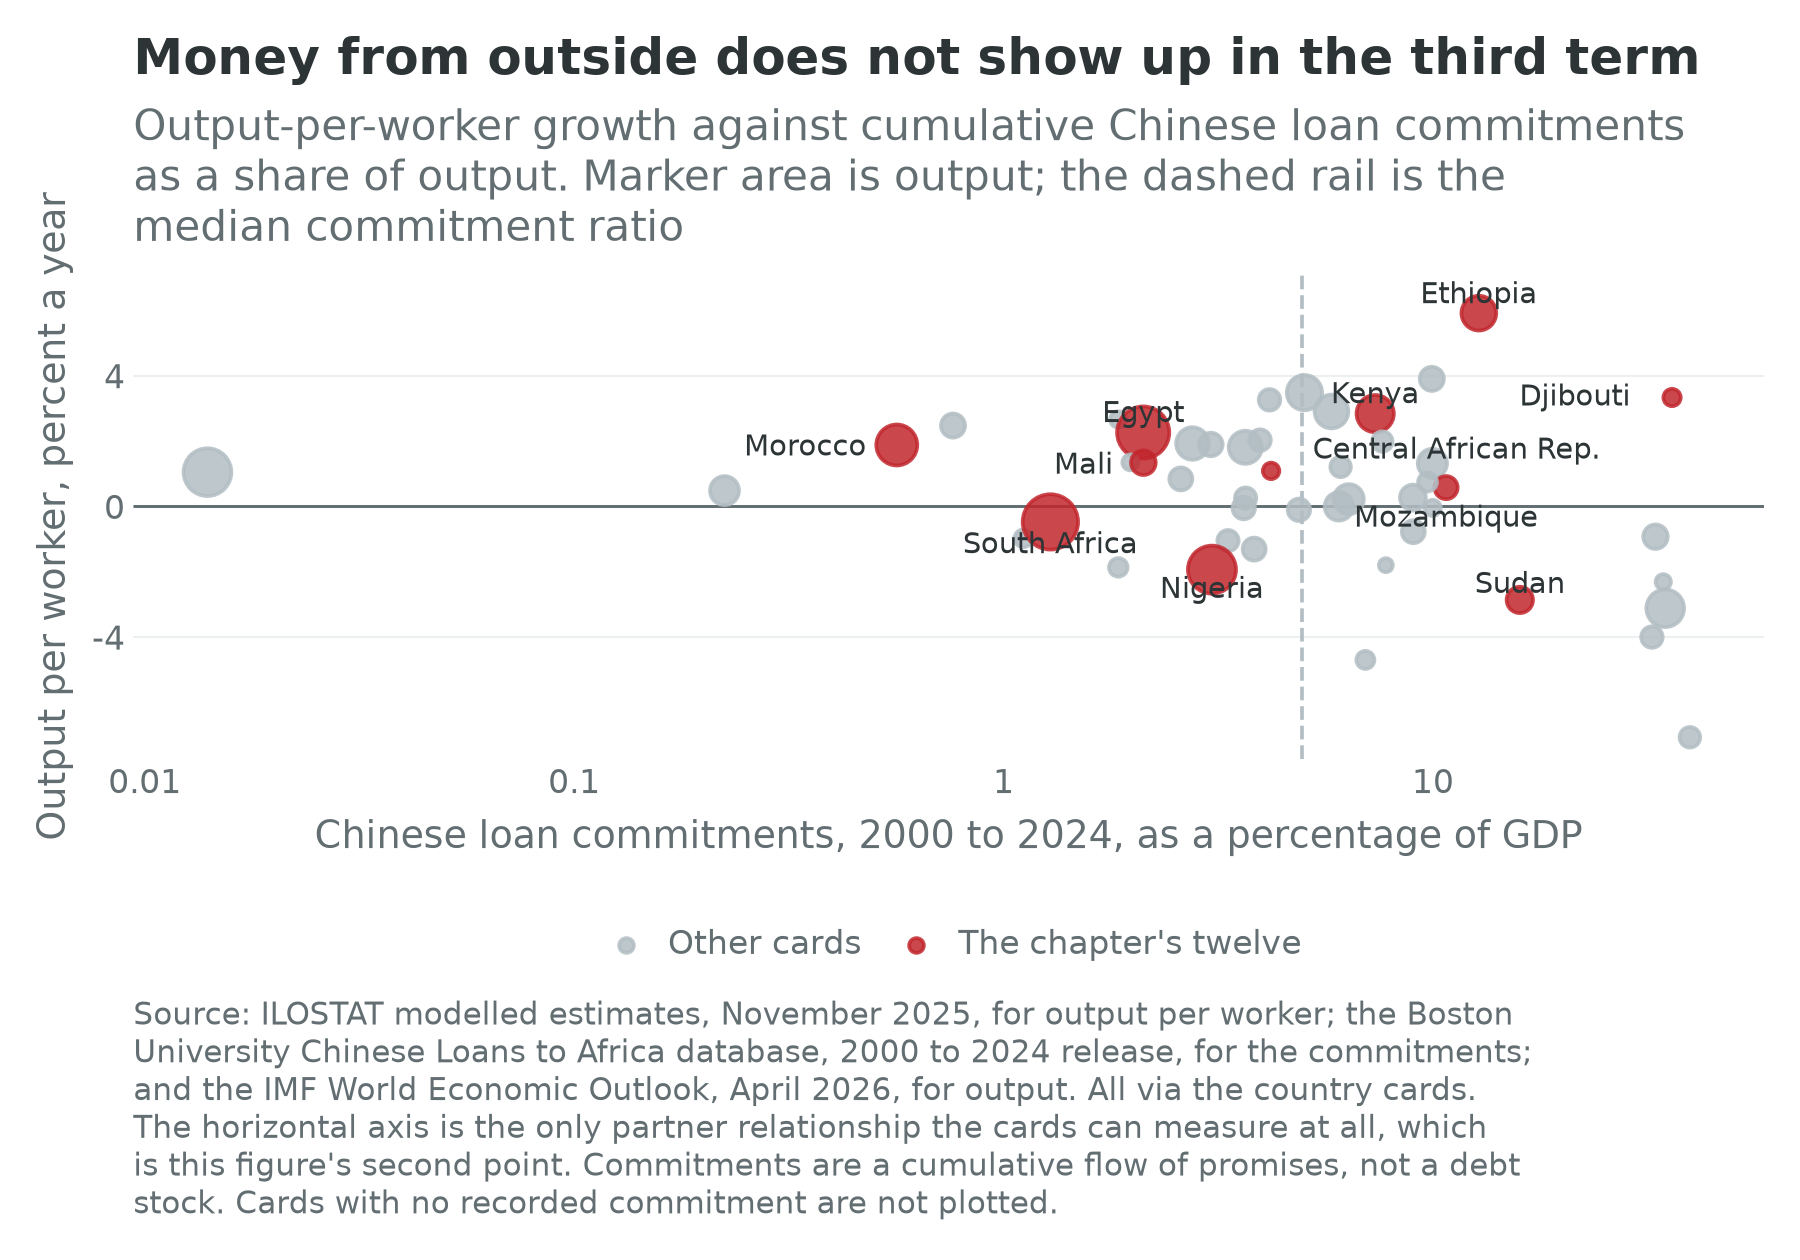
Be precise about what that cloud does and does not establish. It does not show that external finance is useless: the countries that borrow most are the countries with the least of everything, so a raw cross-section confounds the treatment with the reason for it, which is the identification problem Section 9 is about. It does show that a decade of very large commitments, running to a median of 4.9 percent of output across the 49 cards and above 30 percent on six of them, left no visible signature in the term those commitments were justified by. Anyone claiming that a partnership raises productivity owes the reader an account of why this scatter looks the way it does.
They barely touch term two, and this is the finding that ought to change how the partnership literature is written. Ports employ few people, and mines fewer, as Chapters 13 and 30 record. A sovereign fund’s coastal development employs construction workers for a decade and hotel staff afterwards, and Chapter 18 is careful about how much. Concessional lending finances capital. Aid finances services, and the health workforce it employs is real employment, a point rarely made in its defence and one the 2025 cuts have made concrete. The single partner instrument here with a large and demonstrable effect on the employment ratio is the American trade preference, because apparel is labour-intensive and the preference is what made African apparel exportable, and that instrument is renewed one year at a time.
Table 33.2 sets out the twelve countries whose partner relationships this chapter has discussed, with their identity terms, their Chinese loan commitments for contrast, and their confidence flags. Between them they hold 51.2 percent of the continent’s population and produce 51.7 percent of its output, so this is half of Africa by either measure.
| Country | Term one: working-age population | Term two: employment ratio | Term three: output per worker | Implied growth | Observed growth | Chinese commitments ($bn) | Commitments, percent of GDP | Confidence |
|---|---|---|---|---|---|---|---|---|
| Egypt | 1.96 | 0.07 | 2.26 | 4.29 | 4.33 | 7.71 | 2.1 | high |
| Morocco | 1.10 | -0.45 | 1.88 | 2.53 | 2.54 | 1.03 | 0.6 | high |
| Ethiopia | 3.46 | -1.58 | 5.91 | 7.79 | 7.92 | 13.96 | 12.8 | low |
| Kenya | 2.94 | -1.17 | 2.84 | 4.61 | 4.62 | 10.01 | 7.3 | high |
| Nigeria | 2.90 | 0.29 | -1.94 | 1.25 | 1.20 | 8.88 | 3.1 | low |
| South Africa | 1.61 | -0.45 | -0.48 | 0.68 | 0.67 | 5.49 | 1.3 | high |
| Sudan | 3.20 | -0.81 | -2.87 | -0.48 | -4.91 | 6.33 | 15.9 | low |
| Mali | 3.54 | -0.72 | 1.33 | 4.16 | 4.27 | 0.64 | 2.1 | medium |
| Central African Republic | 1.27 | 0.01 | 1.08 | 2.36 | 2.56 | 0.13 | 4.2 | not computed |
| Mozambique | 3.25 | -0.47 | 0.57 | 3.35 | 3.35 | 2.40 | 10.7 | medium |
| Djibouti | 2.28 | -0.20 | 3.33 | 5.41 | 5.46 | 1.58 | 36.0 | medium |
| Somalia | 3.79 | -0.09 | 1.05 | 4.75 | 2.83 | none recorded | low | |
| Continental median | 2.89 | -0.15 | 0.74 | 2.91 | 4.9 |
The first five numeric columns are annual growth rates in percentage points over 2014 to 2024. Term one is the working-age population aged 15 to 64; term two is modelled employment aged 15 and over divided by that population; term three is the residual output-per-worker series. The commitment column is a cumulative flow of promises between 2000 and 2024, not a debt stock, and the ratio divides it by a single year’s output, so it is a scale marker rather than a burden. The median row is taken column by column and is not a country. Sources: UN World Population Prospects 2024, ILOSTAT modelled estimates (November 2025), the IMF World Economic Outlook (April 2026) and the Boston University Chinese Loans to Africa database, via the country cards.
Read down the last three columns and the chapter’s central limitation is visible. Djibouti carries cumulative Chinese commitments worth 36.0 percent of a year’s output, the second highest ratio of the 49 cards, and hosts American, French, Japanese, Italian and Chinese military facilities at once, the densest concentration of foreign bases anywhere in the world. Its third term, at 3.33 percent a year, is the third strongest in the table. A reader wanting to know whether that productivity came from the port, the bases, the transit trade with Ethiopia or the loans that built the railway will find nothing in the cards to settle it, because the cards can see one partner and Djibouti has six.
Four of the twelve carry a high confidence flag, four a low one, three medium and one none at all, which is roughly the continental distribution and a reminder that half of Africa by population is being described here with the statistical apparatus Chapter 1 set out.
9. What the evidence says
What forty years of aid regressions can and cannot settle
The question “does this partnership help?” has been asked most systematically of aid, the one partner instrument with a long standardised cross-country series behind it. The literature is a case study in how hard the question is, and every claim made for a port concession or a trade preference faces the same problem with less data.
The conditional result, and its collapse. Burnside and Dollar (2000) found that aid raised growth in countries with good fiscal, monetary and trade policies and not otherwise. The finding supplied an intellectual basis for donor selectivity and shaped a decade of practice. Easterly, Levine and Roodman (2004) then extended the same dataset with more years and more countries, using the authors’ own specification, and the interaction term ceased to be significant. The result was not fraudulent; it was fragile, which in a cross-country regression with a few dozen observations and a hand-chosen policy index is the normal condition.
The null, carefully constructed. Rajan and Subramanian (2008) went after the identification problem directly, instrumenting aid with the donor-side determinants of who gives to whom, and found little robust evidence of any effect on growth over any period, in any subsample, or for any type of aid. Their reading was not that aid does nothing but that a cross-country growth regression is the wrong instrument for detecting what it does.
The two identification strategies that work. Sebastian Galiani, Stephen Knack, Lixin Colin Xu and Ben Zou (2017) exploit a rule rather than a correlation: countries crossing the World Bank’s income threshold for concessional lending lose access to it, and the crossing turns on an income cutoff rather than on anything about the country’s politics. Using that discontinuity they find a positive effect, an extra percentage point of aid to income raising annual growth by about a third of a point. Dreher and Langlotz (2020) use a different excludable instrument, donor-government fractionalization interacted with a recipient’s probability of receiving aid, and find no significant effect. Two credible designs, two answers, which is where the literature stands.
What aid does when it is food. Nunn and Qian (2014) asked a narrower question with a cleaner design. Instrumenting American food aid with United States wheat production lagged and interacted with a country’s propensity to receive it, they found that an increase in food aid increased the incidence and duration of civil conflict in recipient countries, with the effect concentrated in countries with a recent history of conflict. A transfer that is a physical, stealable, storable commodity delivered into a contested territory is a resource that armed groups can capture, and that is a mechanism, not a scandal.
The trade-preference evidence is better, and narrower. Frazer and Van Biesebroeck (2010) used the variation in which products were and were not covered by the American preference, comparing eligible and ineligible goods within countries and within product categories, and found large and persistent effects on the covered lines, in apparel above all. That is the strongest thing anybody has demonstrated about any partner instrument in this chapter, and Rotunno, Vézina and Wang (2013) supply the qualification: much of the African apparel response was Chinese firms relocating cut-and-sew capacity to use the preference, and exports fell away when the special fabric provisions lapsed. The industry was real and its owners were not local, which is Chapter 15’s argument and Chapter 29’s Ethiopian evidence in one sentence.
What none of this can answer. Every design above identifies the effect of one flow on one outcome for one set of countries. None evaluates a partnership, because a partnership is a bundle of trade, capital, security, diplomacy and regulation that arrives together and cannot be randomised. When somebody says the Gulf relationship is good for Egypt or that Russian security provision is bad for Mali, they are making a judgement the evidence base can inform and cannot settle, and the honest form of the claim says so.
10. Partners in two worlds
Chapter 1 set out the assumption underneath the identity and the world in which it fails: one in which the frontier of production is a stock of machines and energy rather than a stock of workers, so that the marginal worker stops being the thing growth is made of. The external partners look different in that world, and one of them looks like a preview of it.
In the labour-abundant world the partners are what they say they are. They supply capital and market access to an economy whose scarce factor is capital and whose abundant factor is labour, and the test of a relationship is whether it converts that abundance into wage employment. On that test the American trade preference has done more than everything else in this chapter put together, for the reason Section 8 gives: it is the only instrument that paid for unskilled hours.
In the labour-redundant world the picture inverts. Look again at what each partner buys. The Gulf buys land, coastline, ports, farmland and mines. India buys minerals and agricultural raw material. Russia buys mining concessions and sells reactors. Europe buys commodities and sells rules. Every one of those is a claim on an asset rather than on labour, and every one is worth more, not less, if the frontier stops needing workers. The partners are already positioned for the second world. What none of them is buying is African labour, and the one instrument that did buy it is renewed annually.
The Gulf is the clearest case and the most instructive, because it is a rent economy buying rent assets abroad. A state whose income is a hydrocarbon rent with a known expiry is doing exactly what Chapter 1 says an economy should do when it expects the terms of trade for its endowment to move against it: converting the rent into claims on assets whose value survives the transition. Land, ports, sun and ore are the four things Chapter 1 names as African holdings in the labour-redundant world, and the Gulf is systematically buying three of them. That is not a conspiracy; it is a correct forecast, executed. The question it puts to an African finance ministry is uncomfortable and precise: if the assets that will matter in 2060 are being bought now at 2026 prices by the only actors who have both the capital and the forecast, what is the country selling and what does it plan to have left?
One further thing, running through Chapter 10’s migration section. Every corridor that carries African workers out, to Europe or to the Gulf, exists because a receiving economy wants labour, and remittances are the price of that labour paid by a foreign employer: the largest, most stable and least conditional external flow the continent receives, larger than aid and in some years than foreign direct investment. A world in which the receiving economies no longer need workers closes that corridor before anything in Africa has been automated. Europe’s migration politics, read from one side, is the labour-abundant world’s pressure valve; read from the other, it is the first institution of the labour-redundant one, a rich region deciding it does not need the workers it is being offered. Which reading is right is the question the century turns on, and the policy looks identical either way.
11. What the cards can and cannot see
Data quality in this book is a layer rather than a caveat, and in this chapter the layer is the argument.
The country cards carry three of the flows this chapter is about, foreign direct investment, official development assistance and remittances, Egypt’s running to $15.5 billion, $0.5 billion and $41.5 billion. But each is a total and none is broken down by partner, and while the cards now list each country’s top three exports, there is still no field for bilateral trade with anyone. The only external relationship the cards can attribute to a partner is the Chinese one, and they can measure it only because a university research centre built a loan-level database and published it, which is the point Chapter 32 is organised around. There is no Emirati loan database, no Turkish contract database, no consolidated record of Gulf central-bank deposits at African central banks, and no public register of who owns which African port concession on what terms.
That is a fact about the world rather than an accident of this book, and it has consequences. Chapter 21’s balance-sheet lens asks where the funds come from and who owns what, and this chapter can answer neither question for four of its five partners. When the official debt statistics do not break bilateral lending out by creditor country, an African finance ministry negotiating with a Gulf sovereign fund is working without the aggregate picture its counterpart has. Chapter 21’s judgement is the one to carry: the deposits are the instrument to watch, because one rolled every year is a short-term liability that behaves like a long-term one until the year it is not rolled.
Two further limits belong on the page. Bilateral trade figures for African countries are unreliable in a documented way: mirror statistics, in which each side reports the same flow, diverge by more than 50 percent in over 40 percent of African country pairs (Wilse-Samson, 2026). Every bar in Figure 33.1 therefore rests on the partner’s reporting rather than the African side’s, because the partner’s customs administration is usually better resourced, and the ranking should be treated as firmer than the gaps. And the announcement figures that dominate reporting of Gulf, Turkish and Western investment are announcements: a commercial database records a press release, and the share of announced value that reaches financial close is unknown and certainly well under one.
Connections to Other Chapters
- Chapter 5 (States, Political Settlements, and Development Bargains) supplies the vocabulary for reading a security-for-resources arrangement as a settlement, and the tax ratios that make the aid retreat bind; Chapter 7 (Regional Architecture) owns the African integration architecture that the European partnership agreements cut across.
- Chapter 8 (Money and Currency) carries the CFA franc arrangement and the Egyptian float that a Gulf deposit made possible; Chapter 10 (Labor, Youth, and Migration) owns the migration corridors and remittance flows this chapter’s last section depends on.
- Chapters 11, 12, 14, 18, 19 and 22 carry the sectoral halves of the Gulf relationship: the agricultural trading layer, oil and gas, Saudi power generation, tourism and coastline, the port operators, and farmland.
- Chapter 15 (Manufacturing and the Auto Industry) owns the American trade preference and the European carbon border adjustment; Chapter 21 (Capital and Sovereign Debt) owns the creditor composition this chapter cannot see, and the Gulf as a creditor. Chapter 19 takes Prosper Africa as a facilitation rail rather than a PIDA underwriter; the UNGA Week 2026 field notes are the primary record of that American compliance preference.
- Chapters 27, 28, 29, 30 and 31 carry the poles where the partners are most visible: Gulf capital in Egypt, Europe in Morocco, Turkey in the Horn, American and European finance on the Lobito corridor, and Russian security provision in the Central African Republic.
- Chapter 32 (China in Africa) owns the partner this chapter deliberately does not describe; Chapter 34 (Climate Finance) asks whether the climate instruments are additional or the same money relabelled; and Chapter 36 (What Could Go Wrong) owns the Sudan war and the Sahel.
Discussion Questions
Table 33.1 puts the partners on four columns, and every column mixes measurements with reports. Choose the two columns you would keep if you could keep only two, defend the choice by saying what question they answer that the others do not, and then say what a reader who saw only your two columns would get wrong about the Gulf.
Frazer and Van Biesebroeck (2010) find large effects of the American trade preference on covered products, and Rotunno, Vézina and Wang (2013) find that much of the apparel response was foreign firms relocating to use it. Both are true. Argue for one of two positions: that a preference which attracts foreign-owned assembly is still the best instrument in this chapter because it is the only one that buys unskilled hours, or that an industry whose owners will leave when the preference lapses was never a development strategy. Then say what evidence, observable before 2030, would move you.
The Gulf is buying African land, ports, coastline and mines, and Section 10 argues that this is a rent economy correctly forecasting which assets hold value in a labour-redundant world. Suppose that forecast is right. Write the case for an African government selling those assets now at 2026 prices, and the case against, and say which piece of information, if a finance ministry had it, would decide between them.
Try It
Open the Sovereign Debt Tracker and switch to the creditor view for Egypt, Kenya and Mozambique in turn. For each, read the multilateral, official bilateral, bond and other-private lines, then set the Chinese commitment series beside them. Write one paragraph on a single question: the Gulf appears in none of these creditor lines by name, and Chapter 21 says that Gulf money arrives as central-bank deposits, project finance and occasional equity commitments large enough to substitute for a Fund programme. Where in these three balance sheets would a Gulf deposit actually show up, which of the three countries would be most exposed if it were not rolled, and what would you need to see on a card, that is not there now, to answer that without guessing?
Data Exercise
Download all fifty-four cards from the country cards page on this site, as cards.csv if you work in a spreadsheet and cards.json if you would rather have the release each number came from travelling beside it. Build a table with five columns: balance_sheet.china_loan_commitments_cumulative, balance_sheet.external_debt_by_creditor.eurobond, scale.gdp_usd, identity.output_per_worker_growth and data_quality.confidence_flag. Then do four things.
First, restrict to the cards carrying both a Chinese commitment and a bond line, compute each as a percentage of output, and rank the two lists. Report how many cards appear in the top ten of both, and name the countries where the bond line is larger than the cumulative Chinese commitment.
Second, reproduce Figure 33.3: plot output-per-worker growth against the commitment ratio on a logarithmic axis for every card carrying both, and compute the correlation. Then drop every card whose confidence flag is low or missing and compute it again. Say in two sentences whether the relationship you find is evidence about partnerships or evidence about which countries borrow.
Third, list every field on the cards that would let you measure a relationship with a partner other than China. Note which of them are null rather than zero on every card, and never impute a null as a zero.
Fourth, and this is the point of the exercise, write one paragraph naming the three partner relationships from this chapter that you consider most consequential for the countries in Table 33.2, and state for each what a single new card field would have to contain for the book to make a quantitative claim about it. Then say which of those three fields you think could actually be built from public sources, and which could not.
Data Sources and Further Reading
Key data sources
- The partners’ own trade statistics: the customs and trade administrations of the European Union, China, India, the United States, Turkey and Russia, and the Gulf states, for Table 33.1’s trade column. These are the partners’ figures rather than the African side’s, on definitions that differ, and are goods only.
- OECD Development Assistance Committee: aid volumes, the 2025 preliminary release and the by-donor reductions. The 2025 figures are preliminary and the 2026 projection is the committee’s own.
- Boston University Global Development Policy Center, Chinese Loans to Africa database, 2000 to 2024 release: the commitment column of Table 33.2 and the horizontal axis of Figure 33.3, a cumulative flow of promises rather than a debt stock, on the 49 cards carrying it.
- UN World Population Prospects 2024, medium variant; ILOSTAT modelled estimates, November 2025; and the IMF World Economic Outlook, April 2026: the identity terms and output levels in Table 33.2, via the country cards.
- fDi Markets, for the announced-investment figures: an announcement series recording press releases, not an outturn series, which is why every figure drawn from it here is hedged. Swissaid, for the reconciliation of African gold production against declared exports and destinations, a mirror-statistics discrepancy rather than a measured flow.
- UN Panel of Experts on the Sudan, ACLED and the Africa Center for Strategic Studies, for the security material in Sections 2 and 5, none of it a card field and all of it contested by at least one party.
- Company and institutional reporting: DP World, AD Ports and Adani Ports for the terminal portfolios; ACWA Power and Olam for the Saudi positions; Exim Bank of India for the credit lines; the Turkish Contractors Association and Turkish Airlines for the Turkish network; the Islamic Development Bank and the Kuwait Fund for the Arab official-finance record.
- Millennium Challenge Corporation, Prosper Africa, for the American deal-facilitation rail in Section 6; the US Securities and Exchange Commission and the Debt Management Office of Nigeria for the two diaspora-capital episodes that section cites.
- The New Regional Economics, chapter 14 (Wilse-Samson, 2026): the mirror-statistics problem underneath every bilateral trade figure here.
Further reading
- Craig Burnside and David Dollar (2000), with the Easterly, Levine and Roodman comment (2004), for the rise and fall of the conditional aid result, and Raghuram Rajan and Arvind Subramanian (2008) for the null constructed properly.
- Sebastian Galiani, Stephen Knack, Lixin Colin Xu and Ben Zou (2017) and Axel Dreher and Sarah Langlotz (2020), for two credible identification strategies that reach different answers, and Nathan Nunn and Nancy Qian (2014) for what happens when the transfer is a physical commodity delivered into a contested territory.
- Garth Frazer and Johannes Van Biesebroeck (2010) and Lorenzo Rotunno, Pierre-Louis Vézina and Zheng Wang (2013), for the effect of the American preference and for who owned the industry it created.
- Folashadé Soulé (2020), on the Africa+1 summits and the “new scramble” narrative, for the argument this chapter’s framing takes seriously: that the interesting variable is often the negotiating capacity of the African state rather than the intentions of the partner.
- Ken Ochieng’ Opalo, on why the development system has been slow to adapt to the official-aid cuts (Opalo, 2026b), and Stefan Dercon (2022), for why a development bargain is a domestic settlement before it is an external relationship.