28. Casablanca–Tangier
Pole type: productivity platform.
Fourteen kilometres of water separate Africa from Europe at the Strait of Gibraltar, and on the African side of it a port that did not exist in 2006 handled 11.1 million containers in 2025, more than any other port in the Mediterranean and more than any other port in Africa. Behind that port sit assembly plants that build more cars than any other country on the continent, a supplier network that feeds them, and a rail line on which a passenger leaves Tangier and reaches Casablanca in a little over two hours. Morocco has 2.5 percent of Africa’s people and produces 5.8 percent of its output, which makes it the continent’s fifth largest economy and, on the evidence of the next few pages, the clearest test anywhere in Africa of the proposition that a country can manufacture its way up.
Learning Objectives
After reading this chapter, you should be able to:
- Place Morocco in the book’s identity, explain why it is the continent’s clearest term-three pole, and say why its first term is one of the four slowest of the fifty-four while its third is well above the continental middle.
- Read a single-country pole against the continental distribution and against the book’s other two term-three poles, Egypt and South Africa, and say what the three have in common and where Morocco departs from both.
- Set out the pole’s balance sheet: what it owes, in what form, to whom, why the Chinese line is unusually small, and what an insurance arrangement with the Fund buys a country that has not drawn on it.
- Defend the claim that the binding constraint here is neither infrastructure nor the cost of finance, which is the reverse of the finding in Chapters 24 and 25, and name the evidence that would overturn it.
- Explain why a country that invests a quarter of its output every year, exports cars to Europe and runs the largest port in the Mediterranean still has a negative second term, and what female participation has to do with it.
Prior work: the regional-hegemon framing used throughout Part VI, and the Moroccan vehicle-production series that sits beside the Southern African one, are set out in the companion volume, The New Regional Economics, chapter 14 (Wilse-Samson, 2026). This chapter cites that material rather than repeating it, and adds what the volume does not have: the identity, the balance sheet, the diagnostic and the settlement.
Two conventions before the argument starts. This book treats Africa as fifty-four UN member states, and Morocco has one country card among them; the territory of Western Sahara is disputed, the book’s maps hatch it, and no separate card exists. The chapter says so once, here, and notes the territory again only where a specific asset sits in it.
The second is the pole’s shape. Every other chapter in Part VI describes a corridor between countries or a city-region with a hinterland across a border. This one is a single country, and the pole is an axis inside it: the coastal strip from Casablanca through Rabat and Kenitra to Tangier, roughly 350 kilometres holding the ports, the assembly plants, the banks and the high-speed line, with a phosphate belt inland and a solar frontier to the south.
1. The pole in the identity
Chapter 1 set out the identity the book runs on: output equals output per worker, times the employment-to-working-age ratio, times the working-age population, so that in growth rates GDP growth is approximately the sum of the three. Table 28.1 reports all three terms for Morocco, for the book’s other two term-three poles, and for the middle of the continental distribution.
| Country | Term one: working-age population | Term two: employment ratio | Term three: output per worker | Implied growth | Observed growth | Gap | Wage employment (percent of employment) | Non-agricultural employment (percent) | Confidence |
|---|---|---|---|---|---|---|---|---|---|
| Morocco | 1.10 | -0.45 | 1.88 | 2.53 | 2.54 | -0.01 | 59.6 | 71.7 | high |
| Egypt | 1.96 | 0.07 | 2.26 | 4.29 | 4.33 | -0.05 | 72.9 | 82.0 | high |
| South Africa | 1.61 | -0.45 | -0.48 | 0.68 | 0.67 | 0.01 | 82.7 | 94.6 | high |
| Continental median | 2.89 | -0.15 | 0.74 | 2.91 | 31.0 | 59.0 |
All figures are annual growth rates in percentage points over 2014 to 2024 except the last three columns, which are shares and a flag. Term one is the working-age population aged 15 to 64; term two is modelled employment aged 15 and over divided by that population; term three is the residual output-per-worker series. The median row is taken column by column and is not a country. Sources: UN World Population Prospects 2024, ILOSTAT modelled estimates (November 2025), and the IMF World Economic Outlook (April 2026), via the country cards.
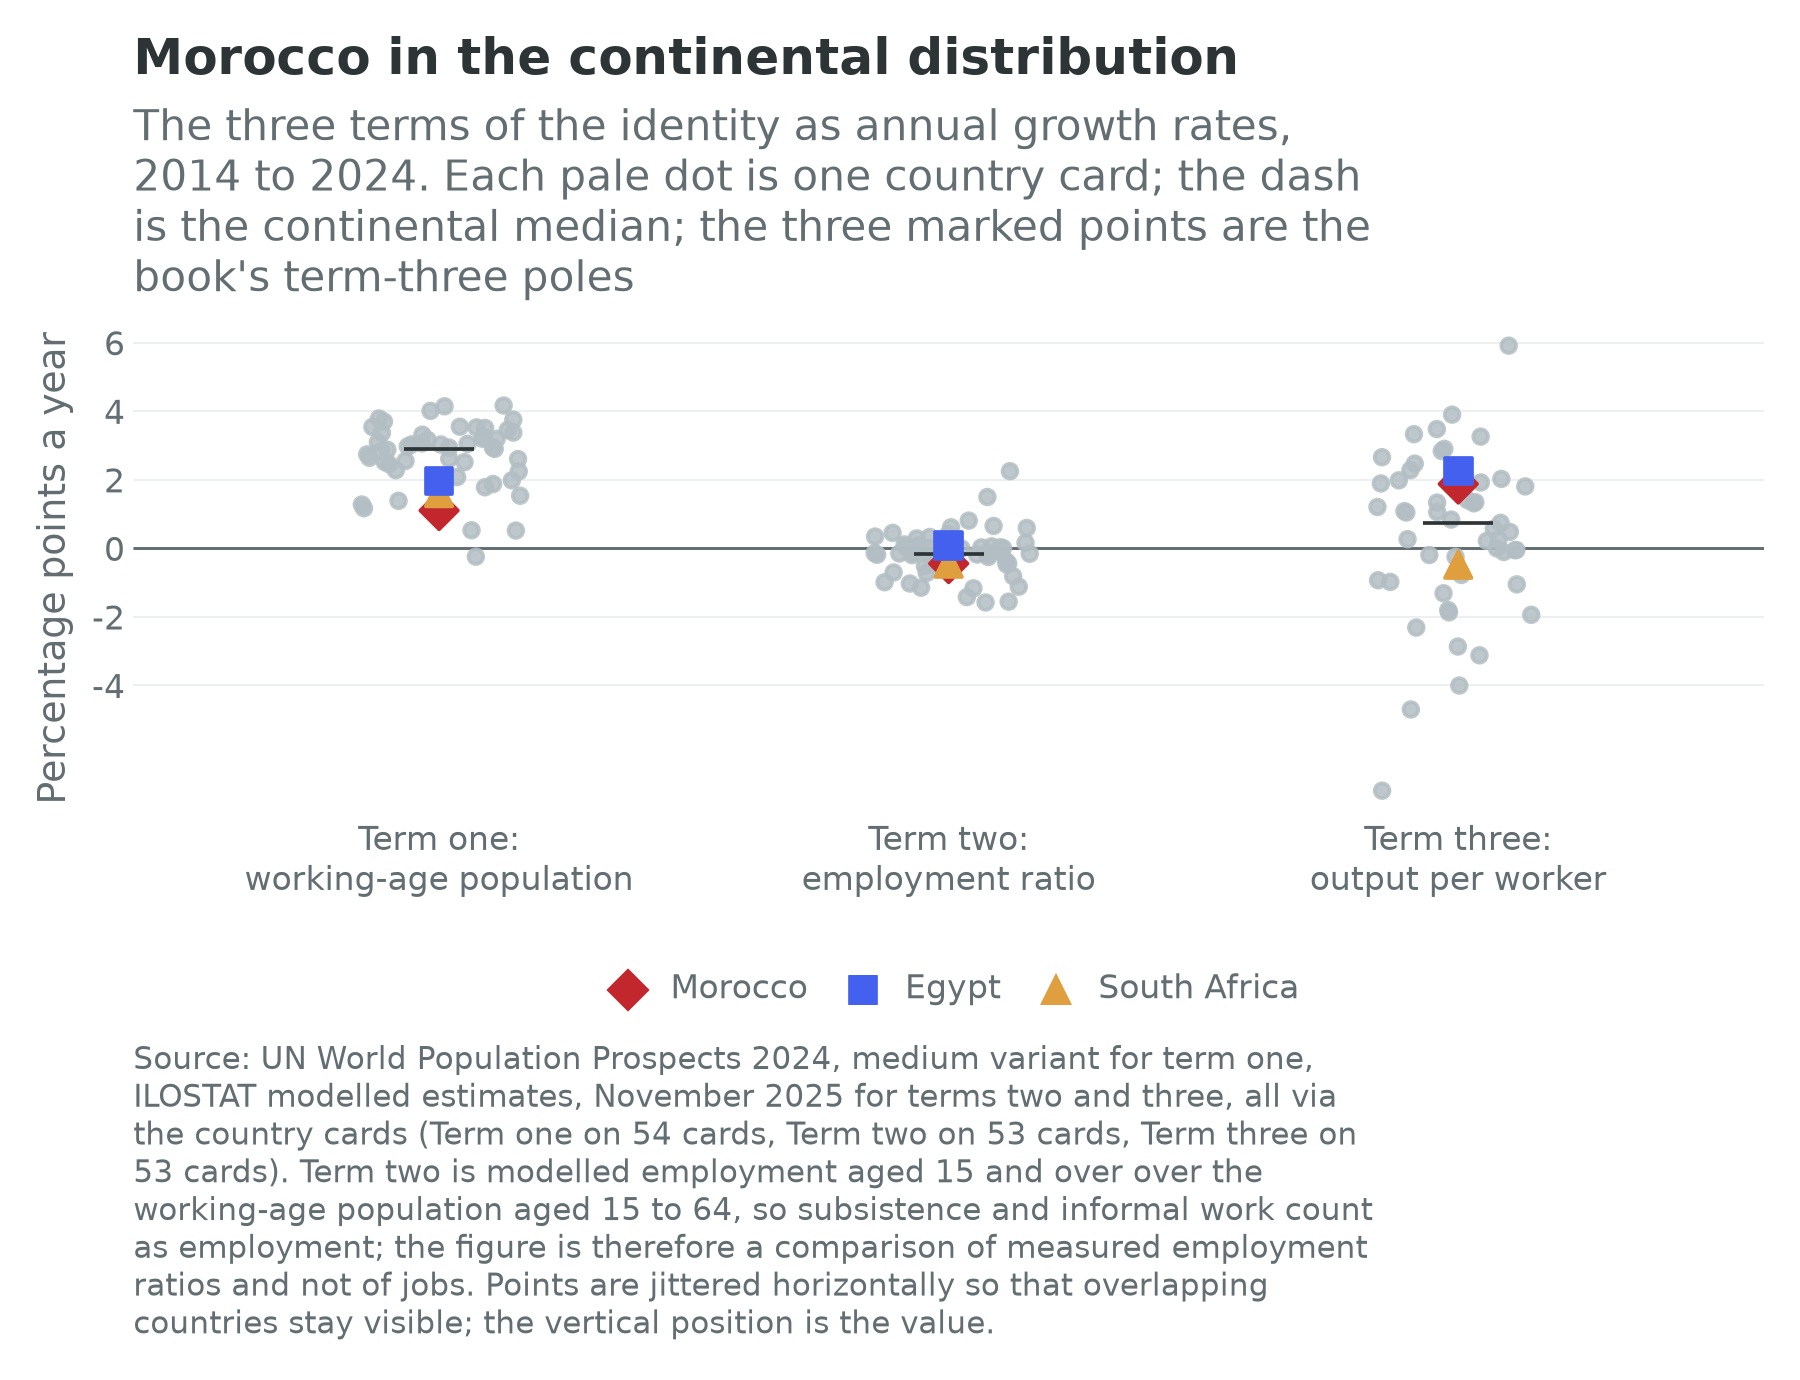
Read the row and the pole announces itself. Term one is nearly absent. Morocco’s working-age population grew at 1.10 percent a year over the decade, against a continental median of 2.89 percent, and only three of the fifty-four cards are slower: Mauritius, Cape Verde and Tunisia. The fertility rate is 2.21 children per woman, the median age is 29.5 years, and the projections run from 38.1 million people today to 43.4 million in 2050 and 37.9 million in 2100, fewer at the end of the century than there are now. Whatever the African demographic century is, Morocco is not in it. The dependency ratio of 51.0 is among the lowest on the continent, which is the good half of the same fact: a country in the middle of its demographic dividend rather than at the start of one.
Term two is negative in a specific way. The employment ratio fell at 0.45 percent a year, below the continental median of minus 0.15 and, to two decimal places, indistinguishable from South Africa’s minus 0.45. Two countries with almost nothing else in common post the same second term, which is a warning about reading it without its overlays. South Africa’s problem is that people who want work cannot find it. Morocco’s is that a large share of its working-age population is not in the measured labour force at all, and almost all of that share is female.
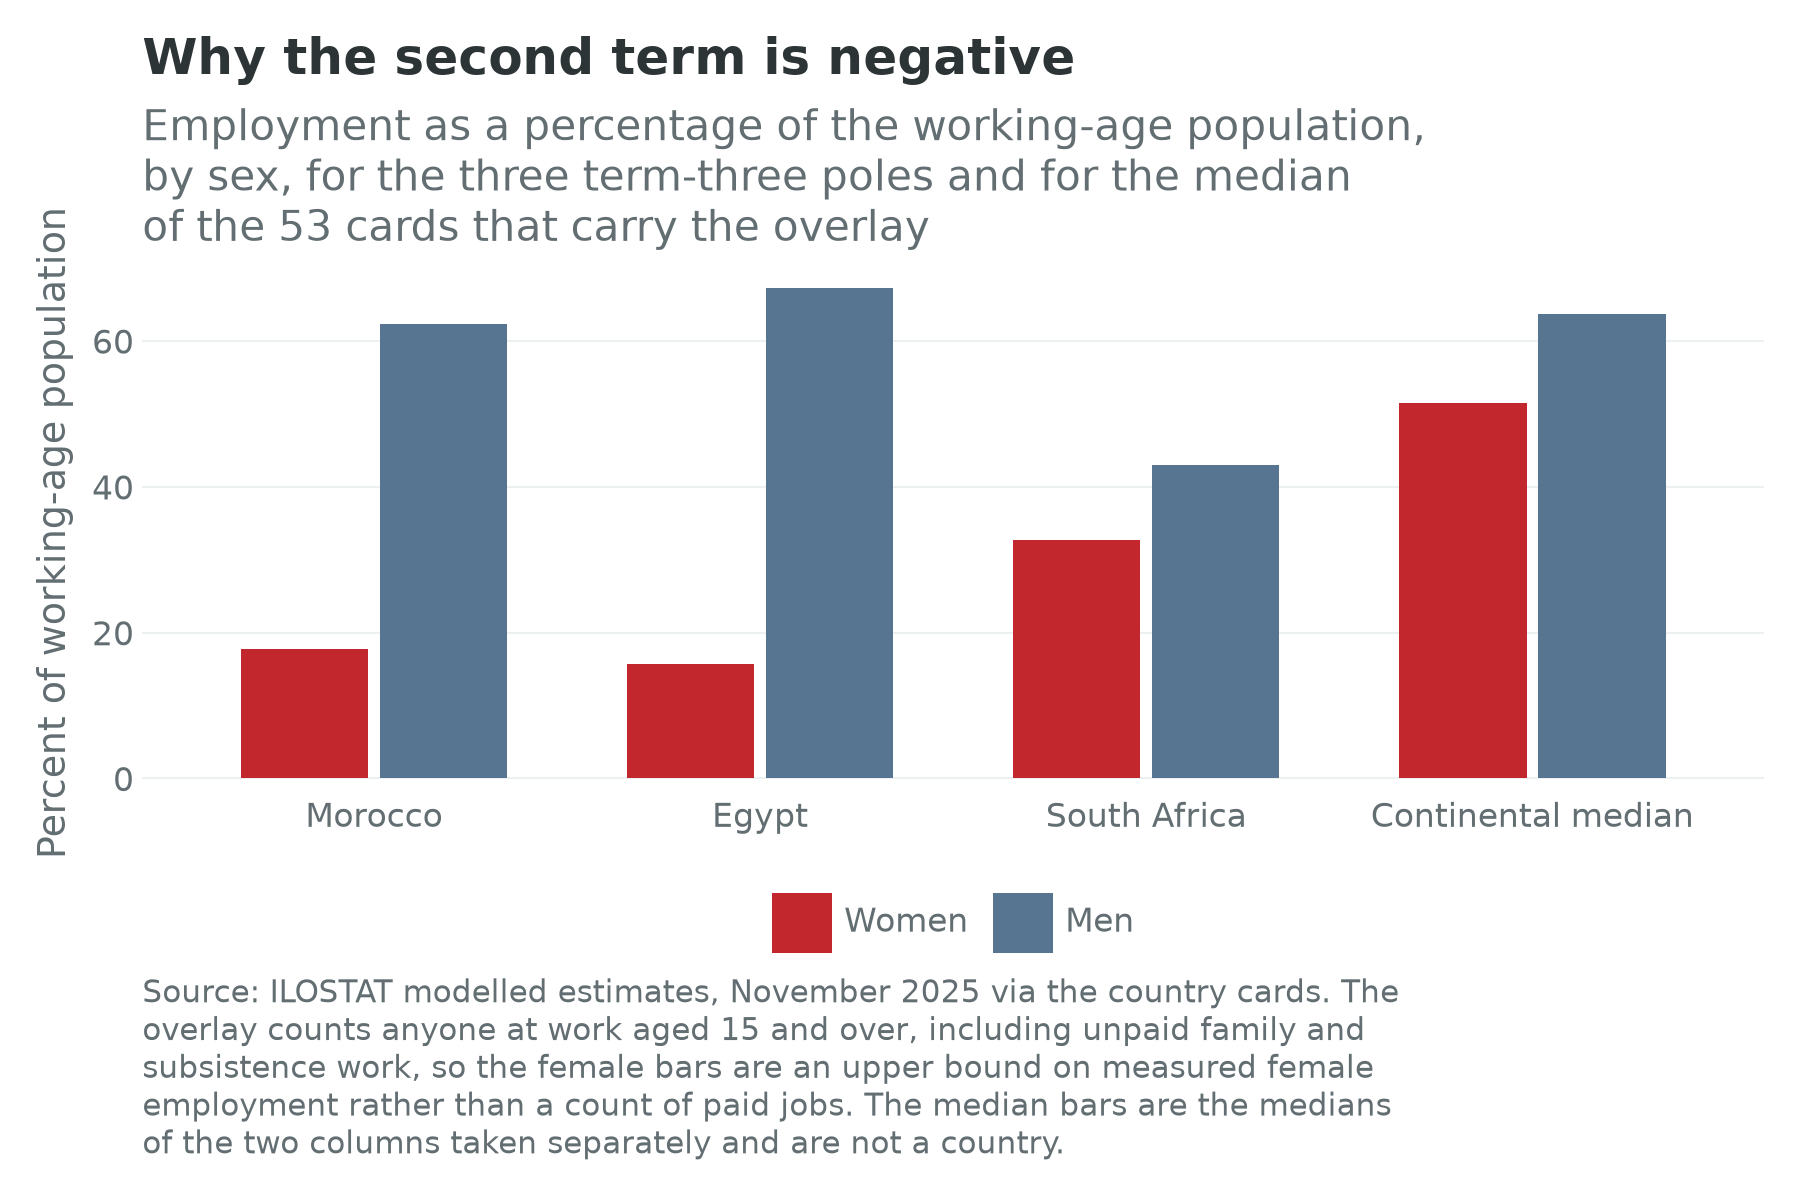
The overlays make the point precisely. Morocco’s male employment ratio is 62.4 percent, essentially the continental median of 63.7; its female ratio is 17.7 percent against a median of 51.5. The gap between the two, 44.7 percentage points, is the fourth widest of the fifty-three cards that carry the overlay, behind Egypt, Algeria and Sudan, and nearly four times the median gap of 11.8 points. The national statistical office’s own figures tell the same story from a different definition: an activity rate of 41.8 percent overall, 66.4 percent for men and 17.5 percent for women, with women 21 percent of the labour force and unemployment at 13.0 percent at the end of 2025 (Haut-Commissariat au Plan, 2026). Whatever else Morocco has built, it has not built a labour market that women enter.
The other overlays are the reason this pole is worth a chapter. Wage employment is 59.6 percent of Moroccan employment against a continental median of 31.0, and non-agricultural employment is 71.7 percent against 59.0. Nearly three in five Moroccans who work do so for a wage; in Chapter 24’s pole that share was in the teens. The pole’s failures are not the failures of a country that has never had a formal sector.
Term three carries the pole. Output per worker grew at 1.88 percent a year, sixteenth of the fifty-three cards and two and a half times the continental median of 0.74. Egypt posts 2.26 percent and South Africa minus 0.48. Egypt’s number is larger, and Chapter 27 argues that a good deal of it is rent rather than transformation; South Africa’s is negative, and Chapter 25 argues that a platform can stop producing productivity. Morocco is the case in which the third term is neither a rent nor a memory.
The within-and-between split, which the transformation database supplies for twenty-one of the fifty-four cards over 2008 to 2018, is the most encouraging number in this chapter. Morocco records within-sector growth of 2.81 percent a year and between-sector growth of 1.13 percent. Both components are positive, which is true of only twelve of the twenty-one countries the database covers, and the sum is the fourth largest, behind Ethiopia, Tanzania and Malawi. Firms got better at what they do and workers moved into higher-productivity activities at the same time, which is the pattern the structural-transformation literature predicts and the African record mostly refuses to show. Egypt’s split, on the same database and window, is 1.20 within and 0.31 between; South Africa’s is 0.39 and minus 0.21. Of the three term-three poles, only one is reallocating labour in the direction the theory wants.
So the identity reads: no demographic tailwind, half the adult population outside the measured labour force, and an economy nevertheless getting better at production faster than almost anywhere else on the continent. Implied growth of 2.53 percent against observed growth of 2.54 says the decomposition holds to a hundredth of a point. The five-year forecast is 4.47 percent a year, exactly the median of the fifty-three cards that carry a forecast, and it would require the second term to stop subtracting.
The platform in two worlds
Chapter 1 set out the assumption underneath the identity and the world in which it fails: one in which the frontier of production is a stock of machines and energy rather than a stock of workers, so that the marginal worker stops being the thing growth is made of. Morocco is the African economy whose strategy already straddles the two.
In the labour-abundant world it is the recipe running to plan: export discipline, a supplier base deepening behind the assemblers, wages rising with productivity, the second term turning as women enter the formal labour force. Sections 5 through 7 describe that machinery.
In the labour-redundant world Morocco holds a different and possibly better hand. Chapter 1 named the assets that hold their value when the frontier stops needing workers: sun, land, ore and the electrons made from them. Morocco has the largest phosphate reserves in the world, one of the best solar and wind resources in the northern hemisphere, an interconnector to the European grid and a green-hydrogen programme designed to sell energy-intensive products rather than energy. That is the compute-inputs branch of Chapter 1’s second case, and the one strategy on the continent that would survive the auto plants being automated to a skeleton crew. It also employs very few people per dollar invested. A country that bets on the second world is betting that the third term can carry an economy without the second, which is the bet whose failure Chapter 25 documents in South Africa.
2. The pole on the balance sheet
The second lens is the balance sheet: what comes in, what goes out, and who ends up owning the assets. Table 28.2 gives the stock side from the cards.
| Country | External debt stock (\(bn) | Multilateral (\)bn) | Official bilateral (\(bn) | Private creditors (\)bn) | of which bonds (\(bn) | Chinese loan commitments, 2000 to 2024 (\)bn) | GDP ($bn) | |||
|---|---|---|---|---|---|---|---|
| Morocco | 68.0 | 21.5 | 7.2 | 17.0 | 13.6 | 1.0 | 182.6 |
| Egypt | 156.0 | 30.8 | 29.6 | 46.6 | 27.3 | 7.7 | 364.6 |
| South Africa | 175.9 | 9.2 | 4.6 | 84.1 | 77.4 | 5.5 | 427.1 |
Sources: World Bank International Debt Statistics (2025 release) for the stock and the creditor lines; the Boston University Chinese Loans to Africa database (2000 to 2024 release) for the commitment column, which is a cumulative flow and not a stock; the IMF World Economic Outlook (April 2026) for output. The creditor columns are publicly guaranteed long-term debt, the bond column sits beside the other private column rather than inside it, and the columns do not add to the stock, which also carries short-term debt, IMF credit and private non-guaranteed borrowing.
Four things stand out.
The first is the shape of the liability. Morocco’s external debt is 68.0 billion dollars against output of 182.6 billion, and the largest single creditor block is multilateral, at 21.5 billion. That is an unusual balance sheet for a middle-income country with capital-market access: South Africa’s external stock is dominated by 77.4 billion of bonds and 84.1 billion of other private credit against 9.2 billion of multilateral lending. Morocco has bonds, 13.6 billion of them, and it does not depend on them. The dirham, whose symbol is DH, is pegged to a currency basket rather than floated, the monetary counterpart of the same conservatism.
The second is the Chinese line, the smallest of any large African economy relative to size, and the debt statistics say so directly. Morocco owes $287 million to creditors in China, against $5.9 billion for Egypt and $3.3 billion for South Africa, and against a Moroccan Paris Club line of $9.0 billion, thirty-one times the Chinese one and the third-largest Paris Club claim on the continent. Tunisia is the same shape on a smaller scale: $31 million owed to China against $3.7 billion to the Club. The loan database’s commitment record agrees, at 1.0 billion dollars to Morocco over twenty-five years and 0.1 billion to Tunisia. Chapter 32 takes up why the two ways of counting differ where they do, and why neither line may be added to the bilateral column. What matters here is the magnitude: this pole was built with European and Gulf capital, multilateral lending and retained corporate earnings, and it is the counter-example to the assumption that African infrastructure implies Chinese finance.
The third is the insurance. Morocco holds a two-year Flexible Credit Line with the International Monetary Fund of about 4.5 billion dollars, approved on 2 April 2025 at 386 percent of quota, a successor to the line first granted in 2023, and it has not drawn on either. It also holds an arrangement under the Resilience and Sustainability Facility, approved in September 2023, whose disbursements had reached about 1.24 billion dollars by 2025 (International Monetary Fund, 2025b). The Flexible Credit Line attaches no conditions because qualification is the condition, and it is available to almost nobody. For a book that spends Chapter 21 on debt distress, the interesting Moroccan fact is a facility that exists to be unused: it backstops the peg, and it is a public certificate of orthodoxy that the pole’s foreign investors read.
The fourth is what the cards do carry and what they still do not. Morocco’s card now has a remittance line at $13.7 billion and a foreign-investment line at $3.3 billion, both for 2025, and an export list led by fertilizers at 14.8 percent and passenger cars at 13.3 percent. The remittance line matters most, because transfers from Moroccans abroad are one of the two largest sources of foreign exchange in the external accounts, and the card and the national accounts agree on it: the Office des Changes puts them at 122.02 billion dirhams, about 13.4 billion dollars, in 2025, up 2.6 percent on the year (Hali, 2026), which is the card’s figure to within the exchange rate used. A diaspora sending home the equivalent of roughly 7 percent of national output every year, through recessions and pandemics alike, is a balance-sheet asset no other pole in Part VI has at this scale.
Who owns what has three columns here. The state owns the phosphate, through the wholly state-controlled group of Section 7. Foreign firms own the assembly plants, and the supplier parks around them are largely European, Japanese and Korean. Moroccan capital owns the banks and much of the retail, construction and food economy, some of it through a royal holding company that Section 4 treats as an instrument of the settlement rather than as an ordinary firm. That is neither the enclave of Chapter 25’s mining sector nor the resource-backed lending of Chapter 30. It is closer to the arrangement that produced the Spanish and Portuguese auto industries: foreign assemblers, domestic banks, and a state that owns the ports and the mineral.
3. The binding constraint
The growth-diagnostics method of Hausmann, Rodrik and Velasco (2005) asks one disciplined question: of all the things wrong with an economy, which one, if fixed, would raise private investment most right now? It proceeds by elimination down a tree, and it forbids the list-of-everything that development strategies usually become. Figure 28.3 draws the tree, and this is the one chapter in Part VI in which the infrastructure branch is eliminated rather than selected.
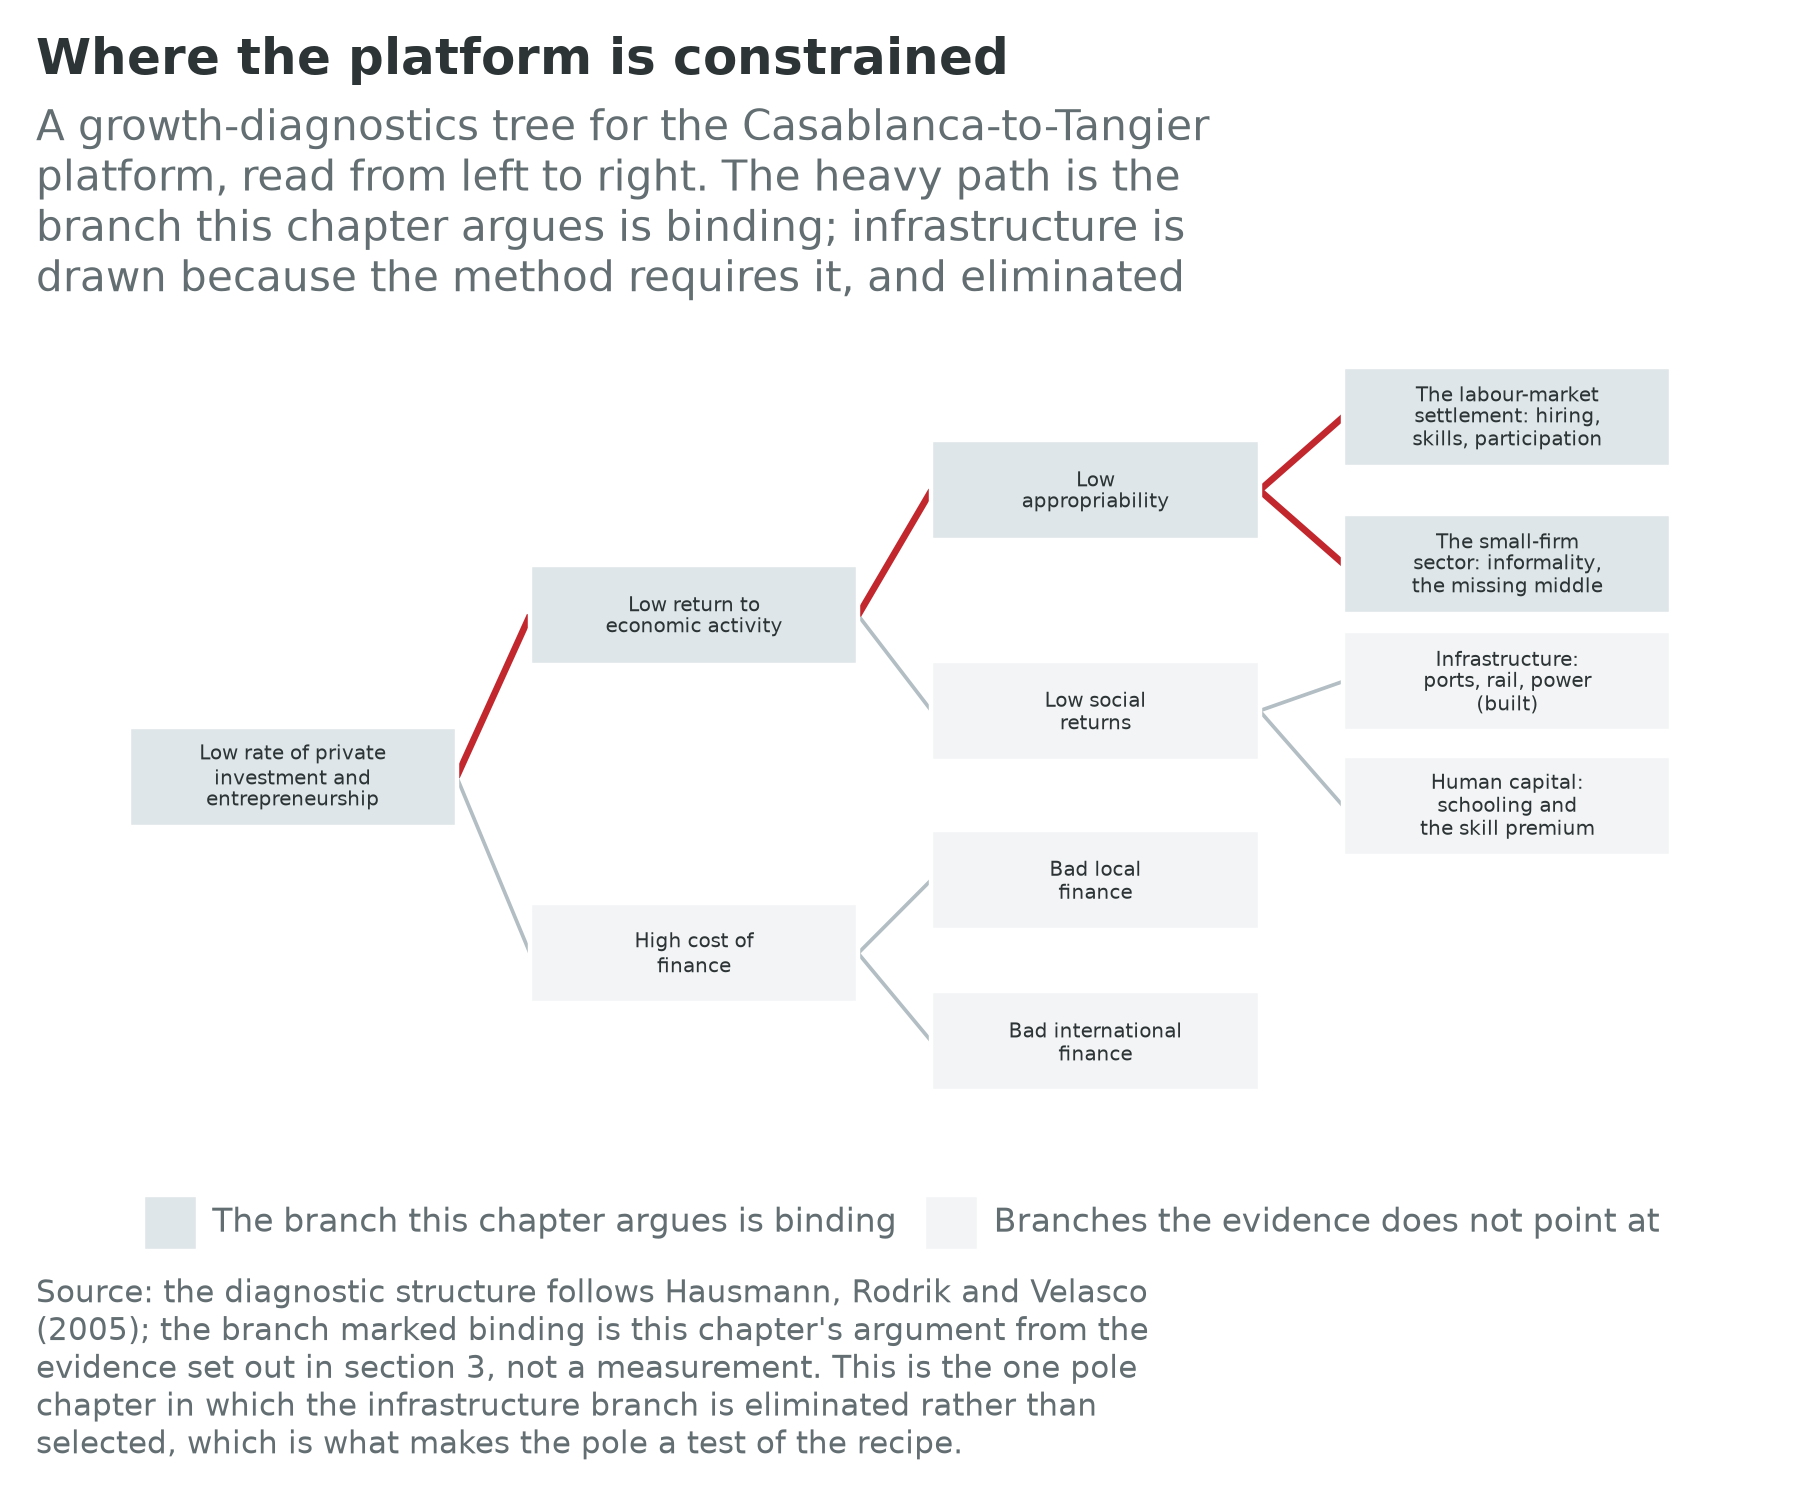
Start with the cost of finance and dispose of it quickly. The banking system is the deepest on the continent after South Africa’s, the sovereign borrows at home in its own currency and abroad at investment-grade-adjacent spreads, the multilateral column of Table 28.2 is available on concessional terms, and the country holds an unused precautionary line from the Fund. Domestic credit reaches small firms badly, and Chapter 16 is unsparing about that everywhere, but an economy whose binding constraint is the price of capital does not have a national investment rate of about 26 percent of GDP (World Bank, 2026e). Money is not what Morocco is short of.
Eliminate infrastructure next, and this is the point of the chapter. Chapter 24’s diagnosis was that firms could not get power or move a container; Chapter 25’s was that a state could not run two technical networks. Neither complaint survives contact with this pole. The port at the top of the country handled 11.1 million containers in 2025 and 161 million tonnes of cargo, first in the Mediterranean and first in Africa on both counts (Tanger Med Port Authority, 2026). Renewables were about 45 percent of installed electricity capacity at the end of 2025, against a target of 52 percent of the electricity mix by 2030 (North Africa Post, 2026a), and the grid is interconnected with Spain. A high-speed line has run since 2018 and a 430-kilometre extension is under construction (TelQuel, 2025). Motorways connect the coastal cities. Whatever is stopping Moroccan firms, it is not the road, the wire or the quay.
Human capital binds later rather than first, on the test Chapter 25 applied. Schooling outcomes are poor for the income level and Chapter 20 takes them seriously. But the diagnostic question is whether returns to skill are being bid up, and in an economy with 13.0 percent unemployment, graduate unemployment above the average, and an activity rate of 41.8 percent, the price signal points the other way (Haut-Commissariat au Plan, 2026). Skills constrain what the platform can become in fifteen years; they do not explain why a firm that wants to hire today does not. Macroeconomic risk is the branch the Fund’s certificate covers: inflation returned to low single digits after the 2022 to 2023 spike, the peg has held and reserves are ample (International Monetary Fund, 2025b).
What is left is the appropriability side of the tree, and the evidence for it is a number that ought to be better known. Morocco invests roughly a quarter of its output every year and grows at about two and a half percent, so each additional unit of output costs an extraordinary quantity of capital. Estimates of the incremental capital-output ratio put it at about 8 in the 2000s and close to 10 in the 2010s against less than 3 in the 1990s, with public investment close to 70 percent of the total against 30 percent private (Policy Center for the New South, 2023). That is the signature of an economy in which capital is abundant and the private return to putting it to work is low. Two mechanisms carry it.
The first is the labour-market settlement in the widest sense: not only the cost of dismissal and the minimum wage, which are real, but the whole set of arrangements that keeps half the adult population out of measured work. A firm choosing between adding a shift and adding a machine faces a labour pool effectively half the size the demographic tables suggest. The participation gap of Section 1 is not a social indicator sitting beside the economics; it is a supply constraint on the pole’s labour market, and at the margin it pushes the capital intensity of new investment up.
The second is the small-firm sector, the mirror image of the auto cluster. Alongside the assemblers and their tier-one suppliers sits an economy of more than two million informal production units, in which the share of employees working without a contract was still 51.2 percent in 2022, down from 67.2 percent in 2000 (OECD, 2024b). Between the two there is very little. This is the missing middle in its clearest African form, and Diao, Ellis, McMillan and Rodrik (2021) describe the same duality in Tanzania and Ethiopia from the other end of the income distribution; Morocco’s version is more striking because the modern half works so well. The country’s own official self-examination, the New Development Model report of 2021, reached a version of the same conclusion: too much of the economy sheltered from competition, too little firm entry, and a bureaucracy whose default is to permit rather than to enable (Commission Spéciale sur le Modèle de Développement, 2021).
The diagnosis has a testable implication, and a diagnosis that cannot be wrong is not worth making. If the constraint is appropriability rather than infrastructure or finance, then the next tranche of megaprojects in Section 6 will raise measured investment without raising the employment ratio, and firm entry and formalization will move only when the rules governing hiring, contracting and competition move. If instead the employment ratio turns after the World Cup build-out and the new ports open, the chapter is wrong and the infrastructure branch was binding after all. Both are observable well before 2035.
4. The political settlement
Chapter 5 sets out the vocabulary. Khan (2010) argues that institutions work only when they fit the underlying distribution of organizational power, so that the same written rule is enforced in one capital and ignored in the next. Pritchett, Sen and Werker (2018) sort economies by whether deals are open or closed to newcomers and ordered or disordered in their enforcement. Dercon (2022) asks whether the elite has bet on growth or on dividing what exists.
Morocco’s settlement has a name in Moroccan usage. The makhzen, literally the storehouse, is the network of the palace, its advisers, the security establishment, the provincial administration and the families whose fortunes are entangled with all three. It is older than the colonial period and it is the actually existing distribution of organizational power that Khan’s framework asks about: governments form, parties alternate, ministers come and go, and the strategic direction of the economy is set elsewhere. In Pritchett, Sen and Werker’s terms this is an ordered and relatively closed deals environment, in which contracts are honoured, rules are predictable, and access to the most valuable of them is not open.
The settlement was tested in 2011 and adapted rather than broke. Protests beginning on 20 February of that year demanded a parliamentary monarchy; the palace responded within months with a constitutional referendum on 1 July that transferred powers to the prime minister and parliament and was approved with more than 98 percent of the vote. The movement dissolved, an Islamist party took office within the new arrangement, and the core of the settlement was unchanged (Freedom House, 2024). Read through Khan (2010) that is a formal rule rewritten to fit an unchanged distribution of power, which is why text and practice have diverged steadily since.
Two instruments of the settlement matter for the economics. The first is the royal holding company, a conglomerate with positions across banking, insurance, mining, retail, food, construction materials and renewable energy, in which the monarch holds the controlling interest. It is not a passive portfolio: it takes the anchor position in exactly the capital-intensive, regulated, long-horizon sectors a state seeking to industrialize needs somebody to enter, and at a cost of capital no other private group can match. Both readings are true at once. It is how a country with a shallow domestic equity market gets large projects financed and executed, and it is a permanent advantage for one owner in the markets where domestic firms would otherwise grow, which is the appropriability problem of Section 3 written as an ownership structure.
The second is the phosphate group. A wholly state-owned company sitting on the largest mineral reserve of its kind in the world is a fiscal asset, a foreign-policy tool and an industrial-policy vehicle at once, and Section 7 shows it acting as all three. It is the closest African analogue to the Korean and Taiwanese state holdings that Studwell (2026) describes, and the comparison is worth pressing: what made those work was discipline by export performance, and this one is disciplined by a commodity market that will not buy overpriced fertiliser out of patriotism.
Apply Dercon’s test and the elite has bet on growth, on a particular reading of what growth requires. Three decades of consistent, expensive, unglamorous investment in ports, roads, rail, power and industrial zones, sustained across governments of several party colours, is not what a settlement that has decided to divide the existing pie does.
The counter-case sits in the composition of the bet, and two events since 2023 have made it visible. On 8 September 2023 an earthquake in the High Atlas killed about 2,960 people and destroyed or damaged some 50,000 homes; the government promised compensation of about $14,000 for a destroyed home and $8,000 for a badly damaged one, and two years later survivors were protesting in front of parliament about the pace of reconstruction (Arab News, 2025). Over the same period the state committed more than 20 billion dirhams, about $5.45 billion, to stadiums for the 2030 World Cup, co-hosted with Spain and Portugal, alongside the airport, rail and hotel programmes that go with it (Arab News, 2025). The two are not a contradiction in accounting terms, since they are financed from different envelopes. They are a statement of what the settlement finds legible. A World Cup is a deadline with a ribbon at the end, and this state is extremely good at deadlines with ribbons. Reforming the rules under which a small firm hires its fifth employee has no ribbon, and Section 3 argues that this is the reform the identity is waiting for.
5. Geography and infrastructure
The pole is an axis, and geography wrote it. Casablanca is the commercial capital and the largest city; Rabat, 90 kilometres up the coast, is the political one; Kenitra sits between Rabat and the north; Tangier is at the Strait. The Atlas mountains run behind them, the phosphate basins lie inland to the south and east, and the Sahara begins beyond that. Everything the platform does happens on the coastal strip or is shipped through it.
Tanger Med. The port complex east of Tangier is the pole’s single most important asset. Its four container terminals handled 11,106,164 twenty-foot equivalent units in 2025, 8.4 percent more than in 2024, and 161 million tonnes of cargo, 13.3 percent more, placing it first among Mediterranean and African ports; 1,319 vessels over 290 metres called during the year (Tanger Med Port Authority, 2026). Three features matter for the argument. It is a transshipment hub, so a large share of those containers never enters Morocco, which is a real business and not an industrial one. It has an industrial platform attached, with free zones holding the auto plants and their suppliers, so the other share is Moroccan value added leaving for Europe. And it is fourteen kilometres from the European Union, so a truck loaded at a Tangier plant reaches a Spanish motorway in a morning and a German assembly line inside two days. Proximity is the endowment here in the way oil is the endowment in Chapter 12.
The rail spine. Al Boraq, the high-speed line from Tangier to Kenitra opened in 2018, is the only line of its kind on the continent and cut the Tangier to Casablanca journey to about two hours ten minutes. The extension under construction runs 430 kilometres from Kenitra through Rabat and Casablanca to Marrakech, at a budgeted 53 billion dirhams before rolling stock, inside a rail programme of about 96 billion dirhams, designed for 350 kilometres an hour, due for completion in November 2029 and promising a Tangier to Marrakech journey of two hours and 40 minutes (TelQuel, 2025). The programme is explicitly tied to the 2030 tournament, which is the honest way to describe how a great deal of Moroccan infrastructure gets its deadline.
Two more ports. Nador West Med, on the Mediterranean 200 kilometres east of Tangier, is due to enter service in the second half of 2026, representing 51 billion dirhams of public and private investment, opening with 800 hectares of industrial zone and planned to expand to 5,000, and carrying the country’s first liquefied natural gas terminal (Eljechtimi, 2025; Kasraoui, 2026). It is a hedge against congestion at Tanger Med and an attempt to industrialize the poorest part of the northern coast; it is also the second very large port investment in a country whose first one still has spare ambition, and the demand risk sits with the state. The third is 1,500 kilometres to the south, at Dakhla on the Atlantic coast of Western Sahara, whose status is disputed and which the book’s maps hatch: about $1 billion, a depth of 23 metres, targeted at 2028, and intended to serve heavy industry and process raw materials from the Sahel (Eljechtimi, 2025). A deep-water Atlantic port at that latitude would shorten the sea route from the western Sahel to the Americas and northern Europe considerably, which is why the project is discussed in Bamako and Nouakchott as well as in Rabat.
Power and water. Renewables were about 45 percent of installed capacity at the end of 2025 against a 52 percent target for 2030 (North Africa Post, 2026a), and the Noor complex at Ouarzazate, four plants totalling about 582 MW of concentrated solar and photovoltaic capacity, is the flagship (Jaouhari, 2017). In March 2025 the government approved six green-hydrogen projects from five investor groups, worth about $32.8 billion in announced investment (Hydrogen Insight, 2025), under a framework allocating up to 1 million hectares with an initial 300,000 hectares on offer (TelQuel, 2024). Treat the dollar figure as an announcement rather than an outturn. The strategic logic is Chapter 14’s: an electron is expensive to move and a tonne of green ammonia is not, so a country with sun, wind and a phosphate industry that needs ammonia has a reason to make the molecule at home. Water is the constraint on all of it, and Section 9 takes that up.
6. Megaprojects and cities
A caution before the numbers, as in every pole chapter. The Moroccan card carries an agglomeration population for Casablanca, 5.2 million against 6.2 million in 2050, though none for Tangier, which is not the country’s largest; it also carries an urban share of 63.1 percent, on the kingdom’s own definition of a town rather than on the agglomeration rule, which is a national figure and says nothing about where inside the country the towns are. The national census of 2024 gives regional figures: 7.689 million people in the Casablanca-Settat region and 4.030 million in Tanger-Tétouan-Al Hoceima, on a legal population of 36,828,330 at 1 September 2024 (Haut-Commissariat au Plan, 2025). Those are administrative regions rather than built-up areas, and the chapter does not convert them into city populations.
The Tangier industrial complex. The largest thing being built in this pole is not a building but a cluster. Around the port sit free zones holding vehicle assembly, wiring harness production, seats, interiors, stampings and electronics. One assembler’s Moroccan plants produced 394,000 vehicles in 2025, roughly 82 percent of them exported, and it reports local sourcing of about 65 percent excluding mechanical components (Faouzi, 2026); the other announced about €1.2 billion of additional investment at its Kenitra plant to take capacity there to about 535,000 vehicles, adding small electric vehicles and hybrid engines (Stellantis, 2026). The supplier base counts more than 250 firms employing some 220,000 people (Hespress, 2023). Automotive products are the country’s largest export category; exports ran at 112.2 billion dirhams over the first nine months of 2025, 2.7 percent below the same period of 2024 (Moho Amer, 2025b), before rising 19.1 percent year on year in January 2026 (Bouithy, 2026).
That paragraph is the recipe of Chapter 9 in physical form, and it deserves the discipline this book applies to every industrial policy. Support is conditional on production for export, which is the active ingredient Studwell (2026) identifies. The local-content figure is a policy target as well as a measurement, and value added by an assembler is not the same as value added by a country. The customer is a single continent, and one whose own auto industry is being restructured around electrification. The cluster is a genuine achievement and a concentrated bet.
Mohammed VI Tangier Tech. The industrial city planned east of Tangier, launched with Chinese investors and repeatedly relaunched, is the pole’s clearest case of a megaproject moving more slowly than its announcements. What has been built is infrastructure and serviced land rather than the industrial city of the renderings.
Casablanca and the tournament. The financial district at Casa-Anfa is a deliberate attempt to build a regional financial centre on the site of the old airport, with a special tax and regulatory status for firms basing their African operations in Morocco. It is the continent’s highest-ranked financial centre, 56th in the world in the most recent index, ahead of Mauritius at 58th and Johannesburg at 80th (Z/Yen, 2026), and what makes it more than a tax wrapper is the bank in Section 7 and the insurance and asset-management firms around it. North of the city sits the largest of the 2030 stadiums, part of more than 20 billion dirhams of stadium construction with airport, rail and hotel programmes around it (Arab News, 2025). Chapter 18 carries the tourism argument. The pole-level point is Section 4’s: this state converts a deadline into delivery with unusual reliability, and the question is whether the same machinery can be pointed at problems without a fixture list.
Housing. Underneath it is the housing deficit, which here takes the form of substandard and unauthorized housing in the coastal cities rather than the peri-urban informality of Chapter 24’s pole. Chapter 22 carries the land and tenure argument; the connection is that a platform whose plants sit outside Tangier and Kenitra needs workers who can afford to live within reach of them.
7. Firm profiles
OCP Group (Khouribga, Jorf Lasfar and Safi)
The state-owned phosphate group is the most consequential firm in this pole and one of the most consequential in Africa. Morocco holds about 50 billion tonnes of phosphate rock reserves, roughly two thirds of the world total, and the group mines them and converts them into phosphoric acid and finished fertiliser at two enormous coastal complexes (United States Geological Survey, 2025). Revenue was 114 billion dirhams in 2025, up 17 percent on the year; fertiliser capacity is being raised from 15 million to 20 million tonnes a year by 2027; the group raised $1.75 billion in an international bond in April 2025 to fund the programme (OCP Group, 2026).
Three things make it worth a profile rather than a mention.
The first is the fertiliser bet on the rest of Africa. African soils are among the world’s most nutrient-depleted and African application rates among the lowest, which Chapter 11 treats as one of the binding constraints on yields. The group’s response has been to build blending plants and soil-mapping capacity on the continent and to sell formulations matched to local soils rather than a standard product; its African market share has gone from negligible to a reported 54 percent (African Business, 2026c). Read one way, this is the largest private contribution any African firm makes to another African sector’s productivity. Read another, it is a state-owned monopolist using a mineral rent to build a continental market position, with the pricing power that implies. What separates them is what happens to African farmgate fertiliser prices in the decade the new capacity arrives.
The second is the energy and water programme, where the phosphate business meets Chapter 1’s second world. Ammonia is made from hydrogen, hydrogen is currently made from gas, and a fertiliser producer making its own green ammonia converts an import bill into a domestic energy business. The group states that it has met its full water requirement from desalination and reuse since 2025 and intends to generate all its electricity from about 5 gigawatts of its own clean capacity by 2027, with carbon neutrality targeted for 2040 (OCP Group, 2026). Whether or not those dates hold, the direction is strategic: a heavy industry turning itself into an energy-intensive exporter sited where the energy is cheapest.
The third is employment, and the lesson is Chapter 24’s refinery again. A group of this size employs on the order of twenty thousand people directly, in a country with a labour force of 11.6 million (Haut-Commissariat au Plan, 2026). It is a magnificent term-three asset and not an answer to term two. One geographic note for completeness: the Boucraâ basin lies in Western Sahara, and the resulting legal and commercial disputes over export contracts are something readers following the sector should know about.
Attijariwafa Bank (Casablanca)
The largest Moroccan bank is the pole’s demonstration that a middle-income African economy can export financial services to poorer neighbours rather than importing them from Paris. The group operates in 27 countries through majority-owned subsidiaries, including fourteen in Africa outside Morocco, serves more than 12 million customers through more than 7,200 branches, and employs over 21,000 people (Attijariwafa Bank, 2025). In 2025 net banking income rose 5.6 percent to 34.9 billion dirhams and consolidated net income 14.4 percent to 12.4 billion dirhams, with net income group share up 16.2 percent to 10.6 billion dirhams (Attijariwafa Bank, 2026).
The bank matters for three reasons. It is what makes the Casablanca financial centre more than a regulatory offer: a bank with real West and Central African books gives the district something to clear. It is a Moroccan-owned claim on other African economies’ growth, the balance-sheet lens of Chapter 21 pointed in the unusual direction, since most African cross-border ownership runs the other way. And its expansion followed the phosphate group and the construction firms into francophone West Africa, which is how commercial diplomacy works when it works: the state opens the door, the firms walk through it, and the bank finances both.
Why the auto cluster is the recipe’s second African test
Chapter 25 called the South African automotive programme the clearest African test of the East Asian recipe because it is old enough, large enough and measured enough to argue about with numbers. Morocco is the second test, and the pair is more useful than either alone. South Africa’s programme supports assemblers in a country with a large domestic market, a deep supplier base of long standing, and a labour settlement that makes hiring expensive. Morocco’s supports assemblers in a country with a small domestic market, a supplier base built from nothing in twenty years, wages a fraction of the European level, and a port fourteen kilometres from the customer. Both are disciplined by exports. Both have raised output per worker. Neither has moved its employment ratio much. If the recipe’s promise is that export manufacturing converts a labour surplus into wage employment at scale, the two clearest African cases have delivered the third term and not the second, and Chapter 15 has to explain why.
8. What the experiments say
Three Moroccan experiments, and a pattern
Morocco is one of the most heavily randomized economies in Africa, which is a happy accident of a research programme that ran there in the 2000s and 2010s. Three findings speak to the diagnosis in Section 3.
Credit was not the constraint on the small-firm sector. Crépon, Devoto, Duflo and Parienté (2015) evaluated the introduction of microcredit into rural areas where no formal lender operated. Take-up was 13 percent of households in treated villages. Among households more likely to borrow, investment in self-employment assets rose and profits rose, but hours of casual wage labour fell by enough to offset them, and there was no measurable gain in income or consumption overall. Credit reallocated household effort rather than raising household income. For a chapter that eliminated the finance branch of the diagnostic tree, this is the microeconomic version of the same finding: putting money into the small-firm sector did not make the small-firm sector more productive.
Infrastructure that works can still fail to do what it was justified by. Devoto, Duflo, Dupas, Parienté and Pons (2012) offered randomly selected homeowners in Tangier a simplified, interest-free credit arrangement to buy a household connection to the municipal water network. Take-up was 69 percent and water consumption rose substantially, with no improvement in water quality or in waterborne illness, because the public taps these households had been using were already safe. What did improve, durably, was well-being: less time hauling water, fewer disputes inside and between households. The connection was plainly a good idea; the lesson is that an investment justified by a health mechanism delivered through a time mechanism instead, and that a country building as much infrastructure as this one should be careful about which mechanism it thinks it is buying.
The cheapest way to change behaviour was not to condition on it. Benhassine, Devoto, Duflo, Dupas and Pouliquen (2015) evaluated Tayssir, the government’s cash-transfer programme for education, in poor rural communities. A small transfer to fathers, not conditional on attendance but explicitly labelled as support for schooling, produced large gains in school participation. Adding conditionality and shifting the transfer to mothers made almost no difference. The pathway ran through parents’ beliefs about whether education was worth the investment.
Put the three together and a pattern appears that fits Section 3 rather than contradicting it. What moved outcomes in Morocco was information, framing, and reducing the friction of a transaction. What did not move outcomes was supplying capital to firms whose problem was not capital. The pole’s constraint is not that Moroccans lack money or pipes. It is the set of rules and expectations that determines who starts a firm, who takes a job, and who is expected to stay at home.
9. Climate exposure
The pole’s climate exposure is water, and it binds now rather than in a scenario.
Morocco went through seven consecutive drought years to 2025, the longest such run in its modern record. National rainfall in 2024 was 24.8 percent below normal, the sixth drought year in a row (Jazouli, 2025); national dam filling stood at about 31.5 percent in mid-December 2025 (North Africa Post, 2025). An unusually wet winter then transformed the position: by mid-February 2026 dams were about 70 percent full, holding roughly 11.8 billion cubic metres, against 27.6 percent and 4.6 billion a year earlier (Senoussi, 2026). Both numbers should be held at once. The recovery is real and it is one wet winter inside a long drying trend, and a country whose agriculture still employs a large minority of its workers cannot plan on winters.
Drought reaches the identity directly: rain-fed cereal yields swing by multiples between good and bad years, agricultural output swings with them, and the aggregate growth rate follows. That is why Moroccan headline growth is noisier than Moroccan industrial performance, and why the observed-growth column of Table 28.1 should be read as a decade average rather than as a trend anybody experienced.
The policy response is the most aggressive desalination programme in Africa. The country runs seventeen desalination plants producing about 350 million cubic metres a year, with four more under construction and eleven planned, and the flagship at Casablanca is designed for about 300 million cubic metres a year on its own (North Africa Post, 2026b). The phosphate group has already moved its own water demand to desalination and reuse (OCP Group, 2026). This is climate adaptation as industrial policy: a country deciding to buy its water with electricity, having first arranged to make the electricity from sun and wind.
Two cautions belong beside it. Desalinated water is expensive water, and agriculture, which uses the overwhelming majority of Moroccan water, cannot pay industrial prices without a subsidy that has to come from somewhere. And substituting capital and energy for a missing natural input raises the capital intensity of the economy again, which is the Section 3 problem arriving from a new direction. Chapter 34 carries the climate-finance argument; the point here is that Moroccan water policy is an industrial policy and should be argued about as one.
10. Data quality
Data quality in this book is a layer rather than a caveat, so it gets its own section.
| Country | Last census | Last GDP rebasing | Last labour-force survey | Statistical performance score | IMF dissemination standard | Confidence flag |
|---|---|---|---|---|---|---|
| Morocco | 2024 | none recorded | 2024 | 73.1 | SDDS | high |
| Egypt | 2017 | none recorded | 2023 | 78.1 | SDDS | high |
| South Africa | 2022 | 2021 | 2025 | 81.3 | SDDS | high |
Sources: national statistical offices for census, rebasing and survey years; World Bank Statistical Performance Indicators for the score; the IMF’s dissemination standards database for the standard; the confidence flag is this book’s own rule, described on the About the data page.
Morocco’s statistical system is one of the best on the continent, and the card says so from four directions. It is one of only eight cards carrying a census in 2024, one of eighteen with a labour-force survey no older than 2024, one of eight subscribing to the IMF’s stricter dissemination standard, and one of eleven carrying a high confidence flag. Its statistical performance score of 73.1 is eighth of the fifty-three scored. The planning commission runs a continuous labour-force survey with quarterly publication, which is what makes the participation and unemployment series here usable at all.
Two qualifications belong on the page. The first is the gap between the census and the projections. The census counted a legal population of 36,828,330 at 1 September 2024, growing at an average 0.85 percent a year over the intercensal decade (Haut-Commissariat au Plan, 2025). The card’s population, from the UN’s projections, is 38.1 million. The difference of about 1.25 million people, a little over 3 percent, is not an error by either party: the two count different things on different dates, and the international series will incorporate the census at its next revision. Even the continent’s best-measured populations carry a margin of that order, and every per-head figure here inherits it.
The second is the rebasing. The card records no GDP rebase year, and the absence is a gap in the book’s own table rather than a claim that the national accounts have never been rebased: the statistical office moved the base year from 2007 to 2014, and the publication year for that change has not been sourced. An output-per-worker series computed across a decade containing a base change carries whatever discontinuity the change introduced, and Chapter 1’s warning about Nigeria applies here in a much milder form.
What the numbers can bear, then: Morocco’s identity decomposition is as solid as any in the book, resting on a current census, a current labour-force survey and a national accounts system with a high dissemination standard. The within-and-between split is good for the decade to 2018 and describes the period before the drought and the recent investment wave. What they cannot bear is a metropolitan population for Casablanca or Tangier, a reading of informality from the card, which carries no informal-employment share, or a youth-inactivity comparison, which the card also lacks.
11. Data sources
- UN World Population Prospects 2024, medium variant: every population figure here, national rather than metropolitan, and the working-age series behind term one. Ages 15 to 64 throughout.
- ILOSTAT modelled estimates, November 2025: terms two and three and the wage-employment, non-agricultural and employment-by-sex overlays. Modelled rather than surveyed, which is why Section 10 lists the survey years beside them.
- Groningen Growth and Development Centre, Economic Transformation Database: the within-and-between split of term three, over 2008 to 2018, for the twenty-one cards it covers.
- IMF World Economic Outlook, April 2026: output levels, output per head, observed growth and the five-year forecast.
- World Bank International Debt Statistics, 2025 release: the external debt stock and its creditor composition, in which bilateral lending is not split by creditor country.
- Boston University Global Development Policy Center, Chinese Loans to Africa database, 2000 to 2024 release: the Chinese column, a cumulative flow of commitments rather than a stock.
- World Bank Statistical Performance Indicators, the IMF dissemination standards database and the Haut-Commissariat au Plan: the data-quality table, the 2024 census and the quarterly labour-force series.
- IMF country reports and press releases on Morocco: the Flexible Credit Line, the Resilience and Sustainability arrangement and the macroeconomic narrative in Sections 2 and 3.
- Tanger Med Port Authority, Agence Nationale des Ports and ONCF: port throughput, the two new deep-water ports and the high-speed rail programme.
- Office des Changes: automotive export values and diaspora transfers.
- Company reports: OCP Group and Attijariwafa Bank; Renault Group, Stellantis and AMICA for the automotive cluster.
- Ministère de l’Équipement et de l’Eau and Ministère de la Transition Énergétique: dam levels, the desalination programme, renewable capacity and the green-hydrogen framework.
- The New Regional Economics, chapter 14 (Wilse-Samson, 2026): the regional-hegemon framing and the vehicle-production series this chapter cites rather than repeats.
12. Exercises
Discussion questions
Morocco and South Africa post employment-ratio growth of minus 0.45 and minus 0.45 percent a year, and the two numbers mean almost opposite things. Using the overlays rather than an appeal to history, set out what a policymaker in each capital would have to do to turn the term positive, and say which of the two problems you would rather have. Then say what that preference reveals about how you weigh a measurement problem against a demand problem.
This chapter eliminates the infrastructure branch of the diagnostic tree that Chapters 24 and 25 both select, and lands on appropriability instead. Construct the strongest case against that reading. What would have to be true for infrastructure to bind in a country with the Mediterranean’s largest port, and what observation before 2035 would settle it?
Morocco’s within-sector and between-sector productivity components are both positive, which is true of twelve of the twenty-one countries the transformation database covers, and its employment ratio has nonetheless fallen for a decade. Dercon’s test asks whether the elite has bet on growth. Apply it to a settlement that has clearly bet on the third term and arguably not on the second, and say whether a bet on productivity without employment should count as a growth bargain at all.
Try it
Open the three term-three poles side by side: Morocco, Egypt and South Africa, in that order. Read down the identity block first, where the three columns share one scale, then down the overlays, and last down the data-quality block. Write one paragraph on a single question: the three cards agree that these are productivity economies rather than demographic ones, and they disagree about almost everything else. Which of the three would you expect to have the highest output per worker in 2050, and which piece of evidence on the cards, rather than in this book’s prose, is doing the most work in your answer? Then turn the confidence toggle on and note that, unusually, nothing changes: all three carry a high flag, which is itself a finding about which African economies get written about.
Data exercise
Download all fifty-four cards from the country cards page on this site, as cards.csv or cards.json, and build a table with these fields: identity.working_age_pop_growth, identity.employment_to_wa_growth, identity.output_per_worker_growth, identity.gdp_growth_observed, overlays.employment_female, overlays.employment_male, overlays.output_per_worker_within, overlays.output_per_worker_between and data_quality.confidence_flag. Then do four things. First, reproduce the Morocco row of Table 28.1 and confirm that the three terms sum to within a hundredth of observed growth. Second, compute the male-minus-female employment gap for every card that carries both, rank them, and confirm the claim in Section 1 that Morocco is fourth; then compute the correlation between that gap and the second term, and say in two sentences whether the cross-section supports this chapter’s mechanism or merely fails to contradict it. Third, restrict to the twenty-one cards carrying the within-and-between split, count how many have both components positive, and rank them by the sum; say what the countries at the top have in common and whether Morocco belongs with them. Fourth, take the ten cards with the highest output-per-worker growth and the ten with the highest employment-ratio growth, and report the size of the overlap. Treat nulls as missing, never as zeros.