12. Oil and Gas
Of the fourteen African countries that live from oil and gas, eight recorded falling output per worker over the decade to 2024, and the four worst productivity records on the continent all belong to hydrocarbon exporters: Equatorial Guinea at minus 7.07 percent a year, South Sudan at minus 4.70, the Republic of the Congo at minus 4.00 and Angola at minus 3.12. Those fourteen countries hold 38.1 percent of Africa’s people and produce 44.3 percent of its output. This is the largest sector in the book, measured in dollars, and the one whose dollars have done the least for the people who live above them.
Learning Objectives
After reading this chapter, you should be able to:
- Locate African oil and gas in the identity, and explain why a sector this large moves employment so little and moves measured productivity mostly with the price.
- Describe how a barrel is actually sold: licensing rounds, production-sharing contracts, liftings, the traders, and the fiscal take.
- Distinguish a rent problem from a productivity problem, and say which one a refinery solves and which one it does not.
- Explain what resource-backed borrowing, oil prepayments and fuel subsidies each do to a sovereign balance sheet when the price turns.
- Set out what the sector becomes under each of the book’s two worlds, and state the case and the counter-case on gas as a bridge fuel.
Prior work: the reason gas flares corrupt satellite measures of economic activity, and the flare-masking that has to be done before nightlights can be used on this continent, is worked through in the companion volume, The New Regional Economics, chapter 13 (Wilse-Samson, 2026). This chapter cites that material rather than repeating it.
1. Overview
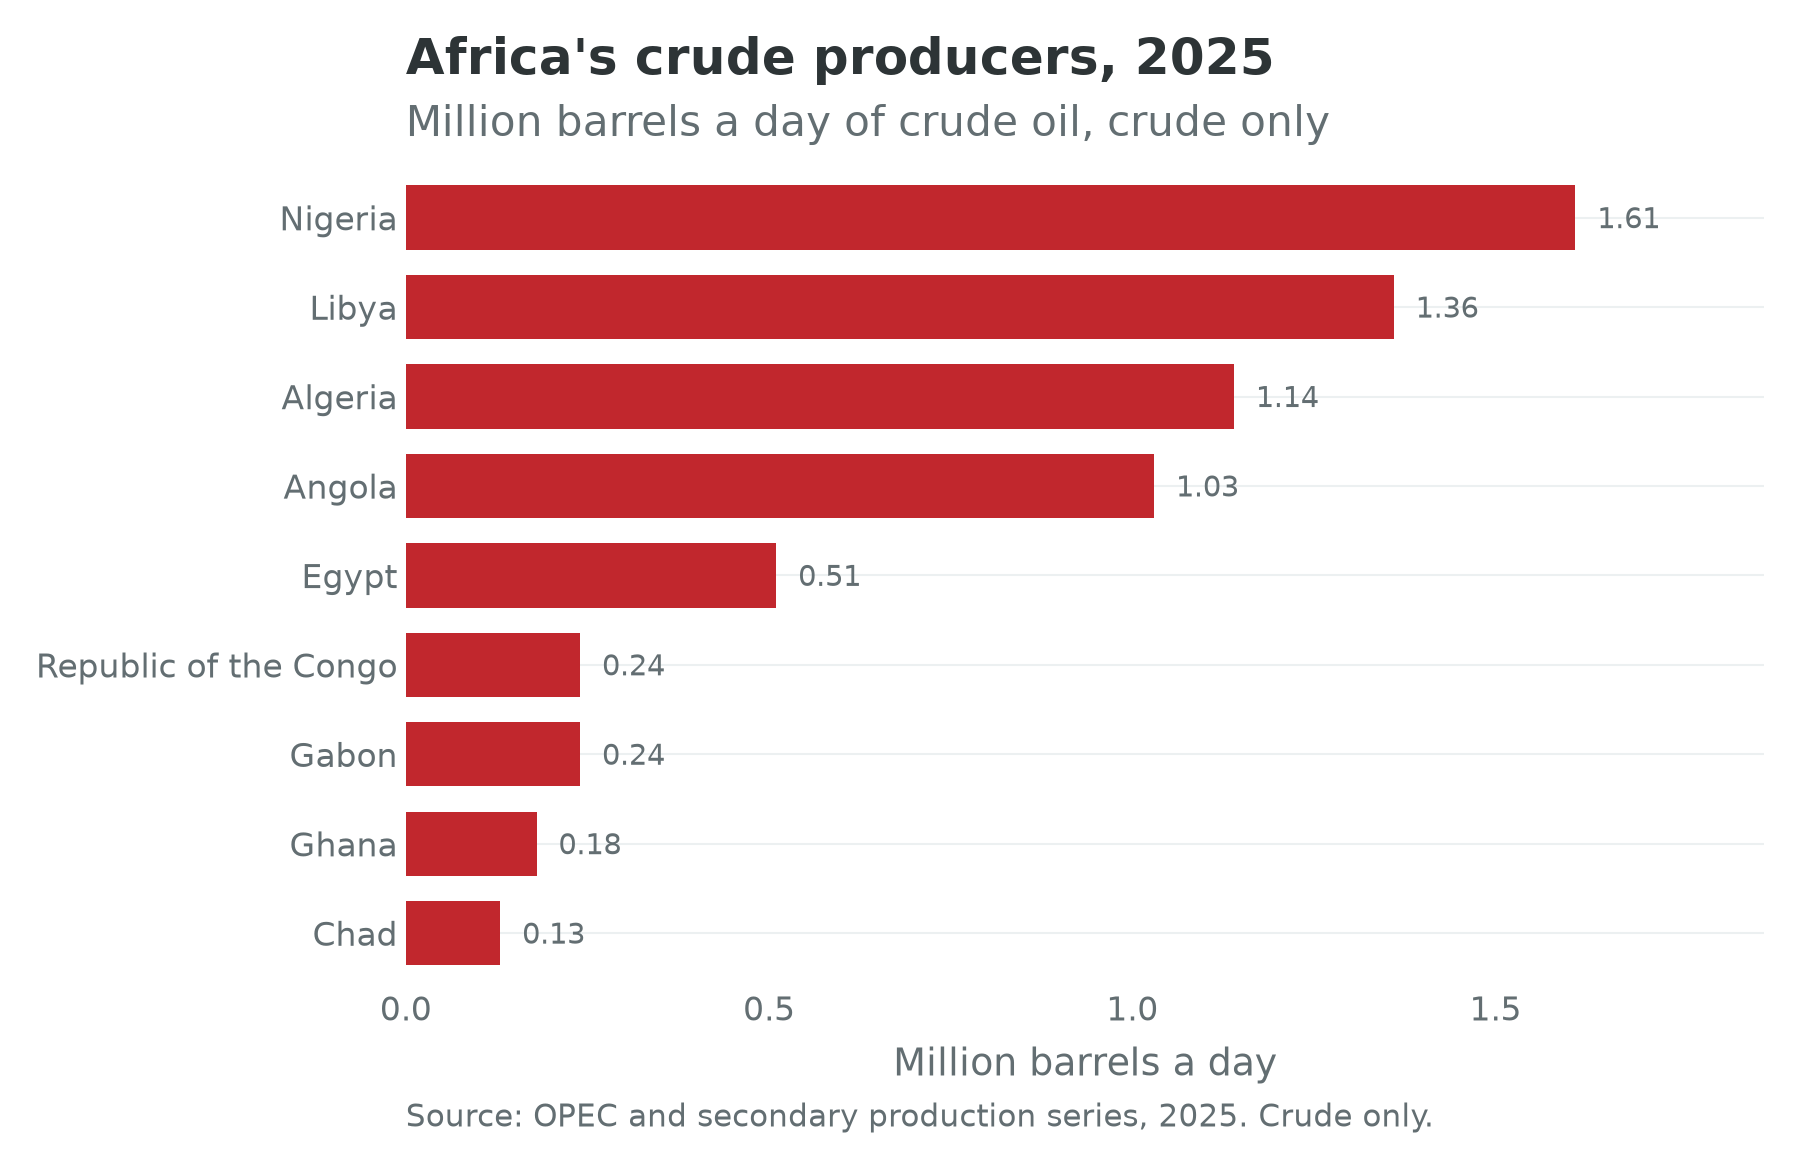
Oil and gas is the sector that proves the identity is about workers rather than dollars. It is among the largest contributors to African export earnings and among the smallest to African employment, and those are the same fact: the technology is capital-intensive and the money arrives as rent on a licence rather than as wages. Africa produced about 7.5 percent of the world’s oil in 2024, on the Energy Institute’s total-liquids measure (Perrin, 2025). Nine countries account for almost all of the liquids, and Figure 12.1 ranks them.
The identity is the book’s spine, and this sector sits on it in a peculiar way.
| Identity term | What this sector does to it | Value |
|---|---|---|
| One: working-age population | Nothing. Enclaves do not attract cohorts, they attract contractors | Set by demography, not by the sector |
| Two: employment-to-working-age ratio | Almost nothing directly, which is the finding rather than an omission | Median of minus 0.15 percent a year across the continent |
| Three: output per worker | Moves it mechanically, through a price the country does not set | Negative in eight of the fourteen producers |
Table 12.1. The three terms are the growth rates of Chapter 1’s decomposition. The continental median of term two is taken across the 53 cards carrying it. Sources: ILOSTAT modelled estimates, November 2025, via the country cards.
Term three is where the whole argument of this chapter lives. Output per worker is a ratio, and a rent sector raises the numerator without touching the denominator: a deepwater field employing a few hundred people can add a percentage point to a national aggregate that millions are dividing. When the price is high, measured productivity soars and nobody has learned anything; when it falls, measured productivity collapses and nobody has forgotten anything. Chapter 30 puts it exactly: nothing about the Angolan worker changed over the decade to 2024, the price of what the country sells did. Chapter 31 reads the same signature on the other bank of the Congo river, where Brazzaville posted the third worst third term of the fifty-three and shrinking output on a working-age population growing at 2.60 percent a year.
The producers, on their own cards
Table 12.2 is the sector’s fourteen countries as the country cards see them.
| Country | Term one: working-age population | Term two: employment ratio | Term three: output per worker | Implied growth | Observed growth | Wage employment (percent) | Non-agricultural employment (percent) | Confidence |
|---|---|---|---|---|---|---|---|---|
| Nigeria | 2.90 | 0.29 | -1.94 | 1.25 | 1.20 | 13.6 | 65.9 | low |
| Angola | 3.53 | 0.09 | -3.12 | 0.49 | 0.64 | 24.1 | 47.9 | medium |
| Algeria | 1.28 | -0.25 | 1.04 | 2.07 | 2.08 | 69.6 | 90.3 | medium |
| Libya | 1.88 | -0.15 | -0.25 | 1.48 | 1.60 | 73.7 | 89.5 | low |
| Egypt | 1.96 | 0.07 | 2.26 | 4.29 | 4.33 | 72.9 | 82.0 | high |
| Republic of the Congo | 2.60 | -0.01 | -4.00 | -1.41 | -1.52 | 23.1 | 63.2 | low |
| Gabon | 2.55 | 0.20 | -0.78 | 1.97 | 1.96 | 67.6 | 70.9 | medium |
| Equatorial Guinea | 3.17 | 0.03 | -7.07 | -3.88 | -4.11 | 72.7 | 44.9 | low |
| Chad | 4.14 | -0.43 | -1.31 | 2.40 | 2.47 | 8.5 | 28.1 | low |
| South Sudan | 1.17 | -0.44 | -4.70 | -3.98 | -5.45 | 17.5 | 36.2 | not computable |
| Ghana | 2.52 | -1.56 | 3.48 | 4.44 | 4.45 | 32.2 | 64.8 | medium |
| Mozambique | 3.25 | -0.47 | 0.57 | 3.35 | 3.35 | 14.5 | 26.9 | medium |
| Senegal | 3.51 | 1.50 | 0.27 | 5.27 | 5.29 | 35.3 | 69.4 | high |
| Mauritania | 3.37 | -0.52 | 1.21 | 4.05 | 4.07 | 42.3 | 67.2 | medium |
| Continental median | 2.89 | -0.15 | 0.74 | 2.91 | 31.0 | 59.0 |
Table 12.2. The first five columns are annual growth rates in percentage points over 2014 to 2024; the next two are shares of employment; the last is this book’s own data-quality flag. Term one is the working-age population aged 15 to 64; term two is modelled employment aged 15 and over over that population; term three is the residual. The median row is taken column by column across all cards carrying the field and is not a country. Sources: UN World Population Prospects 2024, ILOSTAT modelled estimates (November 2025) and the IMF World Economic Outlook (April 2026), via the country cards.
Term two does nothing, as it does everywhere. Eleven of the fourteen sit within half a percentage point of zero and Mauritania just outside it, and the two that are well away from it are Ghana at minus 1.56 and Senegal at plus 1.50, neither of which is about oil. Chapter 10 established that the middle term has been inert across the continent; here it is inert in economies whose export earnings moved by factors of three. If a sector this large could move employment, it would have shown up in this column.
Term three does the moving, and mostly downwards. Eight of the fourteen are negative, and six of the eight worst third terms on the continent belong to hydrocarbon exporters: Equatorial Guinea, South Sudan, the Republic of the Congo, Angola, Sudan and Nigeria, with only Eritrea and Burundi interrupting the sequence. The same pattern runs through observed growth: of the six slowest-growing economies of the decade, five are hydrocarbon producers, and South Sudan at minus 5.45 percent a year is the slowest on the continent. A decade that opened with oil above a hundred dollars a barrel and closed with it in the sixties is legible in a productivity series with no productivity in it.
The wage column contains the political economy of the sector, and it points both ways. Chad’s 8.5 percent is the lowest wage-employment share of the fifty-three cards carrying the overlay, Nigeria’s 13.6 the fifth lowest, Mozambique’s 14.5 not far behind; against them sit Libya at 73.7 and Equatorial Guinea at 72.7, among the highest on the continent. The difference is population, not policy. A rent divided among 1.9 million people can fund a state payroll that looks like a labour market; the same rent divided among 233 million cannot. Equatorial Guinea records $7,628 of output a head and Nigeria $1,223. Both are oil economies. Neither is a development model.
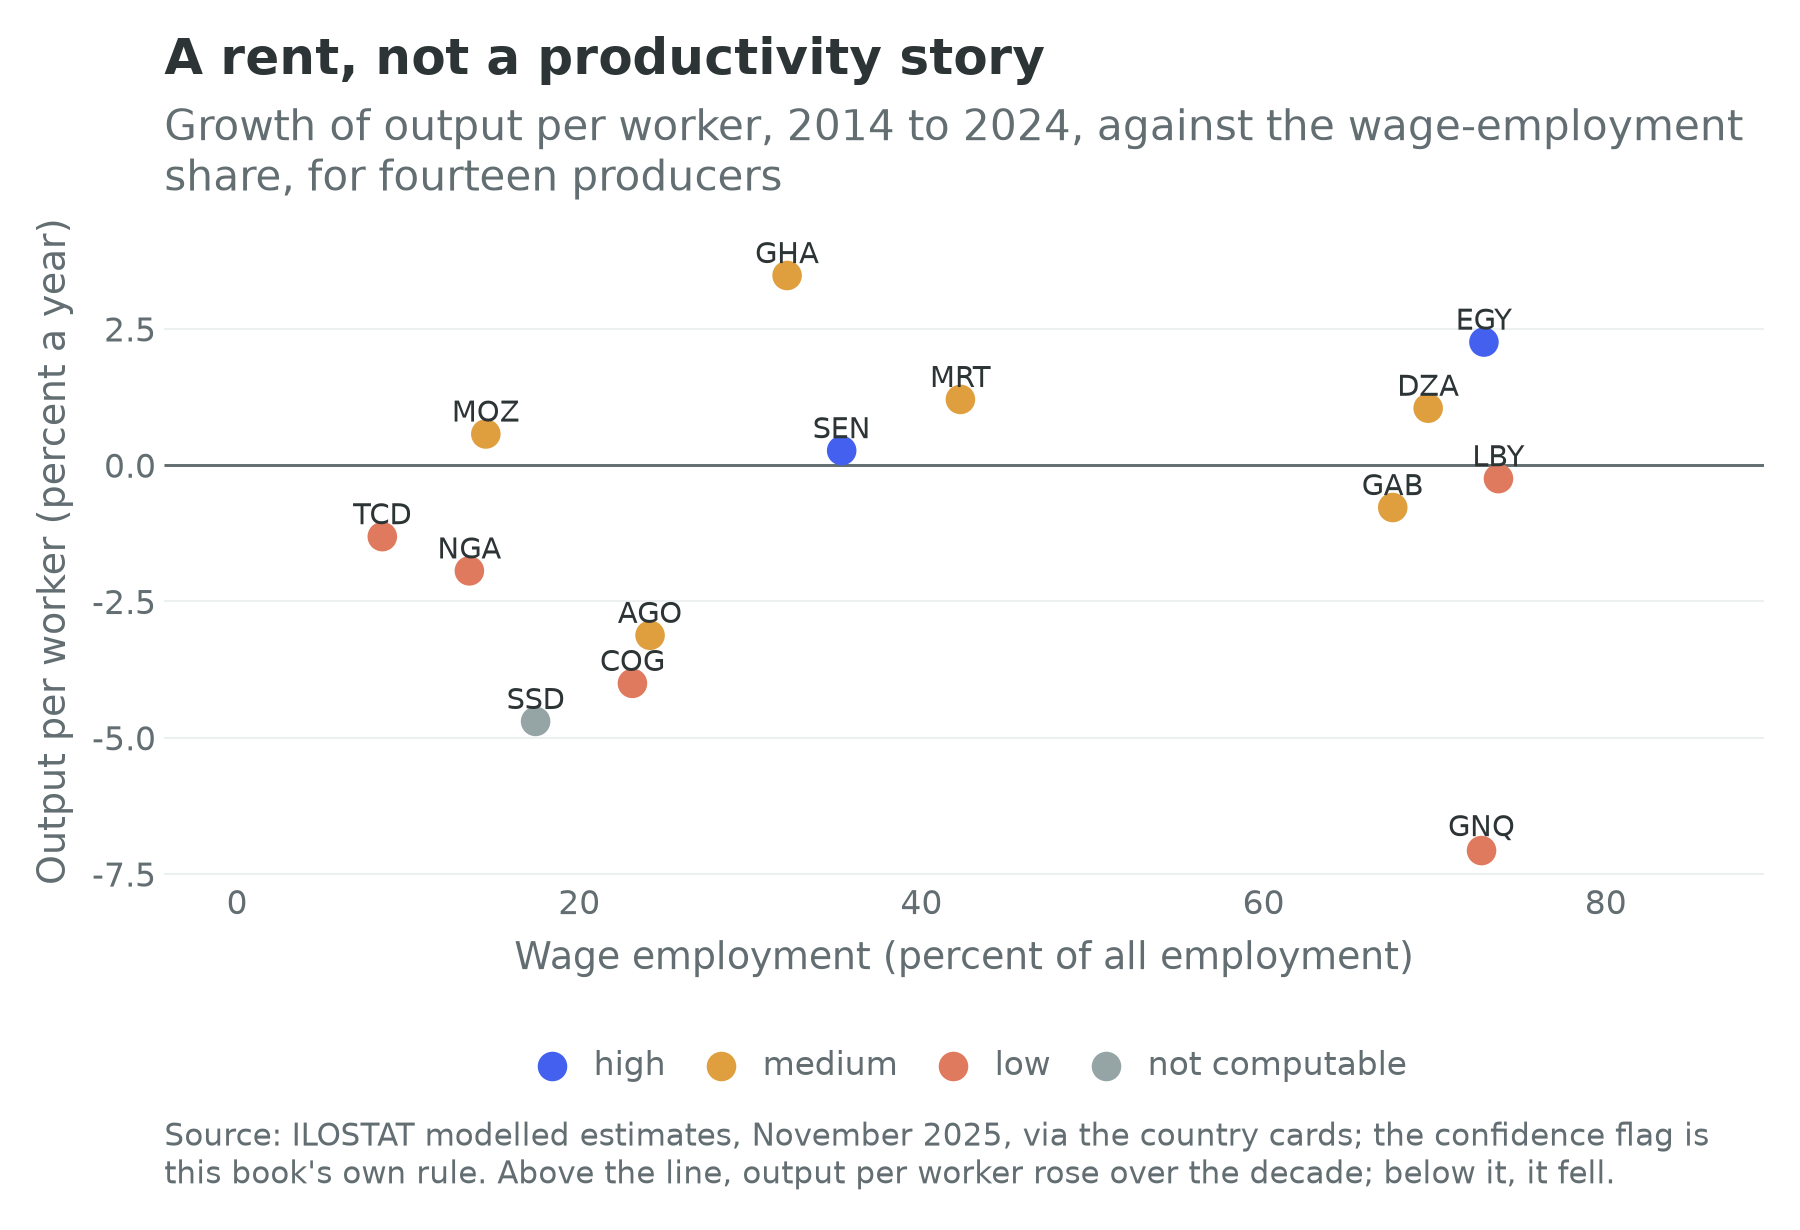
And the flag column should stop a reader in her tracks. Five of the fourteen are flagged low, one has no computable flag, and only Egypt and Senegal are flagged high. The three lowest statistical performance scores on the continent belong to South Sudan at 27.1, Equatorial Guinea at 32.1 and Libya at 34.8, all three hydrocarbon exporters. Libya last counted its population in 2006 and last surveyed its labour force in 2012; Equatorial Guinea last did either in 2015. That is not only a capacity problem. A state financed by a customs post at an export terminal does not need to know how many people it governs or what they do.
One warning before the sector chapter proper. The cards carry no sector fields: no production series, no petroleum employment, and only two trade fields: the top three exports and UNCTAD’s commodity-dependence share. Those two make the chapter’s stakes plain. Crude oil is 79.1 percent of Angola’s merchandise exports and 63.0 percent of Nigeria’s, and primary commodities are 96.7 and 95.2 percent. Every barrel and tonne here still comes from a named outside source and carries a citation.
2. How the industry works
The contract is the industry
An African barrel is sold three times before anyone burns it: once as a licence, once as a lifting and once as a cargo. The first sale is the one that determines who gets the money.
Most African petroleum is produced under a production-sharing contract, the instrument that spread from Indonesia in the 1960s. The state, or a national oil company acting for it, keeps ownership of the resource and contracts an international company to find and produce it at the company’s risk. Production is then divided in a fixed order: a royalty comes off the top, in barrels or cash; what remains splits into cost oil, a capped share the contractor keeps to recover its expenditure, and profit oil, divided between state and contractor on a sliding scale that steepens as cumulative production or the rate of return rises; corporate income tax is levied on the contractor’s share. Nigeria’s deepwater acreage runs on such contracts while much of the onshore runs on older joint ventures in which the state holds a direct equity interest and must fund its share of the capital budget.
Three features of that arrangement do most of the work here. The state’s take is back-loaded, because cost oil comes first, so a country that signs a field in 2015 and sees first oil in 2024 has waited a decade for much of anything, which is politically very hard to explain and is why frontier producers over-promise. The take is asymmetric in the price: at high prices the sliding scales bind and the state’s share rises, at low prices cost recovery is protected and the state’s share collapses towards the royalty. And everything depends on the state being able to audit costs, because a ministry that cannot verify what a development cost cannot verify how much cost oil the contractor may keep.
The national oil company
Every producer has one and they are not the same animal. NNPC Limited was incorporated in September 2021 under Nigeria’s Petroleum Industry Act as a company under ordinary company law, with shares, a board and an obligation to publish accounts. Sonatrach in Algeria and the Egyptian General Petroleum Corporation are closer to line ministries with drilling rigs, and both carry the domestic supply obligation as their first duty. Sonangol in Angola was until 2019 both concessionaire and operator, licensing acreage to companies it competed with, until the government moved the concessionaire function to a separate agency. Ghana’s GNPC is the smallest and most conventional, a state participant with a carried interest and no illusion of running the industry.
What such a company does on a Tuesday is more revealing than its statute. It receives the state’s barrels; it decides who lifts them; it settles the joint-venture cash calls, or fails to; it runs the domestic refineries and the fuel-import programme; and, in several countries, it borrows. That last function matters most here, because a national oil company borrowing against future production has created a sovereign obligation that does not appear in the sovereign’s debt statistics.
Liftings, traders and the cargo
The state’s barrels are physical, and somebody has to buy them, move them and sell them into a refinery. That somebody is usually one of a handful of privately held trading houses, Glencore, Vitol, Trafigura and the trading arms of the majors, which win term contracts from the national oil company, lift cargoes at the export terminal, blend and ship them, and earn a margin in cents a barrel on volumes in the millions.
The margin is not where the money is. The money is in the financing attached to the lifting: a trader that pre-pays for eighteen months of cargoes has made a secured loan at a rate reflecting the collateral rather than the sovereign’s credit, and has bought a physical stream at a fixed differential. Chapter 31 documents Brazzaville’s version, under which the state still owed nearly $1.7 billion to two traders and their banks at the start of 2020, secured on future cargoes (Reuters, 2020); Chapter 30 documents the larger Angolan version, in which oil-collateralised lending from Chinese policy banks financed a reconstruction programme. The economics are perverse in a way ordinary sovereign debt is not. Repayment is denominated in barrels, so a price fall cuts government revenue and simultaneously raises the number of barrels the creditor takes to service the same obligation, and the loan is senior to everything else the state might do, immune to the exchange rate, and largely invisible to a debt sustainability analysis conducted on the sovereign’s own books.
What leaks: theft, subsidy and the missing refinery
Three leaks between the wellhead and the citizen recur across the sector, and Nigeria has the largest of each.
The first is theft. Crude is taken from pipelines in the Niger Delta at industrial scale, by tapping trunk lines and diverting export streams, and refined in creek-side artisanal plants known in the delta as kpo-fire. Nigeria’s transparency initiative, in a 2023 policy brief, put losses to theft at 619.7 million barrels between 2009 and 2020, worth about $46.16 billion (Okonkwo, 2023), and terminal receipts at Forcados and Bonny fell far below field production for years. Theft on that scale is not a policing failure; it is an economy, with financiers, buyers, security arrangements and a labour force, and Chapter 24 treats the delta’s political settlement as the thing that has to change first.
The second is the subsidy. For fifty years Nigeria sold petrol below import parity and paid the difference, a transfer reaching several percent of GDP in bad years, accruing disproportionately to car-owning urban households, and functioning as the largest single deal in the Nigerian political settlement. It was removed on 29 May 2023 and the naira, ₦, was floated a fortnight later; the government reports savings of ₦15.8 trillion to the federation between June 2023 and December 2025 (Oladele, 2026). Chapter 24 argues about what that reform was. The mechanism belongs here: a fuel subsidy is a petroleum policy that shows up as fiscal policy, and removing it converts an invisible transfer into a visible price, which is why so few governments manage it.
The third is the refining gap. Nigeria’s state refineries at Warri, Kaduna and Port Harcourt have nameplate capacities of 125,000, 110,000 and 60,000 barrels a day and have spent most of two decades at a fraction of them; Cameroon’s Sonara has not run since a 2019 fire, Morocco’s Samir has been in liquidation since 2015, and South Africa’s Durban refinery closed in 2022 (Global Energy Monitor, 2026). Against that record the Dangote refinery at Lekki reached its full design capacity of 650,000 barrels a day in February 2026 (Vanguard, 2026). Section 9 profiles it.
Gas: flaring, power and liquefaction
Associated gas comes up with oil whether anyone wants it or not, and for most of African petroleum history nobody did. Global flaring reached 151 billion cubic metres in 2024, and Nigerian volumes rose 12 percent that year alone (World Bank, 2026c); Section 8 takes up what that means. Every flare is gas that could have run a turbine, and the standard African argument is that the first claim on it should be domestic electricity. The argument is right and the obstacle is not the gas. A gas-to-power chain needs a creditworthy offtaker at the end of it, and Chapter 14 shows that most African utilities are not one. Gas that cannot be sold to a utility that pays gets exported or burned, and the choice between those two is made by whoever will build a pipeline or a liquefaction plant.
Liquefaction is the other route and the sector’s growth story. Figure 12.3 plots the African fleet.
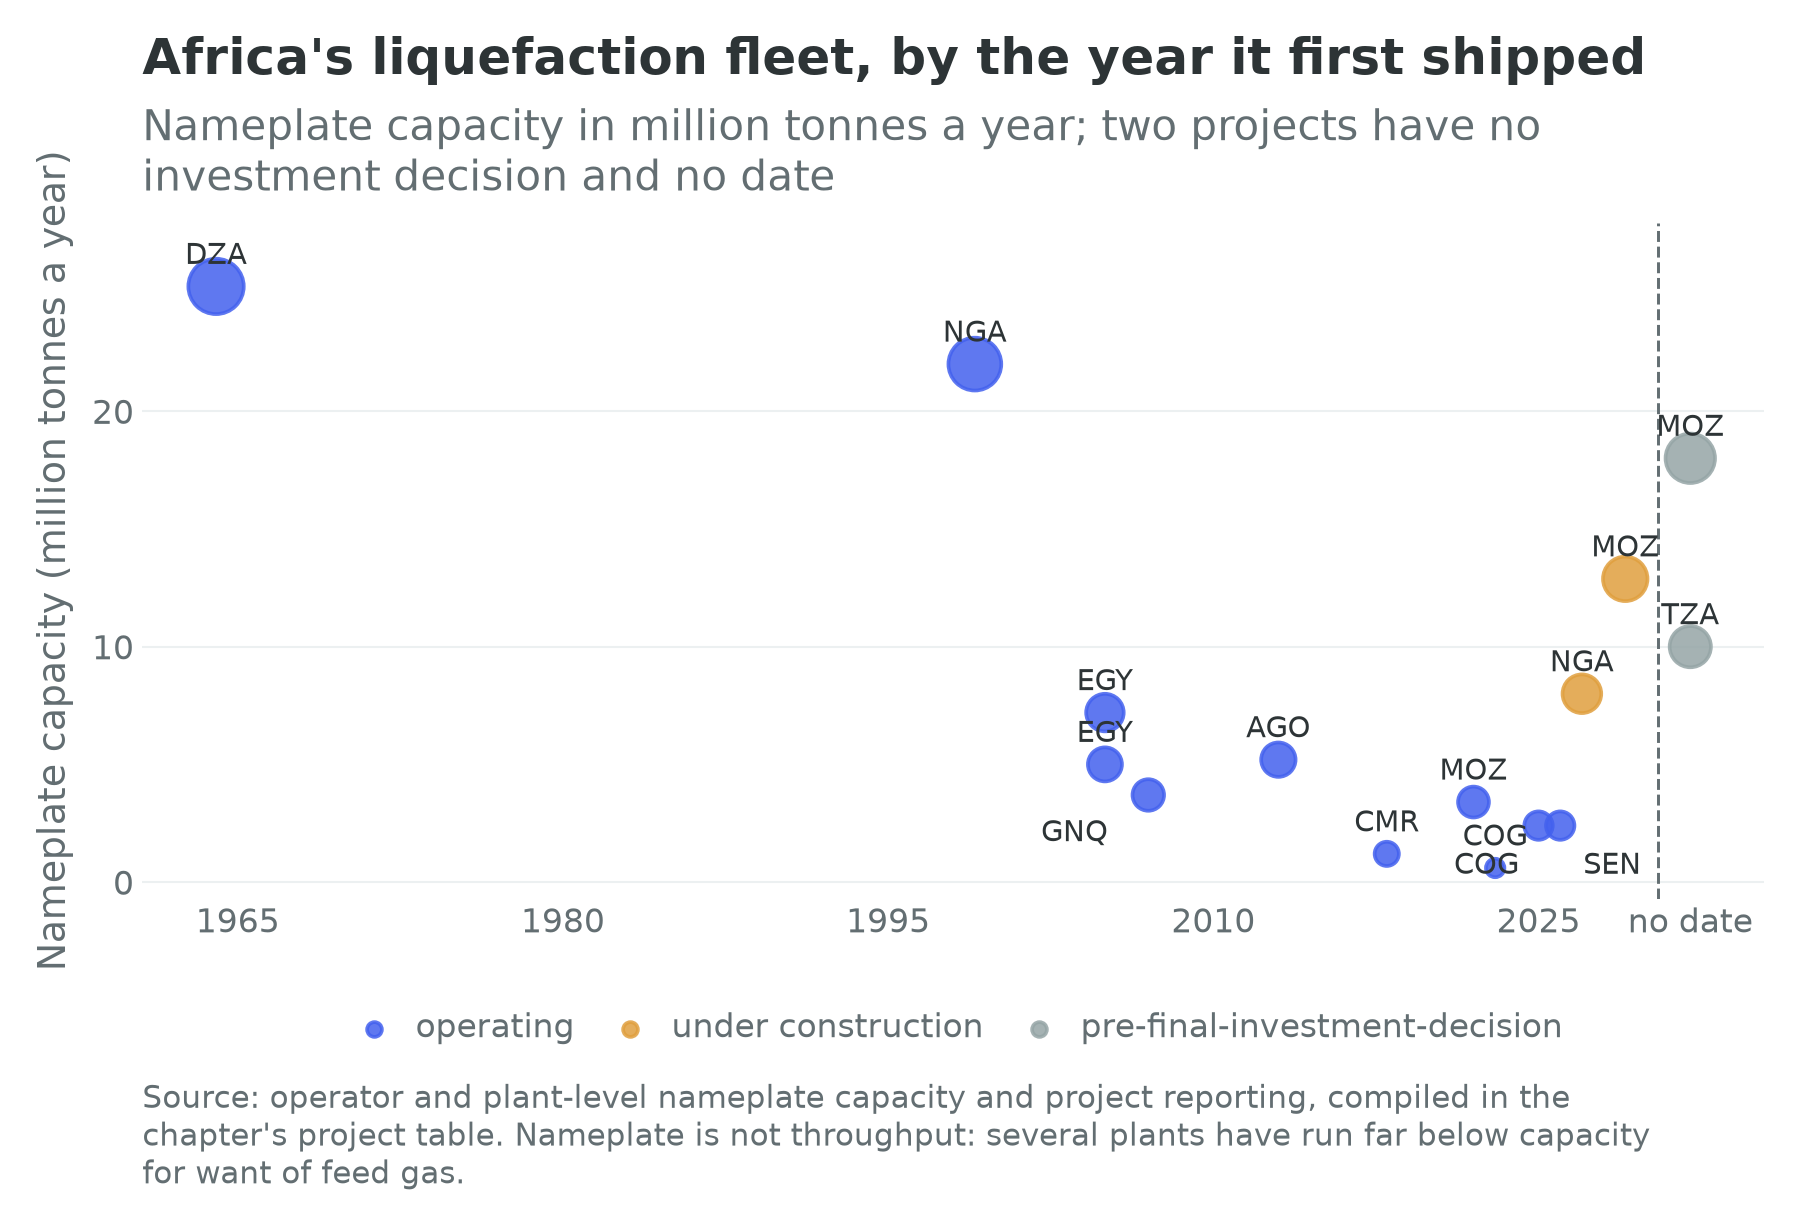
The shape of that chart is the sector in one image. Two very large plants, Arzew in Algeria and Bonny in Nigeria, were built in the twentieth century and still dominate the capacity total. Everything since has been smaller, and much of it floats. The Coral Sul vessel off Mozambique, the Tango and Nguya vessels off the Republic of the Congo and the Hilli Episeyo off Cameroon are liquefaction plants that can be built in a shipyard, towed into place and, if the politics turn, towed away. That is a technological change with a political-economy consequence: floating capacity lowers the sunk cost of producing gas in a country whose institutions a lender does not trust, which is why the projects that have delivered on schedule in Mozambique and the Republic of the Congo are the offshore ones and the onshore one has not.
3. Industry structure
The majors, in retreat from the shallows and committed to the deep. TotalEnergies, Eni, Shell, ExxonMobil and Chevron remain the technical core of African deepwater and are concentrating their capital there, having spent a decade leaving the onshore. Shell completed the sale of its Nigerian onshore subsidiary to Renaissance Africa Energy in March 2025, under a January 2024 agreement worth up to $2.4 billion, and kept its deepwater and integrated-gas positions; ExxonMobil sold its Nigerian shallow-water business to Seplat, and Chevron and Equinor made comparable exits (World Oil, 2024; Shell, 2025; Seplat Energy, 2026). The divestment is usually read as a climate story and is better read as a risk story: onshore assets carry theft, community liability, litigation and spill exposure that a listed major cannot price, and deepwater assets carry none of them, because they sit 150 kilometres out to sea and are guarded by physics.
The Asian entrants, who do what the majors will not. The China National Petroleum Corporation built and operates the Sudanese and South Sudanese industry, including the pipelines through Port Sudan on which landlocked South Sudan’s entire export depends, and operates the Doba fields in Chad. CNOOC holds Ugandan acreage alongside TotalEnergies, and Petronas has long been present in both Sudans. State-linked Asian companies have taken positions in jurisdictions the majors treat as uninsurable, on terms that are often opaque, and have supplied engineering and construction capacity as part of the package.
The African independents, who are the real change. The transfer of the Nigerian onshore from majors to indigenous companies is the largest ownership change in African petroleum this century. Seplat Energy, listed in Lagos and London, more than doubled production after acquiring ExxonMobil’s shallow-water business and reported group output of 131,506 barrels of oil equivalent a day for 2025 (Seplat Energy, 2026); Oando, Aiteo, Heirs Energies and Renaissance hold assets that were Shell’s, Eni’s or Chevron’s a decade ago. Whether this is indigenisation or risk transfer is a live question. The independents are more willing to work the assets, closer to the communities and cheaper to run, and they are also more thinly capitalised, more exposed to a price fall and, in several cases, financed by the same traders who buy their crude.
The traders and the refiners. The trading houses are the sector’s most powerful actors and its least visible, because they are privately held and their African exposure is spread across prepayments, offtakes, terminal concessions and equity stakes. The refiners are new: Dangote Industries is now the largest single refiner on the continent by a wide margin, the Cabinda refinery in Angola is under construction, and if the announced projects are built Africa adds capacity on the order of 1.2 million barrels a day by 2030 (OPEC, 2025b).
Where the rent goes
Ownership is only half of the balance-sheet question; the other half is where the receipts end up. Three answers recur.
The first is a savings fund. Ghana’s petroleum funds, described in Section 6, are the best-designed. Nigeria’s sovereign investment authority reached total assets of ₦4.91 trillion, about $3.42 billion, at the end of 2025, and Angola’s fund reported total assets of about $4.7 billion at the end of 2025 (Nigeria Sovereign Investment Authority, 2026; Andrade, 2026). Set those against the size of the economies they sit in and the point makes itself: two of the continent’s largest hydrocarbon producers have saved, between them, less than a tenth of what Angola alone has borrowed from Chinese lenders.
The second is debt, and it is much the larger number. Angola’s cumulative recorded Chinese loan commitments of $49.2 billion are more than a quarter of the total for the 49 African governments the loan database covers, and its external debt stock of $58.7 billion is 41 percent of output. The Republic of the Congo carries $5.0 billion of Chinese commitments against an entire external debt stock of $6.7 billion, and $1.7 billion of its recorded creditors sit under “other private”, which is where a trader’s prepayment goes when it is recorded at all. Both cards carry the creditor side of that. Angola owes $14.4 billion to creditors in China against an official bilateral column of $4.1 billion, and the Republic of the Congo $3.0 billion against $2.3 billion, the excess in each case sitting in the private column where a facility contracted through a state oil company and secured on deliveries belongs. Both also carry a collateralisation note, six resource-backed loans for Angola and five for the Republic of the Congo, from the only published register of the instrument. That register stops in 2018 and its authors disclaim comprehensiveness, so it is a floor rather than a count, and the trader prepayments in the paragraph above are outside it. On the official record the instrument this chapter is about is not invisible but undercounted, which is a different problem and a more tractable one.
The third is project debt, and Mozambique is the exhibit. Its card records an external debt stock of $69.8 billion against output of $22.3 billion, more than three times GDP, while the creditor lines the card carries, multilateral, bilateral, bond and other private, name only $10.1 billion of it. The gap is the liquefaction projects, financed against plants that have not yet shipped a cargo. That is not a sovereign liability in the ordinary sense, and it is not nothing either: a country whose recorded external obligations are three times its output has bet its external position on a gas price in the 2030s.
4. Geographic distribution
Seven petroleum provinces carry almost all of it, and their relationship to the book’s growth poles is instructive because it is so weak.
The Niger Delta and the Gulf of Guinea deepwater is the largest and the only province inside a pole: Chapter 24’s Lagos to Abidjan corridor holds the Lekki refinery, the Bonny liquefaction plant and the export terminals, though the producing fields lie east of the pole’s spine. Offshore Angola, from Cabinda south, has no pole, and Chapter 30 makes the point that Luanda and Angola’s growth pole are not the same place. The Algerian Sahara, with Hassi Messaoud for oil and Hassi R’Mel for gas, is a thousand kilometres from anywhere anyone lives, connected north by pipeline to Arzew, Skikda and, under the Mediterranean, to Spain and Italy. The Egyptian Mediterranean, where the Zohr field transformed the country’s gas balance after 2015, sits inside Chapter 27’s pole and is the only province in Africa whose gas has been consumed at home at scale. The Rovuma basin off northern Mozambique holds the continent’s largest undeveloped gas resource in one of its poorest and least governed provinces, 2,000 kilometres from Maputo. The MSGBC basin off Mauritania and Senegal is the newest, and the Greater Tortue Ahmeyim plant on the maritime boundary is the first African liquefaction project shared between two sovereigns. And the East African rift will export Uganda’s Lake Albert crude through the pipeline to Tanga. The chapter’s data file lists the fields, terminals, refineries and pipeline termini it names, with their coordinates, for the Growth Pole Map.
The pattern worth extracting is that African petroleum is systematically not where African economic geography is: four provinces are offshore, one is in the Sahara and one is at war. Chapter 22 shows what a consumption city financed by resource rents looks like, and Gollin, Jedwab and Vollrath (2016) named the mechanism, in which rents accrue to a capital, the capital grows on the spending of them, and no tradable production appears. Luanda, Port Harcourt, Malabo and Douala are all, to varying degrees, that city. A refinery, a liquefaction plant and a fertiliser complex are the only ways a hydrocarbon province acquires an industrial hinterland.
5. Workforce
The sector’s employment footprint is the smallest of any in Part III relative to its output, and nobody knows its size precisely. No African labour-force survey publishes a petroleum employment count this book would quote at two significant figures, and the cards carry no sector employment field. What can be said is bounded and it is enough.
Direct employment in upstream petroleum runs to tens of thousands across a continent with a working-age population of 867 million. A deepwater field is operated from a floating vessel with a crew of a few hundred on rotation. A liquefaction train employs on the order of a thousand people when running and ten times that while being built, which is why the employment case for these projects is always made about the construction phase. Mozambique LNG had over 4,000 people mobilised at Afungi in early 2026, more than 3,000 of them Mozambican (TotalEnergies, 2026). That is a large number for Cabo Delgado and a rounding error in a national labour market, and it ends when the plant is finished.
The jobs that exist are good and few. Petroleum work is waged, contracted, often unionised and paid at multiples of the national average, which is exactly why it is politically explosive: a small, well-paid, frequently foreign workforce beside an unwaged local one is the standing grievance of every producing region on the continent. In Nigeria, where 13.6 percent of employment is waged and 93.1 percent informal, the sector is a rounding error in the labour market and a permanent feature of the politics.
The indirect footprint runs through local content, and Section 6 assesses the statute. What the identity says is narrower and harder: for local content to move term three, the firms it creates have to outlive the project that created them. A fabrication yard that exists because the law required one, and closes when the field is complete, has moved employment for four years and productivity not at all.
Two observations from the overlays. Non-agricultural employment among the producers runs from 26.9 percent in Mozambique to 90.3 percent in Algeria, a reminder that “hydrocarbon exporter” describes a fiscal condition rather than an economic structure. And youth idleness is worst in the producers with the thinnest states: 44.1 percent of young Mauritanians and 42.3 percent of young Chadians are not in employment, education or training, the fifth and sixth highest rates of the cards carrying the overlay. Both countries have new hydrocarbon revenue. Neither has anything that converts it into work.
6. Regulation and policy
Local content. The Nigerian Oil and Gas Industry Content Development Act of 2010 is the continent’s reference statute: it reserves categories of work for Nigerian companies, sets minimum Nigerian equity and employment thresholds, requires content plans to be approved before contracts are awarded, and funds a development board from a levy on industry contracts (Federal Republic of Nigeria, 2010). Its effect is genuinely contested. Fabrication, marine services, engineering design and inspection capability grew, and a domestic services industry now exists that did not in 2005. Against that, thresholds create rents of their own, front companies exist to satisfy them, and the levy taxes investment in a country that needs it. Ghana, Angola, Mozambique and Tanzania have legislated versions since, and Tanzania’s terms are one reason its liquefaction project has not reached an investment decision.
The Petroleum Industry Act. Nigeria’s PIA of 2021 was twenty years in the making and did three things: it split the regulator into upstream and midstream authorities, converted the national oil corporation into a company under company law, and created host community development trusts funded at 3 percent of a licensee’s annual operating expenditure in the preceding financial year, a legally binding obligation on operators to fund development where they operate (Federal Republic of Nigeria, 2021). Five years on the assessments are mixed. The trusts exist, disbursement has been slow and uneven, and the delta’s underlying grievance has not visibly moved. The fiscal terms achieved their narrower purpose: deepwater investment resumed.
The Ghana model. Ghana’s Petroleum Revenue Management Act of 2011 is the most-copied African framework and deserves its reputation. It routes all petroleum receipts through one holding fund, allocates a share to the budget under a formula, and puts the rest into a stabilisation fund that can be drawn when receipts fall short and a heritage fund reserved for future generations. At the end of 2025 the two held $1.55 billion between them, $1.38 billion of it in the heritage fund, against second-half receipts of $399.65 million, on the central bank’s semi-annual report (Anyetei, 2026). The framework survived a sovereign default and a domestic debt exchange, which is a real test. What it did not do is make Ghana’s oil large enough to matter: the country’s third term of 3.48 percent a year is the third highest on the continent and has little to do with petroleum.
The frontier, and the financing fight. Uganda’s Lake Albert development and the 1,443-kilometre East African Crude Oil Pipeline to Tanga are the sector’s clearest test of whether new oil can still be financed. A sustained campaign persuaded a long list of international banks and insurers to rule the project out; the sponsors closed the gap with regional and Islamic institutions, among them Afreximbank, Standard Bank and the Islamic Corporation for the Development of the Private Sector (EACOP Limited, 2025), and the line reached 82 percent completion by April 2026 on the company’s own update (TanzaniaInvest, 2026). Kenya’s Turkana discovery, by contrast, has never reached an investment decision. The lesson African finance ministries drew is not the one the campaigners intended: Western capital can be replaced, at a price, and the price is bearable.
Domestic supply obligations and the price of fuel. Almost every producer obliges companies to sell a share of production at home, usually below the export price, and almost every producer regulates the pump price. The combination is a second, quieter subsidy, and it is why the Dangote refinery’s crude sourcing became a political question: a refinery that buys at export parity and sells into a regulated market has a margin set by a ministry. Angola, Egypt and Nigeria have all attempted subsidy reform in the last four years and all three found the same thing, that the political cost arrives immediately and the fiscal benefit over a parliament.
7. Recent trends
Refining came home, in one country. The Lekki refinery reached nameplate in February 2026 and now supplies Nigeria with petrol, diesel and jet fuel and ships cargoes to Ghana, Togo, Côte d’Ivoire, Cameroon and Tanzania (Logistics Business, 2026). Substituting an import saves foreign exchange and removes a recurring source of currency pressure, and it does so with a capital-intensive plant inside a free zone with its own power and customs. It solves a balance-of-payments problem; it does not solve a term-two problem.
The Nigerian onshore changed hands. Between 2021 and 2025 Shell, ExxonMobil, Eni and Equinor sold most of their Nigerian onshore and shallow-water positions to indigenous companies. Seplat’s 2025 accounts show the successful version: production up 148 percent, revenue up 144.2 percent, and an idle-well programme that added about 48,600 barrels of oil equivalent a day of gross capacity from 49 wells (Seplat Energy, 2026). The unsuccessful version, in which a thinly capitalised buyer inherits an ageing asset with an unfunded decommissioning liability and a community dispute, has not yet met a sustained price fall.
The gas wave arrived, unevenly. Greater Tortue Ahmeyim shipped its first cargo in April 2025, making Mauritania and Senegal exporters for the first time (Kosmos Energy, 2025). Congo LNG’s second floating unit, Nguya, shipped its first cargo in February 2026, lifting the project’s capacity to 3 million tonnes a year (Offshore, 2026). Mozambique’s onshore project lifted the force majeure declared after the 2021 attack on Palma and restarted construction, with first LNG expected in 2029, while Rovuma and Tanzania remain undecided (TotalEnergies, 2026). Nigeria’s Train 7 was more than 92 percent complete in May 2026, by its project director’s account, and will take Bonny from 22 to 30 million tonnes a year (Uzoho, 2026). Namibia’s Orange basin is the most interesting frontier on the continent and is not yet a development.
Algeria pivoted north, and Libya produced against expectation. The disruption of Russian pipeline gas to Europe after 2022 made Algeria the continent’s most strategically placed exporter overnight: 25.3 million tonnes a year of liquefaction at Arzew and Skikda (Ait Amedjkane, 2025), pipelines to Italy and Spain, and a market willing to sign long contracts. The constraint is upstream, since domestic consumption has grown fast and the fields feeding the export system are mature. Libya, meanwhile, has recovered to well over a million barrels a day despite two competing administrations, periodic blockades of the export terminals and a national oil company both sides have tried to control. It is the clearest demonstration in the sector that oil production is compatible with the near-absence of a state, provided the terminals work and the buyers keep paying, and it is why a country with a statistical performance score of 34.8 appears in every production ranking.
The sector in the book’s two worlds
Chapter 1 asked the reader to hold two worlds at once: one in which the marginal worker still matters, and one in which the frontier of production is compute, energy and capital and labour is a complement at best. Most sectors in Part III look different under the second assumption. This one barely changes, and that is the finding.
In the labour-abundant world, oil and gas is a financing sector rather than a growth sector. Its function is to earn foreign exchange, fund a state and, if the settlement allows, pay for the roads, ports, grids and schools that let other sectors employ people. On that test the record is poor, and the reason is documented: rents that arrive without taxation weaken the state’s incentive to bargain with its own citizens (Ross, 2012). The chapter’s table is a version of the same finding, since the countries with the largest rents per head have among the worst productivity records and the weakest statistics on the continent.
In the labour-redundant world, the sector is not a warning. It is the template. Chapter 8 makes this argument for currencies and it generalises: a commodity exporter is already an economy whose income depends on what it owns rather than what its people produce, whose measured productivity moves with a world price rather than a worker’s skill, and whose state has no fiscal reason to bargain with its workforce. If output at the frontier stops needing labour, that is what most economies become, and everything the resource-curse literature has learned about such economies becomes evidence about the second world rather than a curiosity of the first. It is not encouraging evidence.
The transition question splits the two worlds. In the first, the case for African gas is a development case: build the plants, sell the cargoes, electrify the continent with the gas now flared, and accept the emissions on the ground that they are small and the alternative is poverty. In the second, energy stops being an input to industry and becomes an input to compute, and a continent selling electrons and molecules to the world’s data centres is a plausible growth economy, which is why Chapter 14 is an energy chapter rather than a climate chapter and why the gas off Mozambique and Mauritania may be worth more as domestic generation than as cargoes. The counter-case is the one this chapter has been making throughout: an economy that exports energy to somebody else’s machines has the same structure as one that exports crude to somebody else’s refineries, and the difference between the two futures is who owns the machine.
8. Climate exposure
The sector’s climate exposure runs in three directions, and only one of them is the one usually discussed.
Stranded assets are a real risk and a badly stated one. Under the International Energy Agency’s stated-policies scenario and its more ambitious transition scenarios, global oil demand peaks around 2030 and declines thereafter; only under its current-policies scenario does demand keep rising to 2050 (International Energy Agency, 2025c; Evans and Nam, 2025). In a decline, the assets that fail first are the highest-cost and longest-payback ones. African deepwater and greenfield liquefaction are long-payback by construction: a project sanctioned in 2026 for first production in 2032 is asking for thirty years of demand. But the stranding does not fall on the African state in the way the phrase implies. Under a production-sharing contract the contractor bears the development cost and recovers it out of cost oil, so if the price collapses the state loses a revenue stream it had not yet received while the contractor loses capital already spent. What the state genuinely strands is the fiscal path it planned around and the borrowing it did against it, which is why resource-backed debt is the sharper exposure.
The right-to-develop argument should be stated at its strongest. The African Union’s Executive Council adopted a Common Position on Energy Access and Just Transition in July 2022, holding that the continent will deploy all its energy resources, renewable and non-renewable, to reach universal access, and naming natural gas as a transition fuel (African Union, 2022). The arithmetic is not seriously contested: Africa’s share of cumulative emissions is a few percent, some 600 million people on the continent lack electricity, and the gas would displace charcoal, diesel and biomass. The African Energy Chamber makes the harder version: the institutions that cut off capital for African oil and gas on climate grounds still fund gas development in Europe, a double standard it calls financial apartheid (African Energy Chamber, 2024). On that reading the embargo has a distributional consequence and no climate one. The counter-case, made by African environmental economists as well as outsiders, is that gas-for-export is not gas-for-access, and that the Mozambican and Tanzanian schemes are export terminals in countries where most people have no power.
Methane and flaring are where the industry’s argument is weakest. Global flaring rose for a third consecutive year to 167 billion cubic metres in 2025, and three African producers sit among the nine countries responsible for more than four-fifths of it (World Bank, 2026c). Flared gas is a climate cost with no development benefit and no revenue, and it is the cheapest abatement available anywhere, because the gas is already at the surface. Nigeria has had a flare-out target for thirty years and has missed every one. A sector arguing for its right to produce gas on development grounds while burning it at the wellhead is arguing against itself.
The physical exposure is smaller but not zero: coastal terminals and refineries sit at sea level in the Niger Delta, one of the most rapidly subsiding deltas in the world, and Chapter 34 carries the adaptation finance question that follows.
9. Firm profiles
Dangote Petroleum Refinery, Nigeria
The refinery on the Lekki peninsula east of Lagos has a nameplate capacity of 650,000 barrels a day, reached in February 2026, which the company calls a first for a single-train refinery of that size (Vanguard, 2026). It was inaugurated in May 2023, began producing diesel and aviation fuel in January 2024, and sits inside the Lekki Free Zone on a 2,635-hectare site, linked to the Niger Delta by about 1,100 kilometres of subsea pipeline (Agence France-Presse, 2023; Agence France-Presse, 2024). Nothing else built in Africa this century is of that order, and a Nigerian industrial group built it, not a major and not a state. Chapter 24 profiles the wider Dangote Group and its cement business; the refinery is profiled here because it is this sector’s central object.
It answers the sector’s oldest question and reframes the second oldest. The old question is why a continent that exports millions of barrels a day imports the product refined from them, and the answer was always that refining is a low-margin business with a large minimum efficient scale: no African market except Nigeria’s was big enough and no African sovereign creditworthy enough to finance one. Dangote solved that with a group balance sheet, bank syndicates and retained earnings from cement.
The reframing is the interesting part. A refinery converts an export of crude into an export of product and an import bill into domestic supply, and for Nigeria both foreign-exchange gains are large. But the plant is capital-intensive, employs a few thousand people directly, sits inside a customs-exempt zone, and buys much of its crude on the international market rather than from Nigerian producers, because Nigerian crude sells at export parity and the refinery is a commercial buyer like any other. Its crude sourcing has been a running political argument, and it points at what this chapter keeps returning to: moving one stage down the value chain changes where the margin is booked without changing how many people the sector employs. The owner announced in October 2025 an intention to expand towards 1.4 million barrels a day, which the company says would make it the largest refinery anywhere (Vanguard, 2025). Whether that is industrial policy by other means or a monopoly with a good press office is a question Chapter 24 puts and this chapter does not settle.
NNPC Limited, Nigeria
NNPC Limited is the test case for whether a national oil company can be made into a company. Incorporated in September 2021 under the Petroleum Industry Act, it publishes audited accounts, has a board, and reported revenue of ₦45.1 trillion and profit after tax of ₦5.4 trillion for 2024 in audited accounts released in November 2025 (Addeh, 2025). It holds the state’s equity in the joint ventures, runs the state refineries and is the counterparty on the crude-backed financing that has funded the federal government through repeated cash crises.
It is profiled because the transformation is incomplete in a diagnostic way. A company under company law can still be the government’s cash machine, and the crude-backed prepayment facilities are the mechanism by which a corporatised national oil company reproduces the sovereign’s old problem in a new legal form. The published accounts are a real advance; the refineries still run far below capacity; the dividend is a fiscal transfer a finance ministry budgets for. Corporatisation changed the accounting and has not yet changed the incentives.
Seplat Energy, Nigeria
Seplat is the strongest evidence for the indigenisation thesis. Listed in Lagos and London, it bought ExxonMobil’s Nigerian shallow-water business for $1.28 billion and, in its first full year of ownership, more than doubled group production to 131,506 barrels of oil equivalent a day, lifted revenue 144.2 percent to $2,725.9 million and adjusted earnings before interest, tax, depreciation and amortisation 137 percent to $1,275.4 million, while cutting net debt a quarter to $673.3 million (Seplat Energy, 2026). It restored 49 idle wells at a gross cost of about $60 million.
Those numbers describe a specific kind of value creation: not discovery, but the recovery of production a major had let decline because the assets were too small to matter on its portfolio and too troublesome to defend. That is a genuine African comparative advantage and a limited one. Seplat’s gas business, which supplies domestic power generation, is the part that would move the identity, and it is the smaller part.
Sonangol, Angola
Sonangol shows what the same institution looks like after forty years of a different settlement. It was for decades the concessionaire, the regulator’s shadow, the state’s borrower and an operator in its own right, and it financed the reconstruction of a country through oil-collateralised lending; its concessionaire role passed to a separate agency in 2019. It reported 2025 net profit of $750 million, down from $846 million, on net entitlement production of 217,000 barrels of oil equivalent a day, and recorded that China took 69 percent of Angolan crude exports (Ver Angola, 2026). Section 3 gives the debt that came with those cargoes, and Chapter 30 reconciles it with the official statistics. The firm’s current strategy is partial privatisation and diversification. Whether a national oil company can become an ordinary company in a settlement that still needs it to be something else is the question NNPC poses, asked twenty years later.
10. What the evidence says
There are almost no randomised experiments in this sector, for the obvious reason that nobody randomises an oil field. The evidence is quasi-experimental, and it is worth being precise about what it can and cannot settle.
What the evidence says: oil, institutions and where the money goes.
A discovery, and a control group. Vicente (2010) used the announcement of oil in São Tomé and Príncipe at the end of the 1990s as a natural experiment, with Cape Verde as the comparison: two small, poor, Portuguese-speaking Atlantic archipelagos with similar institutions, one of which was suddenly told it was about to become a producer. Using survey measures of perceived corruption before and after, he found significant increases in São Tomé relative to Cape Verde, concentrated where the anticipated rent would land, including vote-buying, customs and public procurement. The finding is about anticipation: the corruption arrived before the oil did, and São Tomé never produced commercially. That is as close to clean identification of the political effect of a discovery as this literature has.
Where the rents go. Andersen, Johannesen, Lassen and Paltseva (2017) matched quarterly petroleum rents against Bank for International Settlements records of foreign-owned deposits in tax havens, and found that windfalls in autocratic petroleum states are followed by increases in haven deposits, with no comparable effect for ordinary financial centres and none in democracies. The design cannot name an account holder. It can establish that the aggregate pattern is consistent with diversion rather than investment, and that political institutions condition it.
The pattern across countries. Ross (2012) assembled the broader case: petroleum wealth, in the modern form in which states own the resource and collect the rent directly, is associated with more durable authoritarian rule, lower female labour-force participation and more frequent civil conflict in low-income countries, through the fiscal channel rather than through geology. This is cross-country evidence with the identification problems that implies, and the two studies above test its mechanism more cleanly.
A proposal untried at scale. Moss, Lambert and Majerowicz (2015) set out the oil-to-cash idea: distribute a fraction of petroleum revenue directly to citizens as a universal dividend and tax it back, rebuilding the fiscal bargain the rent destroyed. Alaska and Iran are partial precedents. No African producer has implemented it, so there is no African evidence, and its advocates present it as a hypothesis with an implementation problem rather than a demonstrated result.
What none of this answers. The evidence establishes that resource rents change political behaviour and that institutions condition how much. It cannot tell a finance minister whether her own country’s next field will help or hurt, because that depends on the settlement she is part of, which is Chapter 5’s subject rather than a coefficient.
11. Data sources
- OPEC Annual Statistical Bulletin and World Oil Outlook: production, reserves and refining capacity, on OPEC’s own definitions, with crude reported separately from condensate and natural gas liquids.
- Energy Institute, Statistical Review of World Energy: the independent series against which this chapter’s production ranking is read. Two cautions travel with it. The Review’s oil series is total liquids, crude with condensate and natural gas liquids, so it sits above a crude-only column by construction; and its latest full data workbook is the 2025 edition, which ends in 2024, while the ranking above is for 2025, so the ranking has been read against the prior year rather than its own. On that comparison the 2024 total-liquids readings are Nigeria 1,641, Libya 1,188, Algeria 1,380, Angola 1,181, Egypt 637, the Republic of the Congo 267, Gabon 224 and Chad 128 thousand barrels a day, with no line for Ghana, which the Review keeps inside its Other Africa aggregate; five of the eight sit above the chapter’s crude figure by between 1.9 and 24.8 percent, which is where a total-liquids series should sit (Energy Institute, 2025). The three that do not are movements in the year rather than differences of basis: Libyan output recovered through 2025 from a year of field and terminal closures, Gabonese output rose by about a tenth on the same comparison, and the Chadian gap is a percentage point and a half. Nothing in the ranking is changed on this reading.
- International Energy Agency, Africa Energy Outlook and the scenario framework: demand paths, the access gap and the transition scenarios behind Section 8.
- Global Energy Monitor, oil and gas extraction, gas infrastructure and refinery trackers: the facility-level positions, capacities and statuses behind the chapter’s site list and the Growth Pole Map.
- UN Comtrade: crude against refined product, by partner, for the trade composition this chapter describes but does not tabulate.
- World Bank Global Gas Flaring Tracker: satellite-measured flaring volumes by country.
- National oil companies and regulators, cited by name: NNPC Limited and the Nigerian Upstream Petroleum Regulatory Commission, Sonatrach, Sonangol and the Angolan concessionaire agency, EGPC, GNPC and the Ghana Petroleum Commission.
- Company reports: Dangote Petroleum Refinery, Seplat Energy, TotalEnergies, Eni, Shell and BP (BP, 2025).
- Nigeria Extractive Industries Transparency Initiative and the wider EITI: reconciliation of what companies paid against what governments received, and the crude-theft estimates in Section 2.
- Bank of Ghana and the Ghana Petroleum Funds reports: petroleum receipts and fund balances.
- African Energy Chamber: the industry’s own statement of the right-to-develop case, including its 2024 statement on bank financing.
- IMF Article IV reports: fiscal breakeven prices, the hydrocarbon share of revenue and the debt sustainability analyses behind Section 2’s prepayment discussion.
- Country cards: identity terms, overlays and the data-quality layer only. The cards carry no production and no sector employment; their export fields are the top three SITC lines and UNCTAD’s commodity-dependence share, filled on all fifty-four.
Further reading
- Michael L. Ross, The Oil Curse (2012), for the cross-country case and the fiscal mechanism.
- Todd Moss, Caroline Lambert and Stephanie Majerowicz, Oil to Cash (2015), for the strongest statement of the direct-distribution proposal.
- Pedro C. Vicente, “Does Oil Corrupt?” (2010), for the cleanest natural experiment in the literature.
- Nicholas Shaxson (2007), Poisoned Wells, for the reporting behind the Gulf of Guinea’s political economy.
- The New Regional Economics, chapter 13 (Wilse-Samson, 2026), for gas flares as a measurement problem rather than an environmental one.
12. Exercises
Connections to other chapters
- Chapter 5 (States and Development Bargains) supplies the settlement vocabulary; a petroleum state is the limiting case of an elite that can fund itself without bargaining.
- Chapter 8 (Money: Currency Zones, Central Banks, and PAPSS) makes the argument this chapter’s two-worlds section generalises: a commodity currency is priced off what a country owns rather than what its workers produce.
- Chapter 13 (Critical Minerals) is the same rent problem with a different molecule and a different customer; Chapter 14 (Energy) carries the gas-to-power chain, the offtaker problem and the compute-demand case.
- Chapter 21 (Capital and Sovereign Debt) and Chapter 32 (China in Africa) take up resource-backed lending and the gap between the loan-level databases and the official debt statistics.
- Chapter 24 (Lagos to Abidjan) owns the Nigerian settlement, the subsidy removal and the Dangote Group; Chapter 30 (The Copperbelt and the Lobito and TAZARA Corridors) owns Angola’s oil-collateralised borrowing; Chapter 31 (Where the State Is Thin) owns Brazzaville’s prepayments.
- Chapters 34 and 35 (Climate Finance; Scenarios) carry the stranded-asset question at the level this chapter can only pose it.
Discussion questions
A hydrocarbon boom raises output per worker without raising anyone’s productivity, and a bust lowers it without anyone forgetting anything. Angola’s third term of minus 3.12 percent a year and Equatorial Guinea’s minus 7.07 are the exhibits. Is the identity misleading here, or is it saying something growth accounting usually buries? Then say what you would need to add to the decomposition to separate the price effect from the quantity effect, and whether the cards could supply it.
Refining at home substitutes an import and forgoes an export margin, and does both with a plant that employs very few people. Under what conditions is that a good trade for a producing country, who bears the loss if it is not, and does your answer change if the refinery is privately owned rather than state-owned?
Libya carries a statistical performance score of 34.8, a census from 2006 and a labour-force survey from 2012, and appears in every production ranking on the continent. Argue for one of two positions: that this chapter should report Libya’s identity row with its flag attached, as it does, or that a row whose denominator rests on a twenty-year-old census should not be printed at all. Then say what your rule would do to the chapter’s central claim about term three.
Try it
Open three producers side by side: Nigeria, Angola and Equatorial Guinea, in that order. Read down the identity block first, where the three columns share one scale, then down the overlays, then down the data-quality block. Write one paragraph on a single question: all three are oil economies with negative third terms, and their wage-employment shares are 13.6, 24.1 and 72.7 percent. What is the wage share measuring in each case, and does the highest of the three describe a better labour market or a smaller population? Then open the Growth Pole Map, switch on the oil and gas layer, and turn on the confidence toggle. The layer plots the fields, terminals, refineries and pipeline termini this chapter names. Note which of this chapter’s producing countries vanish under the toggle, and say what a map of African petroleum looks like when it shows only the countries whose numbers can bear it.
Data exercise
Download all fifty-four cards from the country cards page on this site, as cards.csv or cards.json. You cannot select the producers from the cards themselves: balance_sheet.exports_top3 is an empty list on every card and balance_sheet.commodity_dependence is null on every card, so there is no hydrocarbon flag to filter on. Take the chapter’s fourteen as given, and build a table with identity.working_age_pop_growth, identity.employment_to_wa_growth, identity.output_per_worker_growth, identity.gdp_growth_observed, overlays.wage_employment_share, scale.gdp_per_capita, data_quality.spi_overall_score and data_quality.confidence_flag. Reproduce the Nigeria row of Table 12.2 and confirm the three terms sum to within a tenth of observed growth. Compute the median third term for the fourteen and for the other forty and report the difference. Then rank all fifty-four by data_quality.spi_overall_score, count how many of the bottom ten are in the fourteen, and say in two sentences whether that is evidence about oil or about income.
Now take the chapter’s data file on the book site, the production table behind Figure 12.1. Join it to the cards on the ISO3 code and divide each country’s crude production by its working-age population. That ranking is barrels per person of working age, the closest thing this book can construct to a rent-per-worker measure. Compare it with scale.gdp_per_capita and with overlays.wage_employment_share, say which of the two it predicts better, and explain why that is the chapter’s whole argument. Treat nulls as missing, never as zeros, and note that the production figures are crude only.