37. The Investor’s and Policymaker’s Playbook
Twenty-three of the fifty-four country cards carry a line for what their governments owe to bondholders, and between them that line comes to $192.8 billion. A working paper published by the International Monetary Fund argues that African sovereigns pay more for that money than their fundamentals justify (Gbohoui, Ouedraogo and Some, 2023). If the excess is two percentage points, refinancing that stock at the premium costs $3.9 billion a year, about a third of what the African Development Fund raised in its whole seventeenth replenishment. If the excess is half a point, it costs $1.0 billion, which is a rounding error on a continent. The gap between those two sentences is the most consequential unsettled number in African finance, and this chapter is largely about how to think when a number that matters that much cannot be pinned down.
Learning Objectives
After reading this chapter, you should be able to:
- State what the Africa premium is, how it has been estimated, and why two serious papers on overlapping data reach different verdicts on whether it exists.
- Compute what a stated premium is worth in dollars a year on the continental bond stock, and say what that arithmetic assumes.
- Use the identity as a management tool: report the three terms, say which one a government can move, and say what measurement is needed before claiming to have moved it.
- Apply the diagnostic discipline of the pole chapters to a case not in this book: one binding constraint, one falsifiable claim, one date.
- Read the country cards as an investor would, name the fields that are empty, and say what the confidence flag does and does not screen for.
This book has no product to sell, which changes what its last chapter can be. A playbook written by a bank ends with a list of things to buy. A playbook that ends thirty-six chapters of argument about employment has a different job: to say which questions are worth asking, which mistakes are expensive and recurrent, and where the evidence for either is thin enough that a reader should discount the author. Two habits carry into it. The first is the identity, which is arithmetic rather than theory: GDP growth is approximately the growth of output per worker, plus the growth of the employment-to-working-age ratio, plus the growth of the working-age population, and all three are growth rates. The second is the data-quality layer, which Chapter 1 made a layer rather than a caveat, and the exhibit below is what happens when it is turned on a market.
The premium
The claim and the method
Policymakers across the continent have argued for years that their debt is mispriced: that investors charge them for a perception rather than for a risk. Gbohoui, Ouedraogo and Some (2023) is the most careful test of that complaint, and it is careful because it looks in two places.
The first is the primary market. The authors assemble 1,592 international sovereign fixed-coupon bonds issued by 89 countries between 2003 and 2021 from a commercial issuance record, and ask whether an African issuer pays a higher coupon at the moment of sale than a non-African issuer with the same rating, debt, reserves, growth and global conditions. It does. The second is the secondary market, where refinancing costs are actually set; there they use an unbalanced panel of quarterly observations across 107 countries from 1990 to 2022, and find that African sovereigns pay more to refinance as well. Two markets, two designs, one direction.
The subtitle is the interesting half. Having found a gap, the authors go looking for the factors that might close it, and the candidates are structural features on which African countries score badly and which standard specifications omit: the transparency of the budget process, the size of the informal economy, the depth of the financial system, and the quality of public institutions. That is an argument against the strong version of the perception claim as much as for it. If the gap shrinks when you add a measure of budget transparency, part of what looked like prejudice was an omitted variable, and the remedy is a budget office rather than an apology.
The size of the gap is where this book has to be careful. The paper’s direction is not in doubt and its sample is public. Its point estimate is not something this chapter could check to the standard the rest of the book applies to a number with a decimal place in it, so the arithmetic below runs across a band rather than at a point, and the band is this chapter’s construction rather than the paper’s finding.
The counter-case, which is not weak
A second Fund working paper, two years later, covers overlapping ground and reaches a milder conclusion. Alter, Khandelwal, Lemaire, Mighri, Sever and Tucker (2025) examine what drives yields at issuance and secondary-market spreads for Sub-Saharan sovereigns, including the reliability of the ratings themselves, and report limited evidence that the agencies are biased against the region and only a modest extra premium once fundamentals are accounted for, wider in stress than in calm. Global conditions do much of the work, and so do governance and political risk, which are fundamentals rather than perceptions.
Both papers can be right. A premium that is modest in calm and large in a crisis is what a perception premium would look like if perception is what investors fall back on when they stop trusting the numbers, and it is also what a correctly priced risk would look like if African fundamentals are genuinely more fragile to a global shock. Nothing in the cross-section separates those readings, which is the honest state of the argument.
The institutional response runs ahead of the evidence in both directions. As of 2024 only Botswana and Mauritius held an investment-grade rating, which makes African sovereign debt uninvestable by mandate rather than by judgement for most of the world’s largest pools of capital (OECD, 2025). The African Union’s answer is the African Credit Rating Agency, not owned by African governments, based in Mauritius, intended to rate mainly local-currency debt, and launched on 7 October 2026 (Motsoeneng and Adegoke, 2026; Ojoko, 2026). Chapter 21 gives the standing objection, that a rating is worth what the people who do not pay for it believe. The narrower and better case for it is a measurement case: if part of the premium is missing information, an institution whose business is producing that information has something to sell whether or not anyone treats its letter grades as a substitute for the incumbents’.
The exhibit
Set the claim against what African sovereigns actually paid in the two years the market reopened.
| Sovereign | Priced | Amount ($bn) | Coupon (percent) | External debt, percent of output | Statistical score | Confidence |
|---|---|---|---|---|---|---|
| Côte d’Ivoire | Jan 2024 | 1.10 | 7.625 | 41.0 | 70.2 | medium |
| Côte d’Ivoire | Jan 2024 | 1.50 | 8.250 | 41.0 | 70.2 | medium |
| Benin | Feb 2024 | 0.75 | 7.960 | 58.1 | 71.0 | high |
| Kenya | Feb 2024 | 1.50 | 10.375 | 31.4 | 73.4 | high |
| Senegal | Jun 2024 | 0.75 | 7.750 | 127.0 | 81.4 | high |
| Cameroon | Jul 2024 | 0.55 | 10.750 | 26.6 | 66.0 | low |
| South Africa | Nov 2024 | 2.00 | 7.100 | 41.2 | 81.3 | high |
| South Africa | Nov 2024 | 1.50 | 7.950 | 41.2 | 81.3 | high |
| Nigeria | Dec 2024 | 1.50 | 10.375 | 37.4 | 69.1 | low |
| Benin | Jan 2025 | 0.50 | 8.375 | 58.1 | 71.0 | high |
| Angola | Jul 2025 | 1.50 | 9.500 | 41.4 | 58.2 | medium |
Table 37.1. Every dollar-denominated African sovereign tranche of 2024 and 2025 whose coupon could be sourced: eleven tranches by eight sovereigns. The debt ratio is the external debt stock over output; the statistical score is the World Bank’s overall Statistical Performance Indicator; the confidence flag is this book’s own rule, combining census vintage, that score and labour-survey recency. Kenya’s and Angola’s figures are yields at pricing rather than coupons (Kenya’s coupon was 9.75 percent), and Nigeria’s December 2024 sale of $2.2 billion carried two tranches, $700 million at 9.625 percent and $1.5 billion at 10.375 percent, of which the longer is shown. Tenors differ across the eleven and a single cross-section cannot hold them constant. Sources: World Bank International Debt Statistics, 2025 release, and the IMF World Economic Outlook, April 2026, via the country cards, with the World Bank’s Statistical Performance Indicators; market reporting of each transaction for the coupons and amounts, which no continental series publishes.
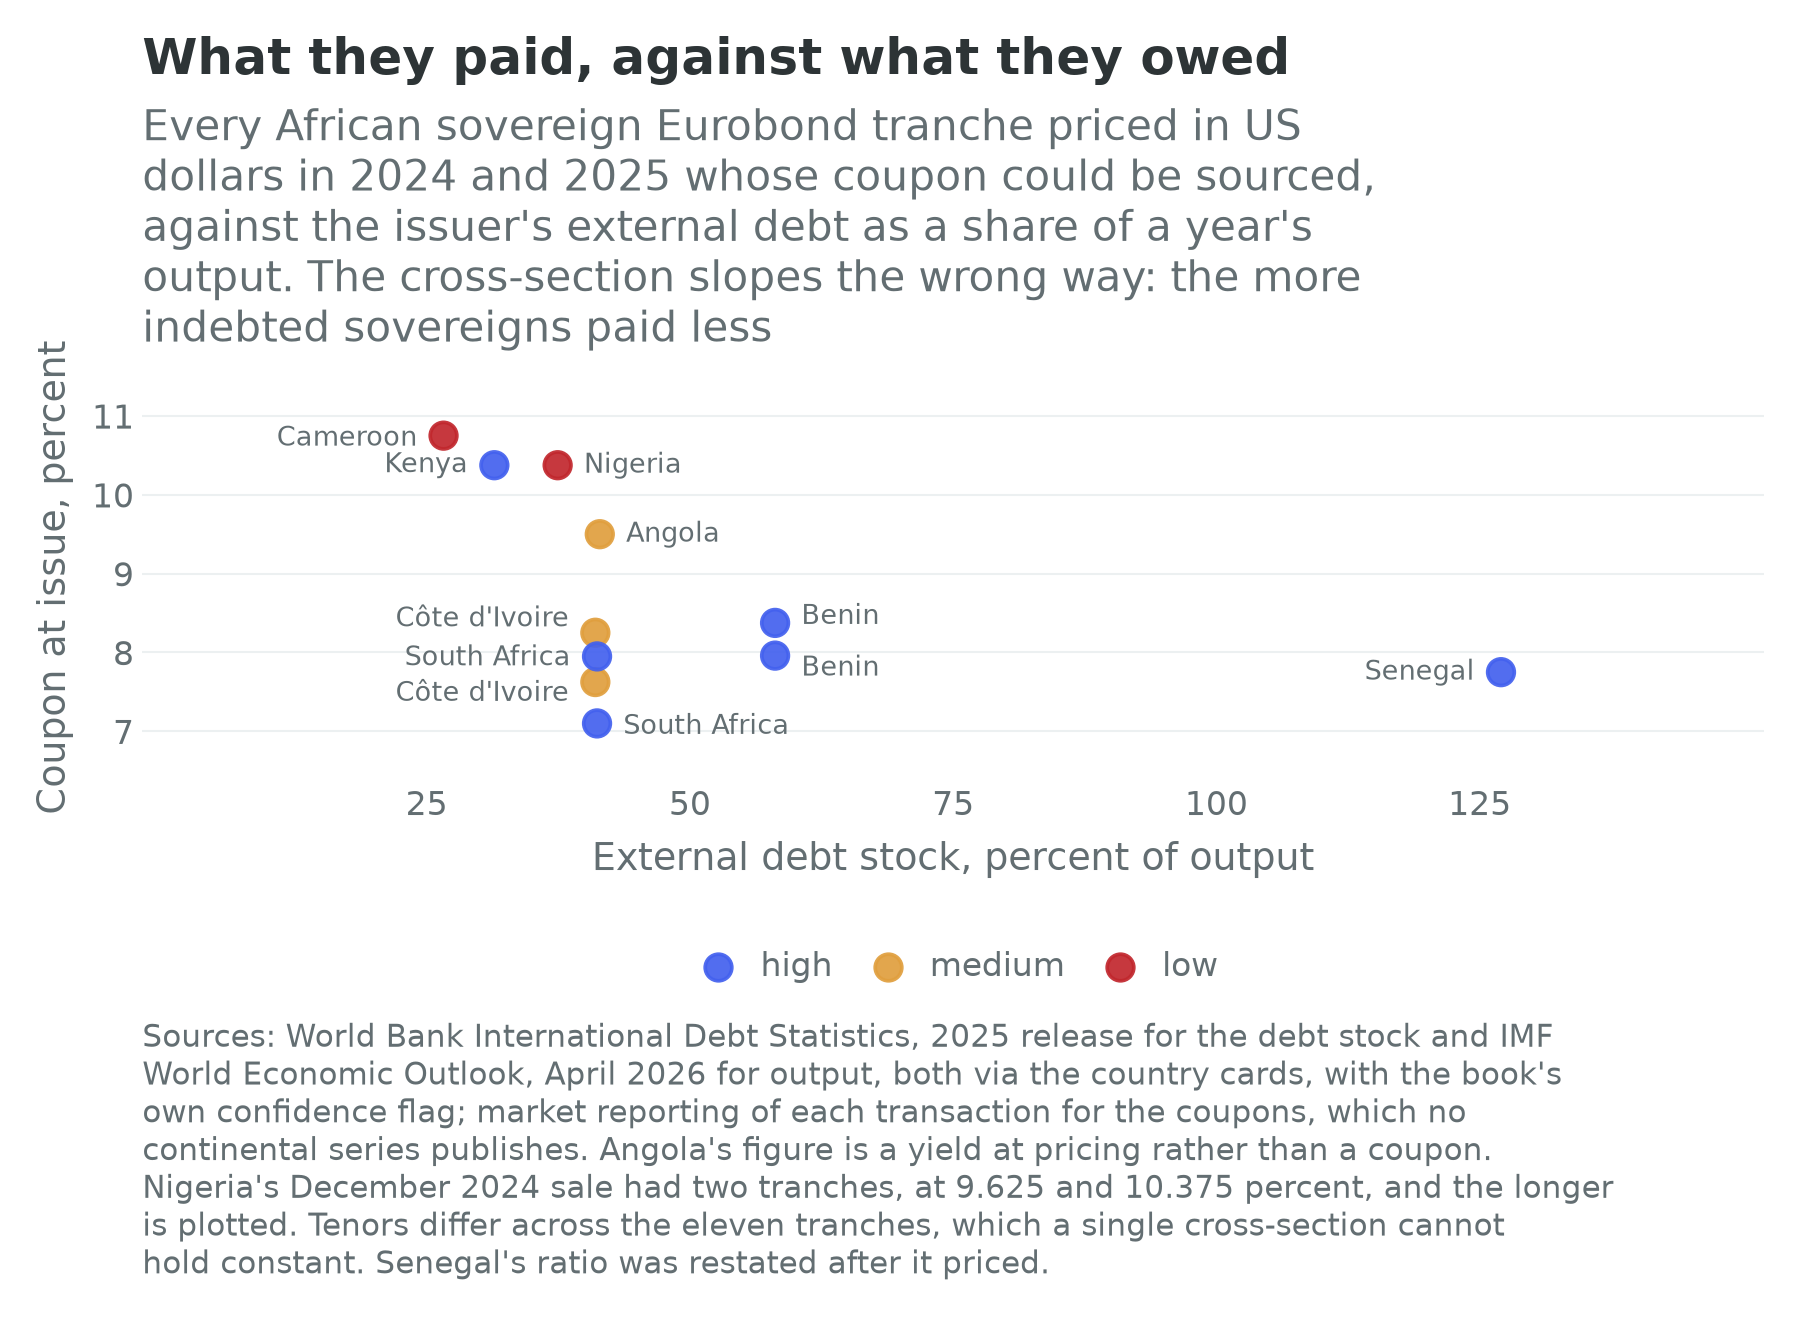
The cross-section slopes the wrong way. Across the eleven tranches the coupon correlates with external debt as a share of output at minus 0.44, and dropping Senegal, whose ratio was restated after it priced, makes the relationship more negative rather than less, at minus 0.60. Senegal borrowed at 7.75 percent owing 127.0 percent of a year’s output; Cameroon borrowed at 10.75 percent owing 26.6 percent. Whatever the market was pricing, the ratio that dominates every public discussion of African debt was not it.
What the coupons do track is the quality of the issuer’s own statistics. The median coupon paid by sovereigns whose cards carry a high confidence flag was 7.96 percent, by the medium ones 8.25, and by the low ones 10.56; across the eleven tranches the coupon correlates with the statistical performance score at minus 0.58. Better statistics, cheaper money.
Three caveats, and they are heavy. Eight sovereigns is not a sample, and two of them carry the low flag. Tenors differ, and a sixteen-year bond is not a seven-year bond. And the statistical score correlates with income per head across these rows at plus 0.47, so it may be income wearing a different coat. The exhibit is a suggestion, not a test. What makes it worth printing is that the suggestion is the one Chapter 1 predicted: a market that cannot see a country’s numbers prices the fog, and the fog is measurable. Jerven (2013) argued that African statistics are manufactured under constraints outsiders do not see. This is what those constraints might cost, in basis points.
What it is worth
The arithmetic is deliberately simple, because the assumptions are where the argument is. Refinancing the $192.8 billion bond line at a premium of 50 basis points costs $1.0 billion a year; at 100, $1.9 billion; at 200, $3.9 billion; at 300, $5.8 billion.
Four things that arithmetic assumes. The bond line is the debt statistics’ bondholder category rather than a count of outstanding Eurobonds, and the card field that would carry the face value is empty on all fifty-four, because the one register that names every African issue covers all fifty-four and licenses its data for non-commercial use only. The existing stock was sold at the coupons of its own decade, so this is the cost of refinancing rather than a bill anyone pays today. It applies the premium to the whole stock when the papers estimate it at the margin. And it treats the premium as a pure transfer, when part of any spread compensates for a risk that sometimes materialises.
Hold all four and the number still gives the order of magnitude of the stake. At the sceptics’ end it is $1.0 billion a year. At the other it is $5.8 billion, roughly a fifth of all bilateral aid to Sub-Saharan Africa in 2025 (OECD, 2026), obtained by nobody doing anything except believing different things about the same countries. Both ends are worth knowing, and only one justifies a diplomatic campaign.
For the policymaker
Report all three terms. A government that reports GDP growth reports a sum, and a sum conceals which of its parts moved. Ethiopia grew at 7.92 percent a year over the decade to 2024 with the highest output-per-worker growth on the continent and the largest fall in its employment ratio. That is a specific achievement and a specific failure, and the headline contains neither. Two rules follow. Term one is demography, not policy, and is given for thirty years. And Chapter 10’s rule, the one most often broken: measure the labour market before claiming to have moved it. Thirty-four of the fifty-four countries have run a labour-force survey within five years. A minister in one of the other twenty who announces that a programme created jobs is announcing a model output.
One constraint, one claim, one date. Every pole chapter runs the same discipline, in the form Hausmann, Rodrik and Velasco (2005) gave it: name the branch that binds, name the branches set aside, name the observation that would show you wrong. Chapter 24 predicts that a large infrastructure improvement on the West African coast should raise private investment in tradable production rather than in construction and property. Chapter 28 predicts the opposite sign for Morocco, that the next megaprojects will raise measured investment without moving the employment ratio. Chapter 29 says to watch Ethiopia’s manufactured-export line and nothing else. The discipline is cheap and almost never applied. A strategy listing twelve priorities has diagnosed nothing, because a diagnosis is a ranking; a diagnosis no future observation could overturn is a preference; and a constraint named without a horizon can be defended indefinitely.
Ask the settlement question, and apply the one test a state cannot fake. Chapter 5 supplies the question that decides whether any of this will be attempted: has the elite bet on growth, or on dividing what exists (Dercon, 2022)? Khan (2010) makes the same point structurally, that a written rule holds only where it fits the distribution of organisational power. Its use is diagnostic rather than hortatory: an observer cannot make an elite strike a bargain, but can notice whether a government has done something costly to a constituency it needs. Chapter 9 then supplies the one policy test a state cannot administer to itself, which is support conditional on selling abroad, because a foreign buyer cannot be lobbied. Chapter 9’s verdict is harder than its advocates’: the two African programmes that have run export discipline longest, Morocco’s automotive cluster and South Africa’s, both raised the third term and neither moved the second, posting employment-ratio growth of minus 0.45 percent a year apiece. Export discipline is the best available industrial-policy test and it is a productivity instrument. A continent adding twenty-seven million people of working age a year needs a second one.
Buy the measurement first. Eleven of the fifty-three countries with a recorded census year last counted before 2010. The Democratic Republic of the Congo’s last scientific census was in 1984 and Nigeria’s in 2006. A census, a labour-force survey and a rebased national accounts series cost little and are repeatedly deferred. The case for them used to rest on good governance, which is a weak argument in a budget meeting. The exhibit above suggests a stronger one: if any part of the relationship between statistical quality and the coupon is causal, a statistical office is the only line item in a finance ministry whose return can be quoted in basis points. That is not established. It is testable, which is more than can be said for most of what is argued here.
Know the transfer arithmetic before promising anything. Chapter 23 prices the instrument every conversation about African social protection reaches. A dollar a day to every person of working age costs, in a typical African country, about what that country collects in tax; in South Africa, whose tax effort is well above the continental average, it costs 3.7 percent of output, which is why South Africa does it and almost nobody else does. The constraint is the base rather than the will: a continent whose median informality rate is 89.1 percent has almost no payroll to tax. The most promising financing source is converting universal price subsidies into targeted transfers, and it is also the reform most likely to end a government.
Hedge across the two worlds. Chapter 1 asked the reader to hold two futures at once, one in which the marginal worker still matters and one in which the frontier of production is compute, energy and capital and labour enters as a complement at best (Acemoglu and Restrepo, 2019). A policymaker cannot choose between them and does not have to, because some assets pay in both. The grid does, because a factory needs power and so does a data centre, and Chapter 14 argues that the wire rather than the generator is the African constraint. The port does, because ore and containers cross the same quay (Chapter 19). The land register does, because an unenforceable claim is not an asset in any technological regime (Chapter 22). And so does the school that teaches a child to read, because Chapter 20 shows the African schooling problem is learning rather than enrolment, and literacy is the input to everything a person might later do, including operating the machine that replaced the job. None of these is exciting. All of them are what a state should build when it does not know which century it is in.
And six things not to do. The stadium: Chapter 5 explains why a settlement that distributes rents through contracts prefers projects that are large, visible and awardable over maintenance, extension services and the rules under which a firm hires its fifth employee, and Chapter 28 sets Morocco’s tournament programme beside its earthquake reconstruction. The new capital: Chapter 22 reads the crop of new African cities as land plays rather than urban planning, since you cannot assemble a hundred hectares inside a built-up area without settling ten thousand claims and can assemble ten thousand hectares of scrub outside it with one; Chapter 27 gives the largest instance, planned for as many as 6.5 million residents and holding on the order of a thousand resident families in 2026. The export ban without a processor: a raw-export ban is a tax on farmers paid to processors and works only if the processors improve fast enough to pay it back (Chapter 11), and Chapter 13 adds the conditions Indonesia had and most African cases do not. The fuel subsidy: it accrues in proportion to fuel consumed, which is to say to how many vehicles a household owns, and Chapters 12, 23 and 24 carry the arithmetic and the politics. The power contract negotiated bilaterally: Chapter 14 sets Kenya’s experience, in which the distributor paid independent producers about 60 percent of its power-purchase costs for 41 percent of the electricity it sold, against South Africa’s auction with a standard contract and a published schedule, which drove tariffs to among the lowest in the world. Borrowing at ten percent to refinance rather than to build: Chapter 21 reads the 2024 and 2025 window as a wall refinanced rather than repaid, at coupons roughly double those retired, and whether that was worth it depends entirely on what the original money bought.
For the investor
What the cards show, and what they do not. The country cards are a screening instrument honest about its own holes, which is unusual enough to be their main feature. The balance-sheet block carries an external debt stock on 50 cards and six creditor lines beneath it. It carries a remittance line on 48 of the 54 and a foreign-investment and an aid line on all of them. It carries what a creditor most wants: $389.5 billion of publicly guaranteed debt service falling due between 2026 and 2030 across the fifty that report, a Paris Club line on those fifty and a China line on 46, and a restructuring status on 53. Read the creditor lines the way Chapter 21 sets out: the multilateral, bilateral and private lines are a partition of guaranteed debt, and the Paris Club and China lines cut the same total by the creditor’s country and cross all three, so adding all six gives a number larger than the debt. It carries a collateralisation note on eleven cards and nothing on the other forty-three, where nothing means unrecorded and not none. And it carries no Eurobond face value and no sovereign rating on any of the fifty-four: the first because the one register covering all fifty-four forbids commercial use, the second because ratings are proprietary. Use the confidence flag as a first filter and know what it filters: across the fifty-four it reads 11 high, 20 medium, 20 low and 3 not computable. It is not a credit opinion, it correlates with income, and it is the field most likely to change your mind about a claim somebody else has made. The whole set of cards, with the release each number came from travelling beside it, can be downloaded from the country cards page on this site, which is where any investor should start and is the only asset list this book offers.
The premium is an opportunity and a warning. If the strong version of the claim is right, African sovereign paper is systematically cheap and buying it is the trade the argument implies. Two disciplines belong beside that thought. Cruces and Trebesch (2013) found across 180 restructurings that larger haircuts were followed by higher spreads and longer exclusion, so the premium and the recovery risk are not independent. And a premium arising from missing information disappears when the information arrives, so the investor who profits from it is the one who did the work the market had not. The warning runs the other way, and Senegal is the case: a government audited its predecessor, published, and moved its own debt ratio from 74.4 percent of output to well over a hundred in a single document, in the best-scored statistical system on the continent, at 81.4, with a census in 2023 and a survey in 2024. A good office is what finds hidden debt, not what prevents it, and a portfolio built on reported numbers is exposed to the arrival of better ones.
Very little capital reaches a firm hiring a worker. Chapter 16 traces where the money that exists goes: the pension funds, the largest domestic long-term pools, are pointed by prudential rule at the same government paper the banks are buying, so the continent’s savings finance its deficits rather than its factories, and for anything long-dated the marginal lender is a development-finance institution rather than a market. The investable implication is that the missing instrument is a rated, sized, tradeable claim on an African infrastructure asset, because a pension fund cannot buy a project and can buy a bond. The catch is that manufacturing one is mostly legal and regulatory work in the borrower’s own jurisdiction, which is not what capital is usually looking for when it says it wants African exposure.
Where the third term is being built. Part III runs the identity through nine sectors and the answers differ sharply. The extractive three are the clearest and least encouraging: oil and gas is among the largest contributors to African export earnings and among the smallest to African employment, which is the same fact, because the money arrives as rent on a licence rather than as wages (Chapter 12); mining raises output per worker sharply and employs almost nobody, while artisanal work employs very large numbers and raises nothing (Chapter 13); electricity is an input rather than a sector, and the multiplier on everything else, which is why it binds most often in the pole chapters (Chapter 14). The producing three are where the thesis lives: agriculture employs the largest share of the workforce at the lowest output per worker, and its claim on term two runs through rural wage labour rather than smallholder yields (Chapter 11); manufacturing is the one sector supposed to move terms two and three together and in African data has mostly moved the third (Chapter 15); trade and logistics sells other people’s costs (Chapter 19). The service three are ambiguous: finance moves the second term barely and the third through a narrow channel (Chapter 16); telecoms touches term two only through other people’s businesses and is also building the second world’s plumbing (Chapter 17); tourism has the strongest direct claim on the employment ratio of any sector in Part III, because a meal served in Zanzibar is cooked in Zanzibar, and the claim is seasonal (Chapter 18).
The portfolio question, and the ethics of it. In the labour-redundant world the assets that hold value are the ones the machines need: the electrons, the copper, the cobalt, the land and the sun. Those assets are in Africa, they are investable today, and almost none of them employs anybody at scale. In the labour-abundant world the asset is the factory that hires, the corridor that lets it export and the school that supplies it, and each depends on a state doing something difficult first. A book that has spent thirty-six chapters on employment cannot end by recommending the assets that need no workers without saying so. The recommendation to own the mine and the solar farm is not wrong on its own terms; it is the trade that pays if the second world arrives, and it is a bet against this book’s title. Chapter 13’s finding belongs beside it: the Democratic Republic of the Congo supplies about 73 percent of the world’s mined cobalt and records $871 of output per head. Holding the chokepoint has not made the country holding it rich. An investor is entitled to own the electrons. An investor who owns the electrons and calls the position African development has misdescribed it.
What would settle it
A book making arguments about a century owes the reader a list of things that would show it wrong, with dates.
| What to watch | By | Set in | What each outcome would mean |
|---|---|---|---|
| Private investment in tradables on the Abidjan to Lagos corridor, after the refinery, the deep-water port and the transshipment terminal | 2035 | Ch. 24 | A jump confirms the infrastructure diagnosis; movement only in construction and property confirms the consumption-city reading, and the book’s largest pole is not a growth pole |
| Grid availability and freight volumes in Gauteng | 2031 | Ch. 25 | Whether a state can recover two technical networks it built itself, in the continent’s most developed economy |
| Private credit as a share of Kenyan bank lending, against interest as a share of ordinary revenue | 2030 | Ch. 26 | Whether a sovereign that took over its own credit market can give it back without a crisis |
| Egypt’s private share of total investment holding above half | 2030 | Ch. 27 | Sustained, appropriability rather than infrastructure was binding; reversed, the natural experiment was a currency move in disguise |
| Morocco’s employment-to-working-age ratio after the tournament build-out and the new ports | 2035 | Ch. 28 | If it turns, the infrastructure branch bound after all and Chapter 9’s productivity-without-jobs finding is a phase; if not, that finding stands |
| Ethiopia’s manufactured exports, separated from gold and coffee | 2030 | Ch. 29 | Whether floating a currency buys a manufacturing response or a commodity windfall |
| Cost per tonne on the Lobito corridor, then volume, then the Copperbelt’s employment ratio | 2035 | Ch. 30 | Rising volumes with a flat second term would confirm that the fiscal and ownership regime binds the income, not the transport |
| Investment in the eastern Congo and in Burundi where security and administration are restored | 2035 | Ch. 31 | Whether the state’s capacity to observe and collect is the variable, or whether geography and history are |
| The employment-to-working-age ratio in the fourteen countries whose working-age population grows above 3 percent while that ratio falls | 2035 | Ch. 10 | The book’s central term. Flat through another decade and the century is a distribution problem rather than a growth one |
| Whether Nigeria, Ethiopia and the Democratic Republic of the Congo run a census | 2030 | Ch. 1 | Whether the numbers this book rests on get better, and whether the largest populations can be measured at all |
| The spread African sovereigns pay against comparably rated peers as statistical systems improve, and whether anyone outside the continent prices the new agency’s ratings | 2030 | Ch. 21 and 37 | Whether the premium was perception, measurement, or correctly priced risk |
| Wage employment in the business-process centres of Nairobi, Accra and Lagos | 2030 | Ch. 17 | The first place in African data where the labour-redundant world would show, because those are the jobs a machine that answers calls does first |
Table 37.2. The twelve tests this manuscript set itself. The dates are the book’s own and are the earliest year at which a reader could reasonably look, not the year an answer is guaranteed. Sources: the chapters named, each of which states its test in its own diagnostic section.
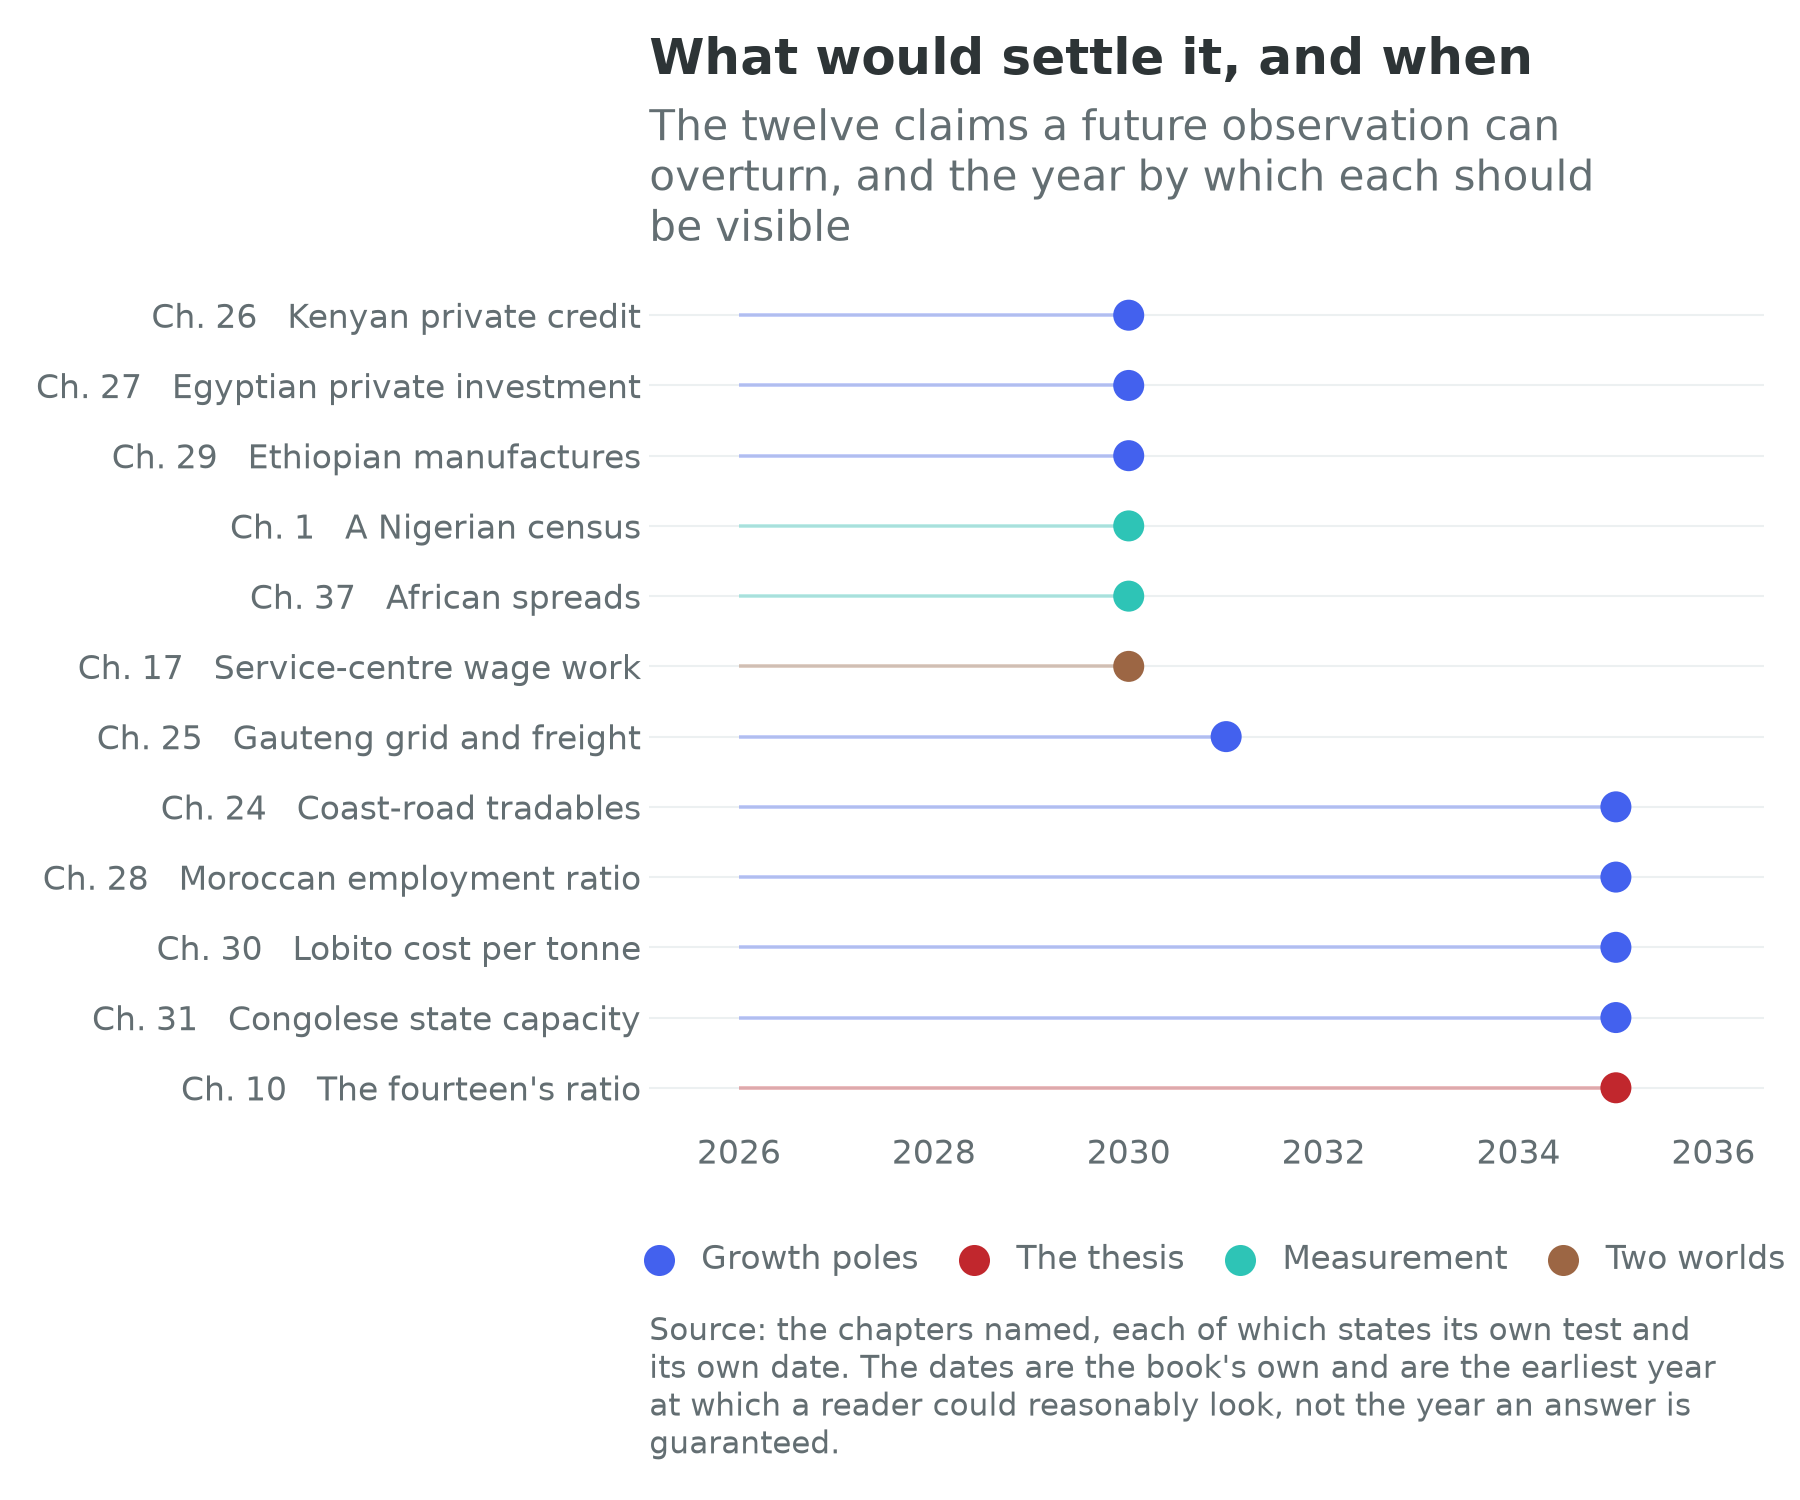
Two things about the list. It is short, which is the point: a book that could be overturned in twelve places is more useful than one that could be overturned nowhere. And it is unbalanced, with eight of the twelve set in Part VI, because the pole chapters were written under a discipline the rest of the book applies less consistently. That is a fair criticism of the book by the book, and the remedy belongs to the reader, which is to hold the other chapters to the same standard.
A playbook in two worlds
The awkward truth about a playbook written at this moment is that its subject may be conditional. Chapter 1 stated the assumption everything rests on, that the marginal worker still matters, and refused to choose between the world in which it holds and the world in which the frontier of production stops needing hands. That refusal was not evasion; it was the only defensible position for a book about seventy-five years. But it leaves a policymaker holding two lists and no way to know which one she is in.
One recommendation survives the uncertainty, and it is the same in both worlds because it is not about production at all. It is to build the capacity of the state to see, count and enforce: the census, the survey, the register, the audit court, the customs post that records what crossed. In the labour-abundant world that capacity is the precondition for everything else in this chapter, because a state that cannot measure its labour market cannot manage it, and Chapter 5’s whole argument is that a settlement is enforced by what a state can observe. In the labour-redundant world it matters more rather than less, because the question shifts from producing income to distributing it, and a transfer system is nothing but a list of people and a way of paying them. Senegal’s audit court found a hidden deficit; the countries whose numbers this book could not use are the countries whose citizens have the least standing to argue with their own governments. That is not a technocratic recommendation. It is the political one, wearing a technocrat’s coat.
Which leaves the bet, and it should be restated the way it was made. This book is not a forecast that Africa will be rich, and it has spent thirty-six chapters conceding what can be conceded: that growth arrived without jobs for twenty-five years, that the manufacturing ladder has lost its lower rungs, that the balance sheet binds on exactly the investments the optimistic case requires, that the dividend is conditional and in places has not begun, and that the statistical apparatus underneath all of it would not survive scrutiny in any other region. Every one of those objections is in the text because a hopeful book that has not already conceded them is not worth reading.
What survives the concessions is the arithmetic. Two of every three people joining the human race over the next three decades will be born in one of these fifty-four countries, and most of the people who will be working in Africa in 2054 have already been born. Nothing in the counter-case touches that, because it is not a forecast about policy; it is a statement about who is alive. The bet is that the world will still want what those people can do, and it is a bet rather than a prediction, which is why the last table in this book is a list of ways to find out that the author was wrong.
And if the bet loses, it will not lose quietly or only in Africa. A world that no longer needs the marginal worker has not solved a problem; it has moved one, from the countries that could not create enough jobs to the countries that no longer have to. The question this book has put to fifty-four governments, which is what a person is for when output no longer requires her, is on its way to the rest of us. Africa will simply have been asked first, as it usually is, and it will have been asked while holding the youngest population, the thinnest statistics and the smallest fiscal instruments with which to answer. That is the strongest argument for taking the century seriously, and it does not require the optimistic case to be right.
Connections to Other Chapters
- Chapter 1 (Africa in Numbers) states the identity, the data-quality layer this chapter turns on a bond market, and the two worlds its last section returns to.
- Chapter 10 (Labor, Youth, and Migration) carries the jobs thesis and the survey rule this chapter asks policymakers to adopt, and its fourteen countries are the ninth row of Table 37.2.
- Chapter 21 (Capital and Sovereign Debt) owns everything about African borrowing except the premium, which it cites forward to here.
- Chapter 9 (The Studwell Recipe Applied) supplies the export test, the one instrument a state cannot administer to itself, and the finding that it buys productivity rather than jobs.
- Chapter 16 (Finance and Fintech) traces where African savings actually go, which is the constraint on every investable proposition here.
- Chapters 24 to 31 (the growth poles) set eight of the twelve tests in Table 37.2 and supply the diagnostic discipline the policymaker section recommends.
- See also: Chapter 19, Section 11, on why a continental priority list is not yet an investable claim, and the UNGA Week 2026 field notes that prompted that stitch. The missing rated infrastructure claim this chapter names is the same gap: pension money sits on government paper because the cross-border asset is not yet a security a mandate can hold.
Discussion Questions
Table 37.1 shows coupons correlating negatively with debt-to-output and negatively with the quality of the issuer’s statistics. Give three explanations for the second correlation: one in which better statistics cause cheaper borrowing, one in which both are caused by something else, and one in which the pattern is an artefact of eight countries. Then say what evidence available before 2030 would distinguish them, and whether a finance minister should spend on a statistical office before that evidence exists.
The dollar arithmetic here applies a premium to the whole bond stock when the papers estimate it at the margin, and uses a debt-statistics category as a proxy for outstanding Eurobonds. Redo the calculation with assumptions you can defend, state what you changed, and say at what premium the answer becomes large enough to justify the diplomatic effort African governments have put into the argument.
This chapter claims that state capacity to see, count and enforce is the one recommendation holding in both worlds. Construct the strongest case against it: name a plausible world in which investment in measurement is wasted or actively harmful, say who is harmed, and decide whether the objection changes the recommendation or only its justification.
Try It
Open the identity scoreboard and the Sovereign Debt Tracker side by side, and take the eight sovereigns of Table 37.1 in the order they issued. For each, read the three identity terms on the scoreboard and the creditor breakdown on the tracker, noting that the China line inside the breakdown is drawn as a blank rather than a zero. Then open the Convergence Calculator and give each of the eight the output-per-worker growth its scoreboard row records, held to 2050. Write one paragraph on a single question: for which of the eight does the coupon it paid look like a reasonable price for the growth its own identity terms imply, and for which does it look like a price for something else? Name the something else, and say whether it is on the cards.
Then open Balance-Sheet Africa and take the eight sovereigns of Table 37.1 one at a time, in percent-of-output units. For each, read the bond line where the page draws it, inside the private bar and never beside it, against the five-year service bar below, and against the three flow lines that arrived this year, each at its own year. Then look at what the page refuses to draw: there is no ribbon from a source to a use anywhere on it, because no card field says which dollar paid for which. Write one paragraph on the question the premium argument turns on: for which of the eight would a hundred basis points off the coupon be worth less than a single year of the remittances already arriving, and what does that comparison say about where a finance minister’s attention belongs?
Data Exercise
Download all fifty-four cards from the country cards page on this site, as cards.csv or as cards.json. Build a table with balance_sheet.external_debt_by_creditor.eurobond, balance_sheet.external_debt_stock, scale.gdp_usd, scale.gdp_per_capita, data_quality.spi_overall_score and data_quality.confidence_flag. Then do four things. First, sum the bond line across the cards that carry it, confirm the $192.8 billion this chapter prices, compute the annual excess at 50, 100, 200 and 300 basis points, and say which of the four you would put in front of a finance minister. Second, compare the median of external_debt_stock over gdp_usd for the cards carrying a bond line against those not carrying one, and say whether the difference is evidence that market access follows indebtedness or the reverse. Third, rank the eight sovereigns of Table 37.1 by spi_overall_score and by their coupons, and say how much of the rank correlation you would attribute to gdp_per_capita. Fourth, count how many of the 23 cards with a bond line carry each value of confidence_flag, and write two sentences on what it means that the group with market access is better measured than the continent as a whole. Then add balance_sheet.debt_service_2026_2030 to the table and ask the question this chapter cannot: rank the cards by five-year service over output, and see whether the eight above a fifth of output are the eight you would have named from the bond line alone. Note which fields are null rather than zero: eurobond_outstanding and sovereign_ratings.sp are empty on all fifty-four, collateralized_or_resource_backed is blank on forty-three where blank means unrecorded, and imputing any as a zero would produce a total that is exactly wrong.
Data Sources and Further Reading
Key data sources
- The country cards, whose balance-sheet block supplies the bond line and the external debt stock and whose data-quality block supplies the statistical score and the confidence flag in Table 37.1 and Figure 37.1.
- World Bank International Debt Statistics, 2025 release, for the debt stock and its creditor composition; IMF World Economic Outlook, April 2026, for output; World Bank Statistical Performance Indicators for the statistical score.
- Market reporting of individual sovereign transactions for every coupon, amount and pricing date in Table 37.1. No continental series of African sovereign issuance terms is published in a form a reader can check, which is why those figures carry a claim-register row each rather than a card field.
- OECD for the ratings and local-currency material and the 2025 aid decline; the African Union for the credit-rating agency.
Further reading
- William Gbohoui, Rasmané Ouedraogo and Yirbehogre Modeste Some, “Sub-Saharan Africa’s Risk Perception Premium” (2023), for the claim, and Adrian Alter and co-authors (2025) for the milder verdict on the same question.
- Gregory Smith (2021), Where Credit Is Due, for how African sovereigns actually borrow, from somebody who sat on the other side of the trade.
- Morten Jerven, Poor Numbers (2013), for why the statistical layer in this chapter’s exhibit is not a technicality.
- Stefan Dercon, Gambling on Development (2022), and Mushtaq Khan (2010), for the settlement question that decides whether the policymaker’s list is attempted at all.
- Ricardo Hausmann, Dani Rodrik and Andrés Velasco, “Growth Diagnostics” (2005), for the discipline the pole chapters run and this chapter recommends.