3. The Long Arc
Learning Objectives
After reading this chapter, you should be able to:
- Place the episodes the rest of this book treats as background on one timeline, from the precolonial commercial economies through the slave trades, colonial extraction, independence, adjustment and the 2000s boom to the 2020s reset, and say what each contributes to the argument that follows.
- State what the persistence literature does and does not establish, using pre-colonial centralization, colonial railways and the reversal-of-fortune thesis, and explain Austin’s objection that a long history has been compressed into a single variable.
- Use the growth-syndrome typology to describe the record from 1960 to 2000 without collapsing it into one story of failure, and assign a syndrome to a given country-decade.
- Explain what structural adjustment was trying to fix, what it did fix, and why the African critique of it is about state capacity rather than relative prices.
- Say what the 2000s boom was made of, why the 2020s reset is not simply its reversal, and which later chapters carry each argument.
Prior work: the institutions-and-persistence literature, and the nightlights machinery much of it now runs on, are developed at length in the companion volume, The New Regional Economics, chapters 2 and 13 (Wilse-Samson, 2026). This chapter cites them rather than repeating them.
In 1960 the territory this book calls Africa held 283.9 million people (WPP, 2024). In 2100, on the projection the book treats as central, it will hold 3.814 billion, thirteen and a half times as many, and 37.5 percent of everyone alive. Between those two dates lies a compound growth rate of 2.65 percent a year in the number of Africans, sustained for the sixty-four years to 2024 already and projected to continue, in slowing form, for most of another century.
The year 1960 is not an arbitrary starting line. Seventeen of the 54 states in this book became sovereign during those twelve months, which is why the year has a name. Those seventeen hold 611 million people today, 40.4 percent of the continent’s population, and produce about $800 billion, a quarter of its output. They began at the same instant, with borders drawn by the same handful of European capitals, and they have arrived in wildly different places: output per head within that one cohort runs from $579 in the Central African Republic to $9,376 in Gabon, a spread of about sixteen to one. Whatever the long run did to Africa, it did not do it uniformly, and it did not do it through the calendar.
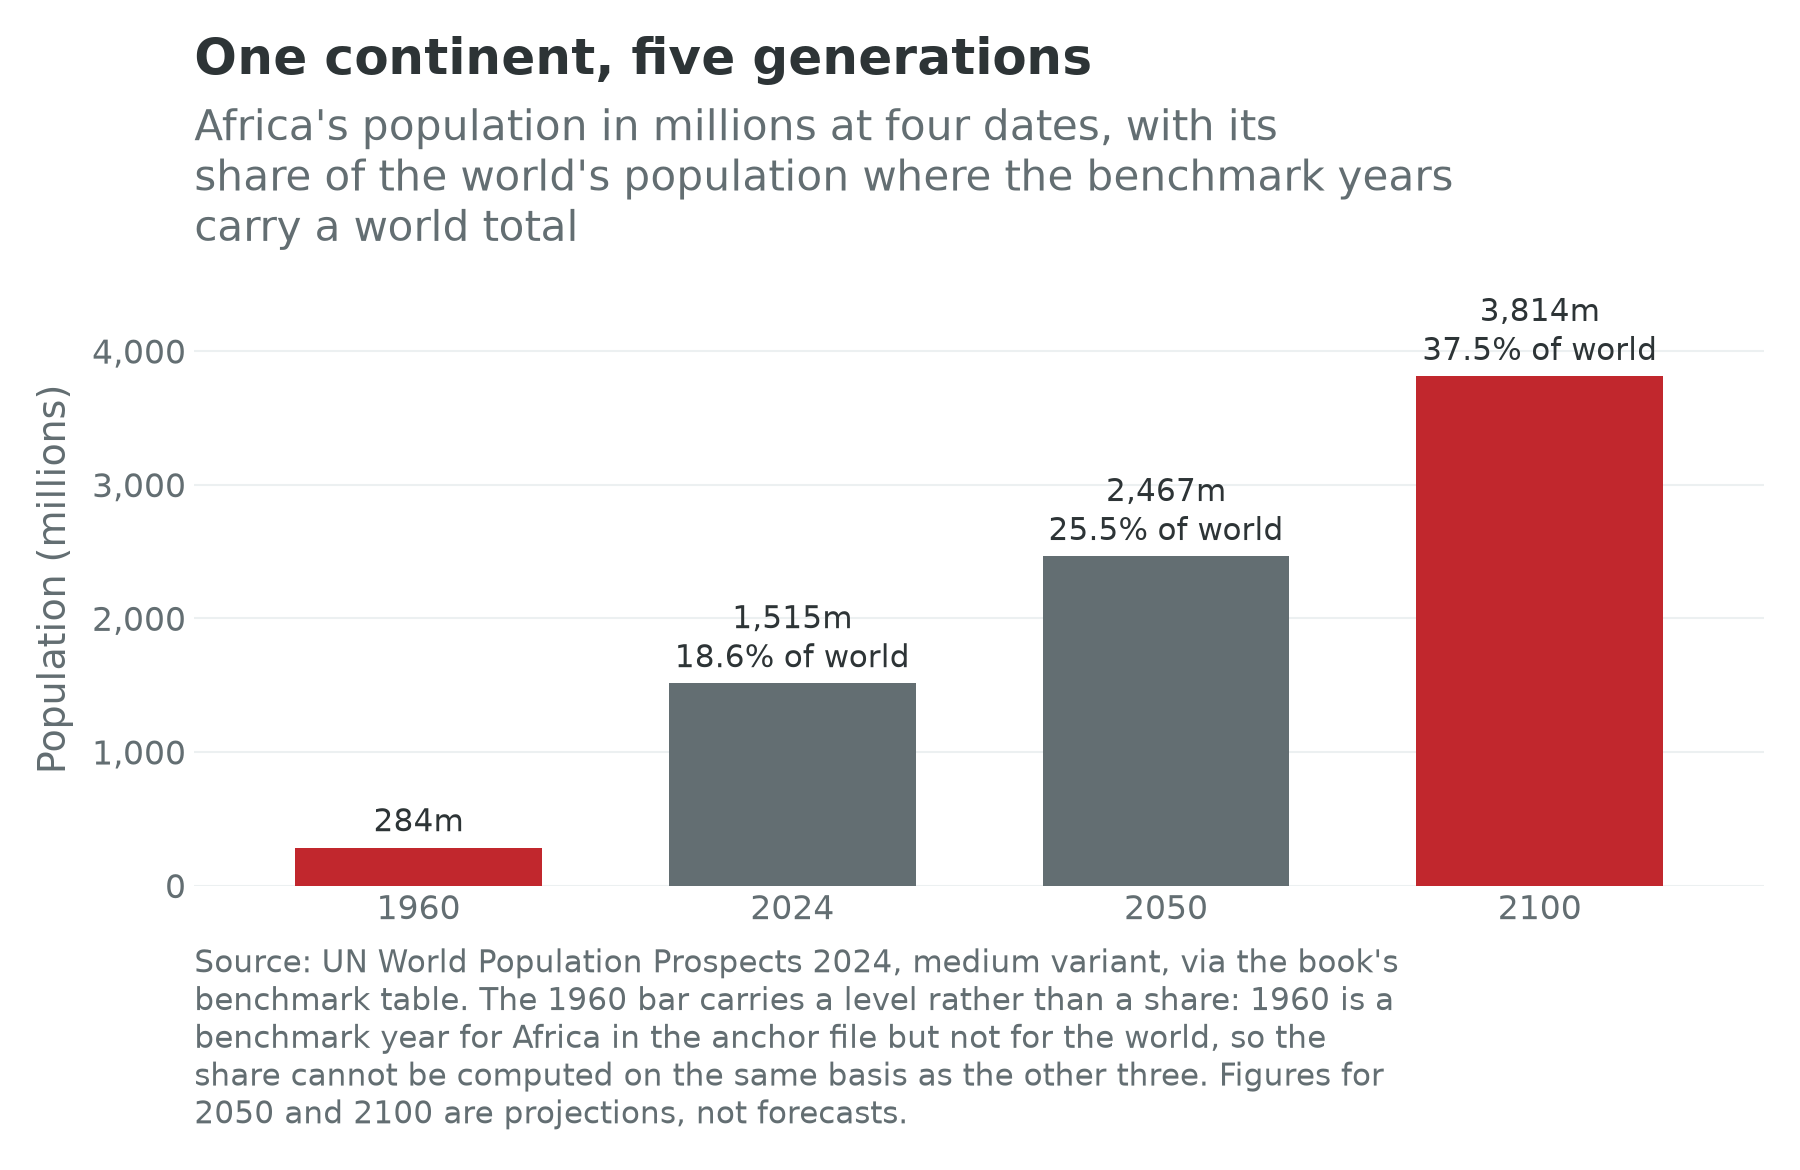
This is the shortest chapter in Part I and it is deliberately not a history of Africa. It is an argument about which parts of the long run the rest of this book needs, and there are three. First, African economies were commercial long before they were colonized, and the institutions they built have measurable descendants. Second, the two great extractions, the slave trades and the colonial fiscal state, damaged the specific things the identity’s three terms are made of: people, the institutions that let people be productively employed, and the capital that decides what they produce. Third, since 1960 the record has been episodic rather than uniform, so the right question is never “why has Africa failed” but “which countries, in which decades, did what, and why”. Johan Fourie’s long history is the model, and its thesis, that over the very long run the builders win, is the note this chapter ends on (Fourie, 2021).
Before the Ships
Start with a correction. The Africa that Europe encountered in the fifteenth century was not an economic blank. West Africa’s Sahelian empires, Ghana, Mali and Songhai in succession, taxed a trans-Saharan trade in gold, salt, copper and captives that ran for the better part of a millennium and made Timbuktu and Gao commercial and scholarly cities. On the other coast, the Swahili city-states from Mogadishu to Sofala were the African terminal of an Indian Ocean system reaching Gujarat and Guangzhou, running on monsoon winds, credit and a shared legal culture. The Kongo kingdom, the Asante state, the Sokoto Caliphate and the Ethiopian highland polity each ran a fiscal system, a standard of value and a bureaucracy. Hopkins (1973) established the framing this book uses: West African economic history is a history of markets, prices, credit and specialization, not of undifferentiated subsistence.
Two features of that world matter here. The first is that Africa was land-abundant and labour-scarce, the reverse of the Eurasian condition, for reasons of soil, disease and rainfall that predate any policy. Where land is free and people are the constraint, control over people rather than over land is what a ruler taxes, an elite accumulates and a war is fought over. Austin (2008) makes this the centre of his reading of African economic history, and it explains much that otherwise looks like a puzzle, including why property rights in land developed late and why slavery was internal to African economies long before it was an export industry.
The second feature is that political centralization varied enormously across the continent, and the variation left a trace. Michalopoulos and Papaioannou (2013) matched the pre-colonial map of ethnic homelands to satellite measurements of light at night, and found a strong association between the pre-colonial political complexity of a group and the economic development of its territory today. The association survives comparisons between adjacent homelands with different pre-colonial institutions, and it survives within countries, which is the important part. Something about the capacity to organize collective activity at scale is old, local, and did not disappear when the borders were redrawn over it. Chapter 5 puts the finding to work; here it is enough that the units the identity is measured on, the 54 states, are recent, and the units that predict much of the variation inside them are not.
The Long Run Has No African Series
Stand back from the fifteenth century for a moment: there is a measurement question underneath everything this chapter does, and it is better asked here than at the end.
The most ambitious attempt anyone has made to measure development over the very long run is Ian Morris’s index of social development, set out in Why the West Rules, For Now (Morris, 2010) and given its full apparatus of tables and sources three years later (Morris, 2013). The method is worth stating in the reader’s terms, because it is the move this book makes at a much shorter horizon. Pick a small number of things a society can be scored on; insist that each of them leaves a physical trace, so that the score does not depend on the narrative; then let the scores carry the comparison. Morris scores four traits at intervals from 14,000 BCE to the present. Energy capture per person counts every calorie a society puts to work, in food, fodder, fuel and machines. Organisation is proxied by the population of the largest city, on the argument that running a big city is the hardest coordination problem a society solves routinely. Information technology runs from the reach of writing to the speed of a telegram. War-making capacity counts what a society can destroy. Each trait is scaled so that the highest value reached in 2000 CE scores 250 points, the four are added, and the sum is plotted for two cores, a Western one and an Eastern one, and for nobody else.
The series is startling in the way that only very long series are. On Morris’s scoring the two cores begin indistinguishable, at about 4,000 kilocalories a person a day at the end of the last ice age, which is a forager’s budget and which both cores hold for millennia (Morris, 2013). Two ancient empires raised it sevenfold or so: about 31,000 at the Roman peak in the first century, against about 26,000 for Han China. Then, for sixteen centuries, almost nothing happens. The Western core is still at about 30,000 in 1700 and 38,000 in 1800, before the line goes vertical, reaching about 92,000 in 1900 against 49,000 for the Eastern core, and about 230,000 for the United States in 2000 against 104,000 for Japan (Morris, 2013). The organisation trait tells the same story on a different axis. Rome held about a million people at its first-century peak, a size no Western city reached again until London in the nineteenth century, and in 2000 the largest Eastern city, Tokyo, held 26.7 million against 16.7 million for the largest Western one, New York (Morris, 2010).
Africa is not in the index.
That sentence is the section. The most sustained attempt to measure human development across sixteen millennia contains no African series at all, and not as a judgement about the continent: the two cores are simply where the surviving evidence is dense enough to score, and Morris says so. The consequence is Chapter 1’s argument about data quality, stretched over sixteen thousand years instead of sixty. A reader who has just been told that African economies were commercial long before they were colonized is entitled to ask how commercial, against what, and on what scale, and the honest answer is that nobody can produce a number that would survive being plotted beside Rome and Chang’an.
The nearest substitutes deserve naming, because a reader will reach for them. The Maddison Project supplies the standard very-long-run income comparisons and does carry African rows, but before 1950 they are thin to the point of transparency, back-projections built off a handful of colonial trade, wage and tax series rather than measurements, which is why this chapter cites the project and quotes no African series from it (Bolt and van Zanden, 2025). Patrick Manning has done for African population what the voyage databases did for the slave trade, reconstructing the continent’s demography across the centuries no census reaches (Manning, 2014). Stephen Broadberry and Leigh Gardner have built annual historical national accounts for eight African economies from 1885, the closest thing the field has to a long African series, and it is eight countries over a century and a quarter rather than a continent over sixteen millennia (Broadberry and Gardner, 2022). Johan Fourie’s Cape work shows what becomes possible where an archive happens to survive, with living standards reconstructed from probate inventories at the far end of the continent (Fourie, 2013). Each of these is excellent. Set side by side, they measure the hole rather than fill it.
Two of Morris’s four traits are variables this book already carries, which is why the detour is not an antiquarian one. The organisation trait is the population of the largest city, and the largest city is where Chapter 22 puts the urban half of the African argument, including the megacity projection this book takes from the agglomeration data. The book’s own field for that quantity is filled on fifty of the fifty-four cards and empty on four, and the four are the instructive part: the agglomeration database redrew its objects between vintages, and on the newer rule Burundi’s largest settlement is not Bujumbura and Kenya’s is not Nairobi. Morris’s oldest trait is still the one hardest to measure, which is a small modern instance of the same absence. Energy capture per person is the thread running from Chapter 14’s grid to Chapter 35’s compute-inputs case. If the binding constraint on a machine economy turns out to be electricity and ore rather than chips, then the claim that Africa’s electrons and minerals are the collateral of this century is a claim that the oldest trait in the oldest index is about to bind again, on a continent that has never been scored on it.
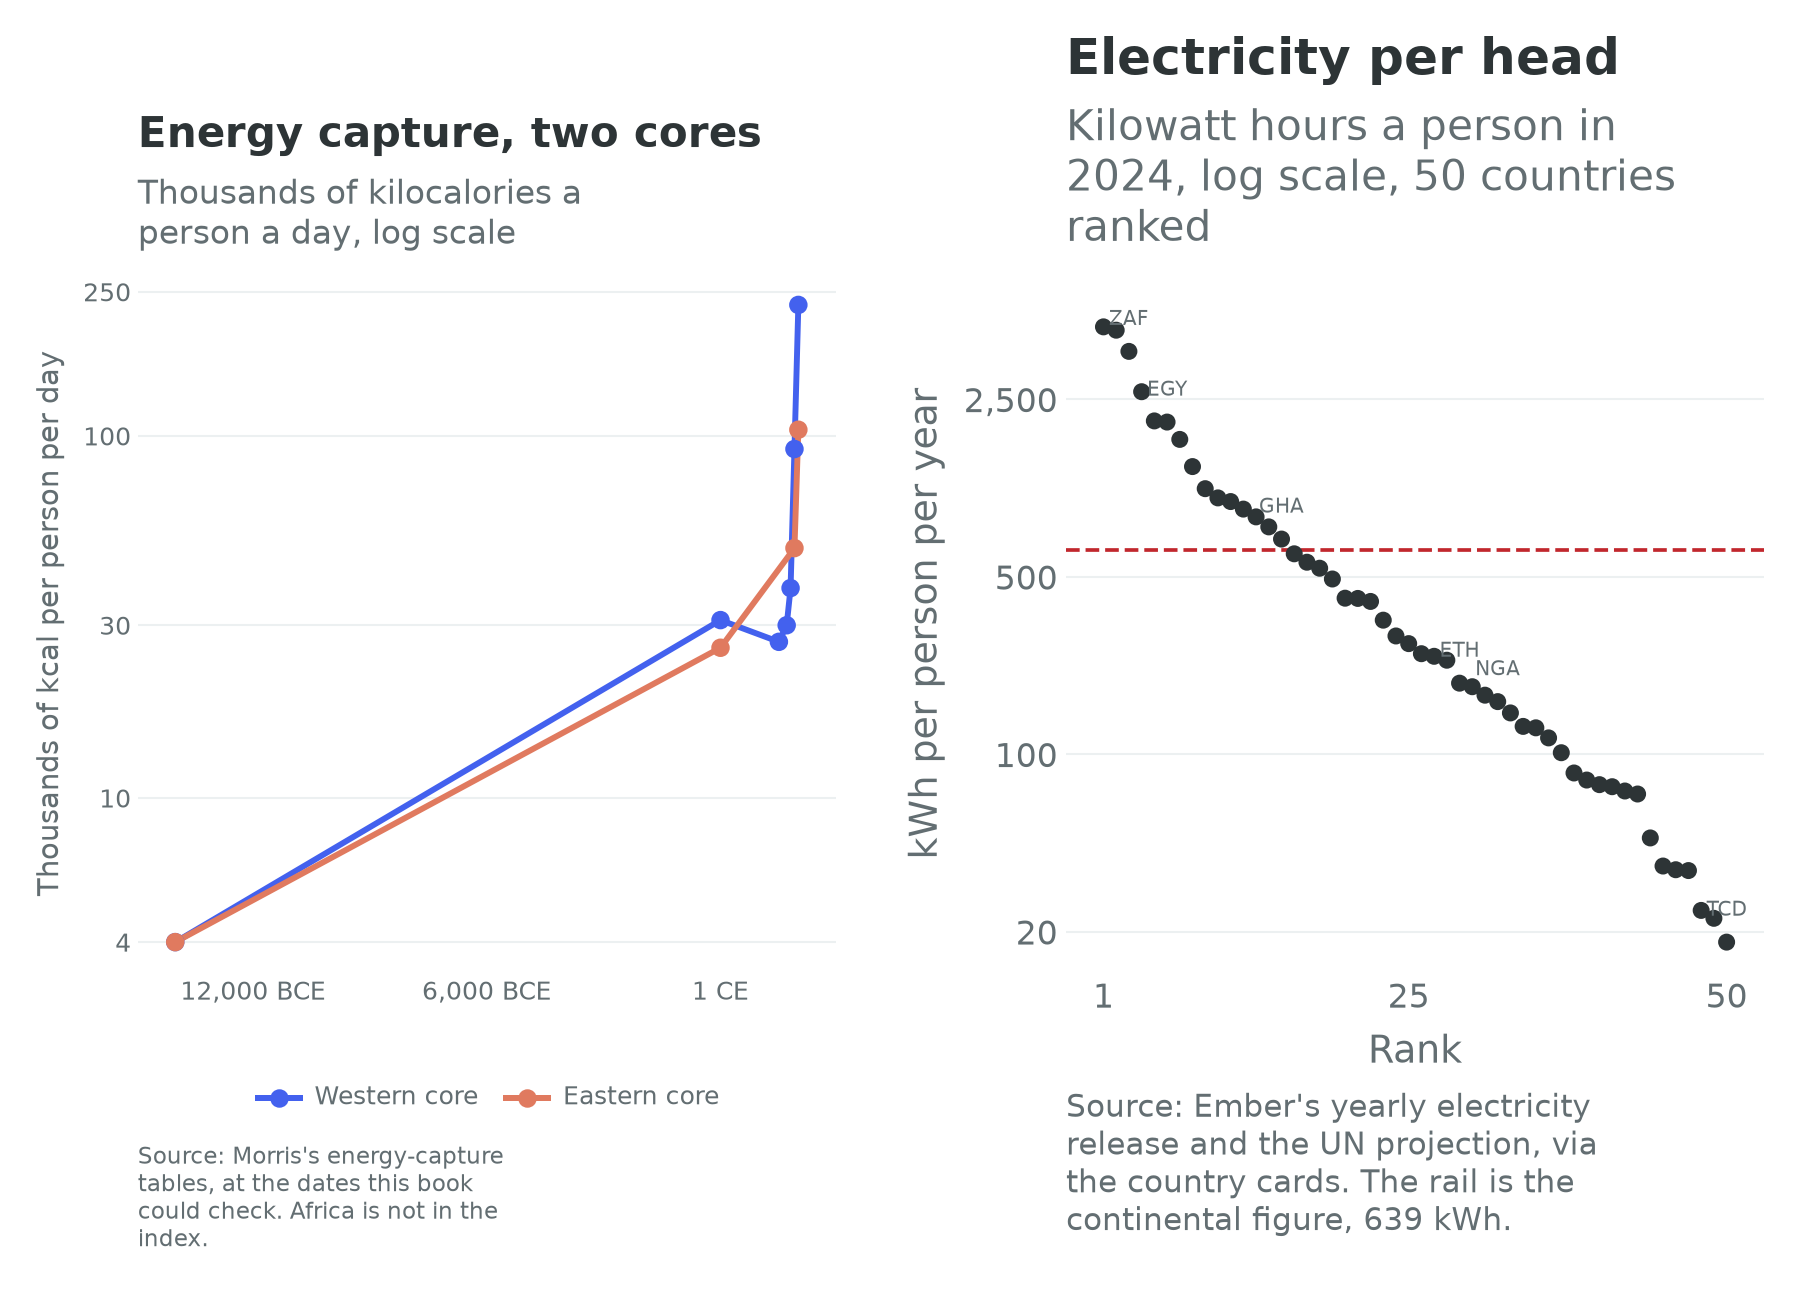
The right-hand panel is as close as this book can get to that trait today. Africa generated 639 kilowatt hours of electricity a person in 2024, taking total generation over total population across the fifty countries that report a figure for the year. The median country generated 261, and thirty-five of the fifty sat below the continental average, which is what an aggregate looks like when three or four large systems carry it. South Africa, the largest of them, generated 3,867 kilowatt hours a person; Chad generated 18. Convert the continental figure into Morris’s units and it comes to roughly 1,500 kilocalories a person a day, below his ice-age baseline, and the conversion is worth doing once precisely so that it can be refused: the grid is one slice of energy capture, and the slice leaves out every calorie eaten, every bag of charcoal burned and every litre of diesel in the generator behind a shop. The panels share a trait and a shape. They do not share a unit.
Carry the absence into the rest of this chapter. The slave-trade estimates that follow, the long income comparisons standing behind the independence-era material, the syndrome classifications of the decades after 1960: each is an attempt to say something about African economic history with instruments built elsewhere and calibrated on other archives. That does not make them wrong, and this chapter quotes them. It means their error bars are wider than their decimal points suggest, and that the right response is the one Chapter 1 recommends for the present. Treat the measurement as a layer of the argument rather than as the ground underneath it.
Four Centuries of Export
The Atlantic slave trade moved about 12.5 million people out of Africa between 1501 and 1867, of whom about 10.7 million survived the crossing (Slave Voyages, 2026). Those two numbers are among the best-documented in economic history, reconstructed voyage by voyage from shipping records by the project Eltis and Richardson (2010) describe, and the gap is a mortality statistic. Three other trades, across the Sahara, up the Red Sea and into the Indian Ocean, ran for far longer and moved millions more. Nunn (2008) put all four on the same footing by estimating exports from each African territory and setting them against outcomes today.
The result is the most cited number in this literature, and it deserves both quotation and a warning. Nunn (2008) estimates that without the slave trades, 72 percent of the average income gap between Africa and the rest of the world would not exist, and 99 percent of the gap between Africa and the rest of the developing world would not exist. The warning is that this is a counterfactual from an instrumented cross-section, not a measurement, and its author says so. What it establishes robustly is a direction and a magnitude: the territories that exported the most people are, four centuries later, the poorer ones, and the relationship is not explained by the obvious geographic alternatives.
The mechanism matters more than the magnitude, because the mechanism is what the identity can see. Nunn and Wantchekon (2011) traced one channel: people whose ancestors were heavily raided are measurably less trusting of neighbours, relatives and local government today, and low trust is expensive in exactly the settings where contracts are hard to enforce. Slaving also selected against the state, rewarding small, militarized and predatory political units and punishing large, orderly ones, so a trade that ran for four centuries acted as a filter on African political organization, and it filtered in the wrong direction. Inikori (2002) makes the complementary argument from the other end, that the Atlantic system was not a marginal transaction for the economies receiving it. Rodney (1972) stated the underdevelopment thesis in its strongest form, and is worth reading in the original rather than through his critics, because the empirical literature of the last twenty years has confirmed more of it than the profession expected.
The Fiscal Footprint of Empire
Colonial rule in most of Africa was short. The Berlin Conference sat in 1884 and 1885; most of the continent was independent again within eighty years, and that brevity constrains what the period can be blamed for and credited with.
The colonial state was also poor and cheap, by design rather than accident, because colonies were expected to pay for themselves. Frankema and van Waijenburg (2014) reconstructed the budgets of British and French African colonies from around 1880 to 1940 and asked whether the two empires taxed according to distinct metropolitan blueprints. They did not: under comparable local conditions the two administrations behaved in remarkably similar ways, leaning on customs duties where trade was dense enough to tax at the port and on head or hut taxes where it was not. What varied was not the imperial doctrine but the local revenue base, which reframes colonial fiscal capacity as a function of the underlying economy rather than of the flag flying over it.
There is a shadow budget as well. Van Waijenburg (2018) shows that French African administrations financed themselves substantially through forced labour, a levy that never appears in a revenue column because it was extracted in days rather than francs. Any account of what the colonial state cost the people it governed that reads only the published accounts will understate it.
What the colonial state did build, it built for extraction, and some of it is still standing. Jedwab, Kerby and Moradi (2017) is the cleanest demonstration. Colonial railways in Kenya were laid for imperial reasons that had nothing to do with the local economy; they determined where European settlers and Asian traders located; the settlers’ locations determined where the main cities stood at independence. Then the Europeans left, the traders left, the railways declined into irrelevance, and the cities stayed exactly where they were. The authors test four explanations and conclude that sunk investment and the solution of a spatial coordination problem, rather than institutional inheritance, do the work. That is a hopeful reading disguised as a fatalistic one: a coordination equilibrium is a thing a government can move, if it can coordinate. Chapter 26 returns to Kenya and Chapter 29 to the Addis-Djibouti corridor, where the same logic is being run forward.
The strongest version of the persistence claim is the reversal-of-fortune thesis. Acemoglu, Johnson and Robinson (2001) argued that where European settler mortality was high, Europeans built extractive institutions rather than settling, and that those institutions persisted into modern income differences (Acemoglu, Johnson and Robinson, 2002). It is an elegant argument and it has been enormously productive. Austin (2008) supplies the objection this book adopts, and his charge is the compression of history: a single variable measured at one moment is asked to stand for four centuries of varied, contested and reversible institutional development, and in the compression the sequence disappears. Colonial institutions were not one thing; settler colonies, peasant-export colonies and concession economies differed, and each changed over time. African agency disappears too, since the reversal story has Africans as the terrain on which European choices were made rather than as parties to a bargain. The practical consequence is a rule: history sets the conditions under which a political settlement is negotiated and never determines its outcome, or Botswana and the Democratic Republic of the Congo would not both exist.
Nineteen Sixty and the Generation That Built
The independence generation inherited states with thin bureaucracies, single-commodity export sectors, almost no manufacturing, and very low levels of formal schooling. It also inherited a genuine mandate to do something, and for about fifteen years it did.
Mkandawire (2001) is the necessary corrective to the way that period is usually taught. The standard account has African governments of the 1960s and 1970s as confused, rent-seeking and hostile to markets. Mkandawire’s argument is that the African statist tradition was neither more interventionist nor less competent than the East Asian one the same profession admires, and that the difference in outcomes owes more to external shocks, commodity dependence and the thinness of the inherited administration than to the sincerity of the intention. He is not defending the record. He is objecting to a comparison in which Korea’s failures are called learning and Ghana’s are called proof.
The most useful organizing device for the period from 1960 to 2000 is the growth-syndrome typology of the Ndulu volume, assembled from twenty-six country studies (Ndulu and Bates, 2008). Instead of asking why Africa grew slowly, it asks which policy configuration a country was running in a given decade, and sorts them into four anti-growth syndromes: state controls, in which price and trade regulation strangled the tradable sector; adverse redistribution, in which the state was captured for a region or an ethnic coalition; unsustainable intertemporal spending, in which a commodity windfall was consumed and then borrowed against; and state breakdown. Everything else is syndrome-free, which is not a compliment so much as the absence of a specific disease. Fosu (2017) reports the summary estimate that being syndrome-free is worth close to 3 percentage points a year on growth in output per head, working mainly through total factor productivity rather than factor accumulation.
Two features of that typology earn it a place here. It classifies episodes rather than countries, so a country can move in and out of a syndrome, and many did. And it locates the problem in the political settlement rather than in culture or geography, which connects it to Chapter 5.
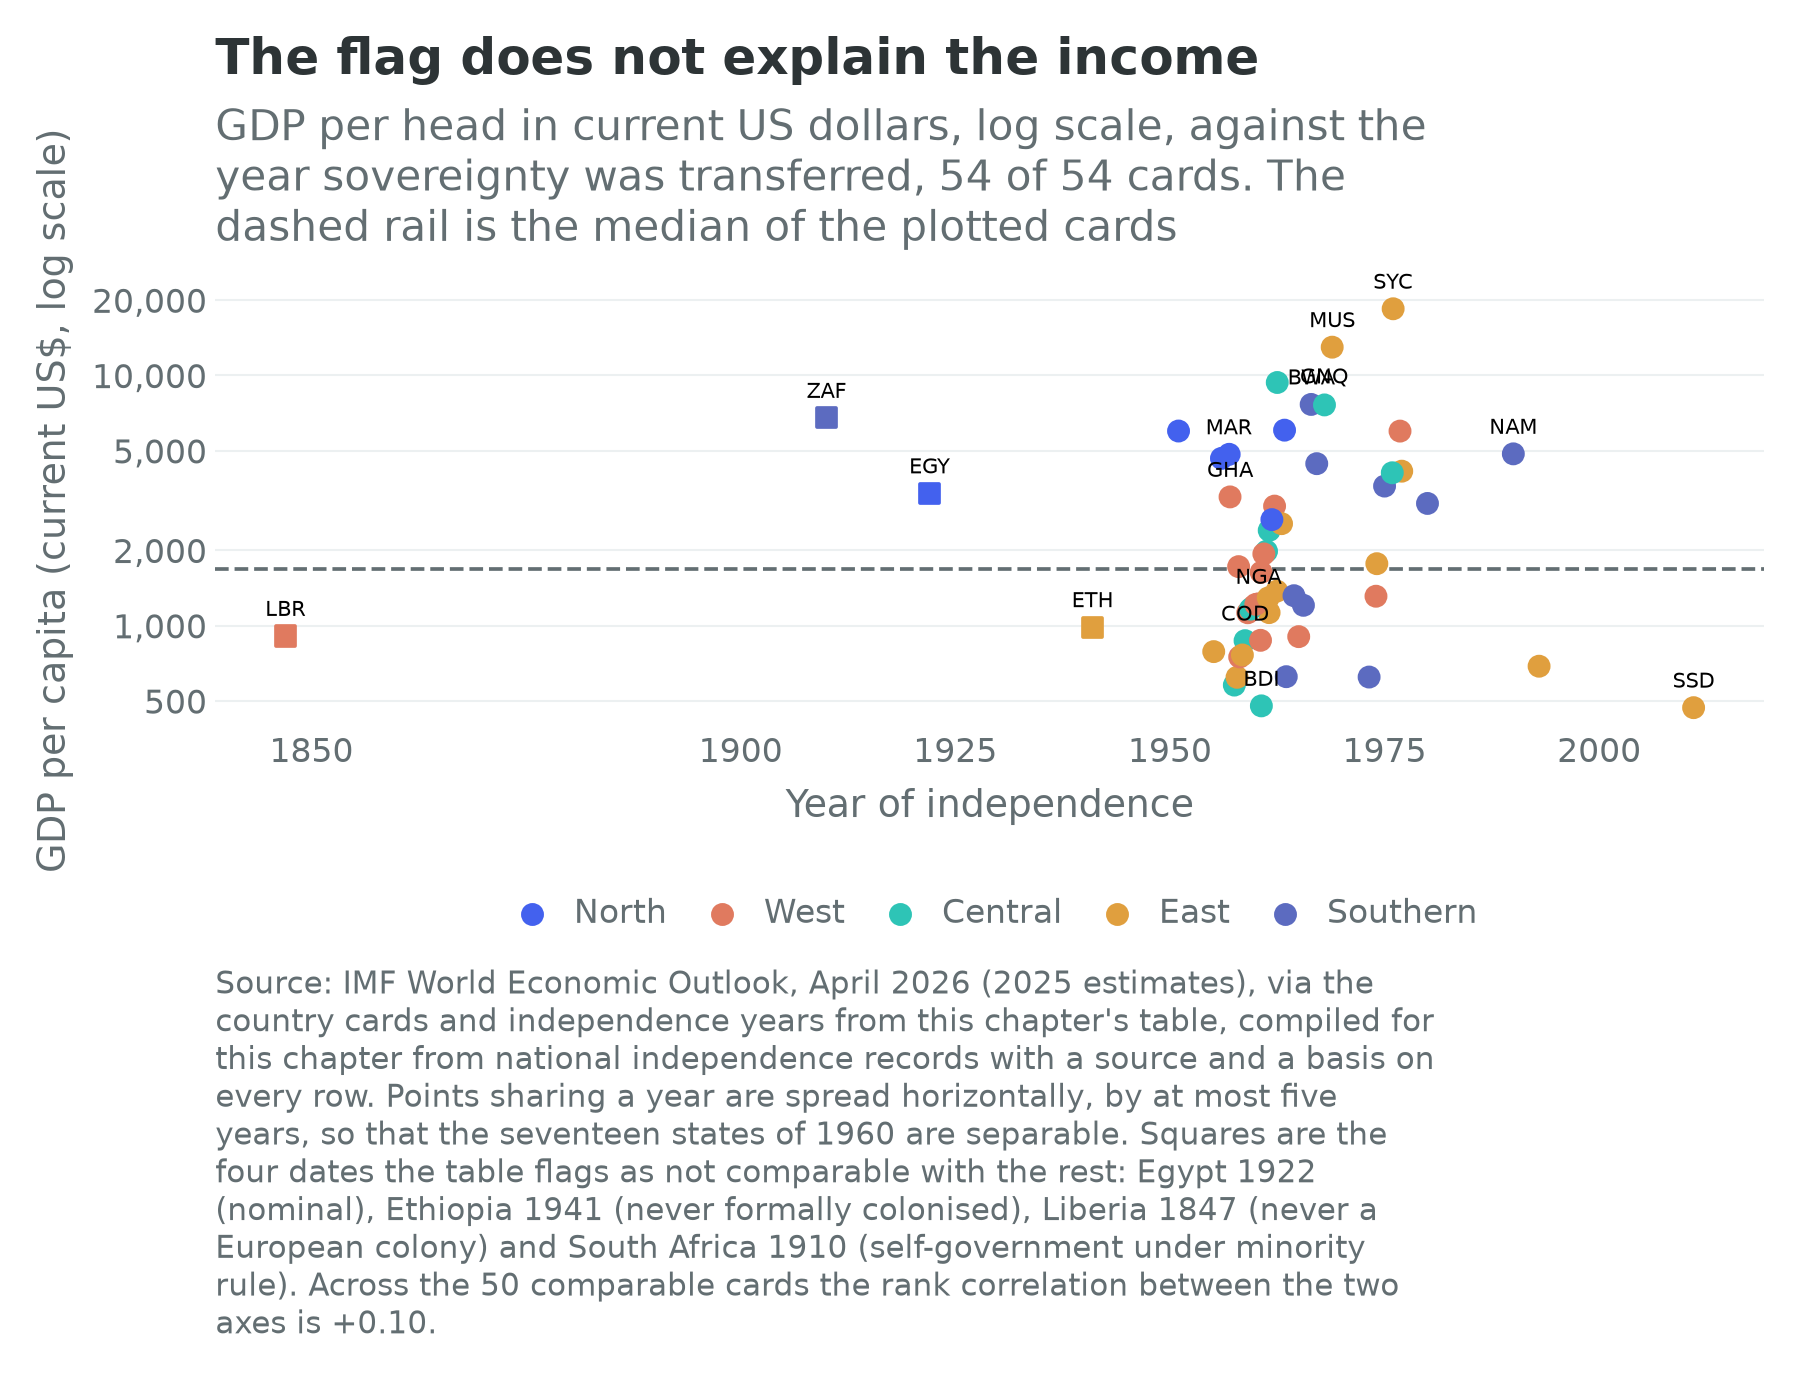
The figure is the chapter’s negative result. Set today’s income per head against the year the flag changed, and the relationship is essentially nothing: across the fifty countries whose independence dates are comparable, the rank correlation is positive but negligible, and the states that waited longest are not systematically richer or poorer than those that went first. The same holds for statistical capacity. Figure 3.4 sets the World Bank’s Statistical Performance Indicators score against the same horizontal axis, and again the cloud has no slope worth reporting: Senegal at 81.4 and the Republic of the Congo at 38.9 became independent in the same year, from the same metropole, with the same administrative inheritance.
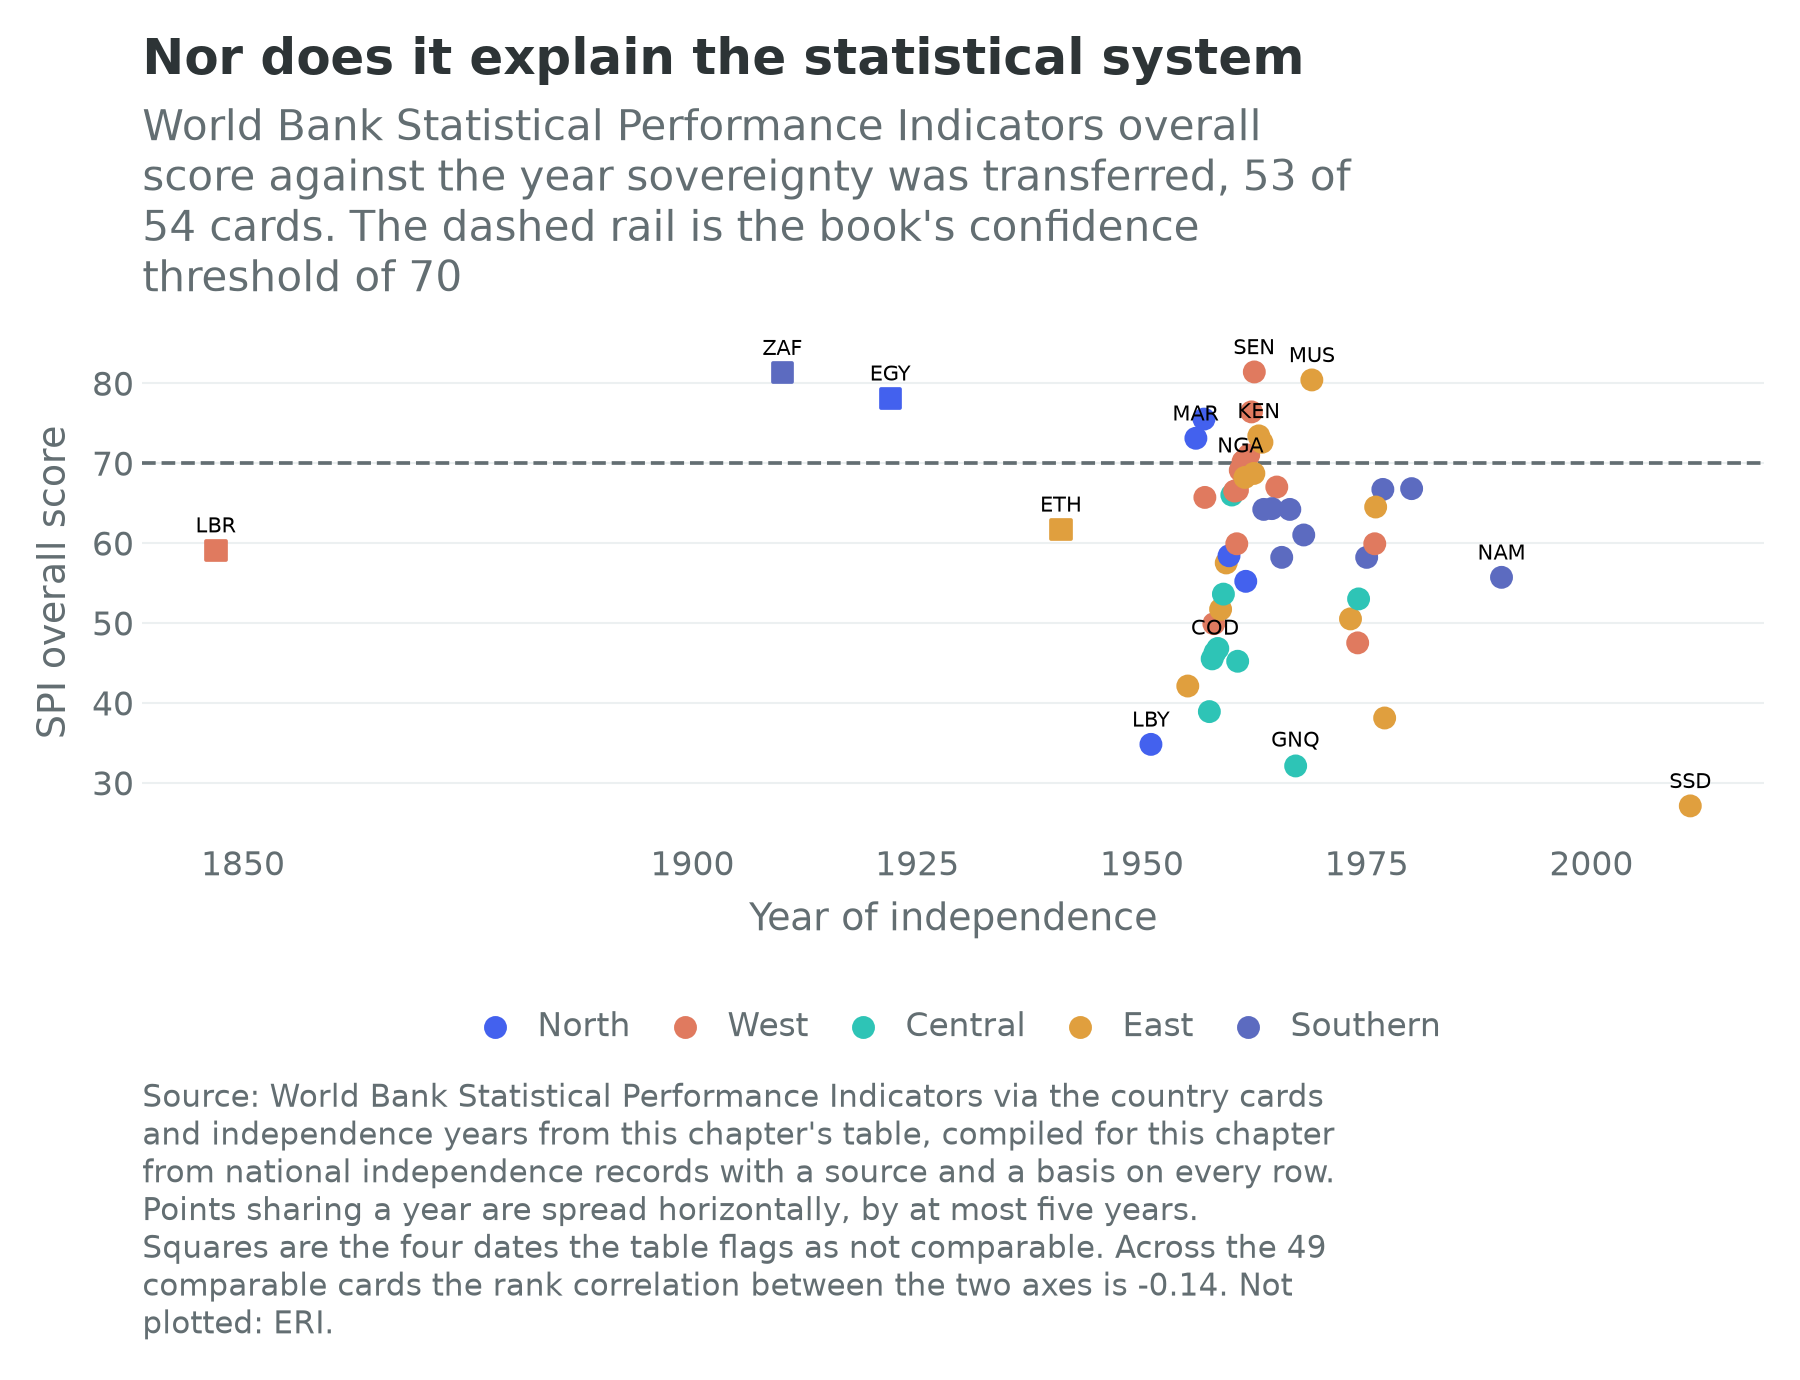
A word on what these two figures are and are not. The country cards carry no historical series, so this chapter cannot plot African income across the twentieth century and does not pretend to. What it can do is set a present-day outcome against a historical date, the weakest available test of persistence, and the weakness is the point. If the crudest historical variable, the year of the handover, explained the present, this chapter’s argument would be much simpler and much gloomier. Every historical figure in the text instead comes from a named study, and the studies disagree with each other, which is the honest state of the field.
The Lost Decades
The break came in the mid-1970s, and it came from outside. The oil shocks raised the import bill for the large majority of African economies that had no oil, and raised export earnings spectacularly for the few that did. Petrodollars were recycled into sovereign lending at low real rates. Then commodity prices fell and the Volcker disinflation raised the price of the debt taken on against them. Simson (2025) is a good short account of what followed: measured income per head across the region was no higher at the end of the 1990s than in the mid-1970s, a two-decade round trip.
Structural adjustment was the answer the international institutions gave, and the Accelerated Development in Sub-Saharan Africa report set the agenda (World Bank, 1981). Its diagnosis was that African governments had turned the terms of trade against their own farmers through overvalued exchange rates, marketing-board monopsonies and industrial protection, and that the correction was to get the prices right. On a good deal of this the diagnosis was correct, and some programmes did what they were meant to. Currencies were devalued, marketing boards paying farmers a fraction of the world price were dismantled, and inflation came down.
The African critique is not that these things were wrong but that they were not the binding constraint, and that pursuing them destroyed the capacity to do anything else. Mkandawire and Soludo (1999) collected that argument at book length: conditionality removed policy autonomy without supplying an alternative source of coordination; fiscal compression fell hardest on civil-service salaries, the recurrent budgets of schools and clinics, and the statistical offices whose thinness Chapter 1 is about; and the programmes assumed a private sector that would step forward once the state stepped back, which in most places it did not. Van de Walle (2001) adds the political economy: what looked like two decades of failed reform was in many countries a stable equilibrium of partial reform, in which governments conceded precisely enough to keep the money arriving, so the permanence of the crisis was a feature of the arrangement rather than a symptom of its failure. Easterly and Levine (1997) supplied the influential cross-country statement of the growth tragedy and named ethnic fragmentation as a proximate correlate; Chapter 5 explains why this book treats fragmentation as an input to a political settlement rather than a cause on its own.
The Boom, and What It Was Made Of
Then the numbers turned, and turned sharply. Sub-Saharan African output grew at an average of 5.6 percent a year from 2000 to 2013 (IMF, 2018). Debt relief under the Heavily Indebted Poor Countries initiative and its multilateral successor wrote off much of the stock accumulated in the previous cycle, and by the end of the 2000s most of the region’s governments had fiscal space they had not had since the 1970s. Chinese demand raised the price of nearly everything Africa exports. Mobile telephony skipped a generation of fixed infrastructure. Long wars ended.
By 2011 this had become a genre. The Economist ran its “Africa rising” cover in December of that year, eleven years after calling the same continent hopeless, and the magazine’s two positions are the cleanest available illustration of how little either one rested on. Radelet (2010) is the serious version of the optimistic case, better than its reputation because it names countries and mechanisms rather than a mood.
Four qualifications belong on the same page, and Chapter 4 stages them as a full argument. The composition of the growth was commodity-heavy, and the super-cycle ended in 2014 and 2015. The measurement was moving underneath the story, because a run of GDP rebasings revealed that the denominators of the previous decade’s growth rates had been too small (Jerven, 2013). The two most careful attempts to check the national accounts against independent evidence disagree with the official series and with each other by large margins: from consumption surveys (Young, 2012), and from satellites (Henderson, Storeygard and Weil, 2012). And the growth did not convert into employment on anything like the scale the arithmetic required, which is term two of the identity and the subject of Chapter 10.
The Reset
The 2020s opened with a pandemic that closed borders, collapsed tourism, and forced governments to borrow at exactly the moment their revenues fell. What followed was not a return to the 1980s, and the differences are more instructive than the similarities.
The creditor composition has changed. The debt of the 1970s was owed to Paris Club governments and syndicated banks, and was restructured, eventually, by a small number of institutions that knew each other. The debt of the 2020s is owed to scattered bondholders, to Chinese policy banks and to commodity traders, and it includes collateralized and resource-backed structures that are hard to see from outside (Horn, Reinhart and Trebesch, 2021). Restructuring is correspondingly slower. Chapter 21 works through the cases and Chapter 32 through the Chinese half of the creditor question; the point here is that the repayment wall of the mid-2020s falls on exactly the budgets that would otherwise be building the ports (S&P Global Ratings, 2026).
The politics have changed too. Between 2020 and 2023 there were nine successful coups in seven African countries, concentrated in a belt running from the Atlantic coast of West Africa to the Red Sea, and three of the Sahelian states have since left the Economic Community of West African States (VOA, 2024a). This is not the continent-wide instability of the 1970s and should not be described as such. It is a regional phenomenon with a specific geography, and Chapter 36 treats it as one, alongside the climate and conflict material that belongs with it.
The third change is the one this book is built on. Term one of the identity is delivering more additional workers per year than at any point in the continent’s history, and it will keep doing so whatever happens to the debt or the coups. The reset is therefore not a repeat. It is the same fiscal squeeze arriving at a moment when the cost of getting the answer wrong is very much higher.
What the Long Run Says About Each Term
Term one, the growth of the working-age population, is the term history has already decided. The slave trades removed people and their compounding descendants; the colonial period did little to the birth rate and a good deal, eventually, to the death rate; and the mortality decline of the twentieth century, running ahead of the fertility decline as it does everywhere, produced the age structure Chapter 2 describes. Nothing here is a reason to revise the projection. What the long run adds is a warning about the counting: the countries the projections must extrapolate furthest are, disproportionately, those where the state was thinnest longest, and thin states run bad censuses.
Term two, the growth of the employment-to-working-age ratio, is the term the long run damaged most and least visibly. It is about the institutions that convert a person into a productive job: contract enforcement, trust between strangers, functioning labour markets, firms large enough to hire. The slave trades attacked trust and rewarded predatory political forms; the colonial state built an administration sized for extraction rather than service; adjustment shrank the public payroll without producing the private one meant to replace it. That is three separate historical episodes acting on one term. It is why the growth-without-jobs pattern of the 2000s should be read as the latest instance of something old rather than as a surprise, and why Chapter 10 is the thesis chapter of this book.
Term three, the growth of output per worker, is the term where history is least deterministic and the evidence is most encouraging. Colonial railways determined where cities are but not how productive they are; pre-colonial centralization predicts regional development but explains a minority of the variance; the reversal-of-fortune thesis, on Austin’s reading, is a claim about initial conditions rather than the range of available outcomes. Countries have moved: Botswana and Mauritius travelled a long way from starting positions no historical variable would have picked, and Rwanda and Ethiopia moved fast for two decades from worse ones. Structural transformation is the term policy has demonstrably shifted within a generation, which is why Chapters 9, 11 to 19 and 24 to 31 are mostly about it.
The Builders
Fourie’s long history reaches a conclusion that is easy to state and hard to hold on to: over long enough horizons, the societies that build, that invest in people and in the institutions that let people cooperate with strangers, end up ahead of the societies that extract (Fourie, 2021). It is not a claim that history is fair, and Fourie writes from inside the most extractive institutional history on the continent, so he is not naive about the cost. It is a claim about what compounds. Extraction is a level; building is a rate.
The counter-case has to be on the same page. Four centuries is a long time to wait for a rate to beat a level, and no finance minister has that horizon. The persistence findings say that some historical damage is still measurable today, so the compounding has not yet closed the gap it opened. Nothing guarantees that the builders will be African rather than the owners of the mines and the ports, which is a balance-sheet question rather than a historical one. And the most honest reading of the record from 1960 to 2000 is that syndrome-free episodes were the exception, that the syndromes returned in several countries that had escaped them, and that being syndrome-free describes an absence rather than a strategy.
What the long run licenses, then, is neither optimism nor its opposite. It licenses a specific expectation: that the range of outcomes available to an African country over the next thirty years is wide, wider than any historical variable can predict, and that it will be settled by identifiable people in identifiable places. That is a more demanding claim than either Afro-pessimism or Africa Rising, because it can be checked. Chapter 4 stages the check.
Connections to Other Chapters
- Chapter 1 (Africa in Numbers) states the identity this chapter reads backwards, and builds the confidence layer that Figure 3.4 uses.
- Chapter 2 (The Demographic Century) carries the mortality-and-fertility mechanism the term-one paragraph here compresses into a sentence.
- Chapter 4 (The Case and the Counter-Case) stages the Africa Rising argument and its critics, with the 2000s boom on one side.
- Chapter 5 (States, Political Settlements, and Development Bargains) takes the growth-syndrome typology and the persistence findings into the political-settlements frame.
- Chapter 9 (The Studwell Recipe Applied) tests what the developmental-state tradition Mkandawire defends can deliver.
- Chapter 10 (Labor, Youth, and Migration) carries term two, which this chapter argues the long run damaged most.
- Chapter 14 (Energy and the Solar Transition) carries the modern half of Morris’s energy-capture trait, from the tariff to the wire.
- Chapter 21 (Capital and Sovereign Debt) and Chapter 32 (China in Africa) carry the debt cycle sketched here.
- Chapter 22 (Land) carries the largest-city trait as the urban argument, and the same empty field on the same fifty-four cards.
- Chapter 26 (Nairobi–Mombasa) and Chapter 29 (Addis–Djibouti) are where railway geography stops being history and becomes a corridor investment.
- Chapter 35 (Scenarios to 2050 and 2100) carries the compute-inputs case, in which the index’s oldest trait binds again.
- Chapter 36 (What Could Go Wrong) carries the Sahel, the coup belt and the climate material this chapter names.
Discussion Questions
Nunn (2008) estimates that 72 percent of the income gap between Africa and the rest of the world would not exist without the slave trades. Austin (2008) argues that this genre of estimate compresses centuries of varied institutional history into a single variable. State the strongest version of each position, then say what evidence would move you from one to the other. Is Austin’s objection about the size of the estimate, its interpretation, or the question it answers?
Figure 3.3 shows essentially no relationship between the year a country became independent and its income per head today. Suppose you nonetheless believe that colonial rule had large and lasting economic effects. Are those two positions consistent? Explain why the year of the handover is a poor test of the persistence claim, and say what a better one would look like.
The growth-syndrome typology classifies episodes rather than countries and treats “syndrome-free” as the residual. Pick an African country and a decade, assign it a syndrome or the residual, and defend the assignment. Then say what the typology cannot see, and whether that blind spot would change your answer.
Try It
Open the country cards for the four states whose independence dates this chapter flags as not comparable: Egypt, Ethiopia, Liberia and South Africa. For each, read the header, the scale block and the data_quality block, and write one sentence on what makes its history unlike the other fifty. Then open the cards for the Republic of the Congo and Senegal, independent in the same year from the same metropole, and compare their data_quality.spi_overall_score and scale.gdp_per_capita fields. Write a paragraph on what a historical account would have to contain to explain the difference, and whether any variable in this chapter could supply it.
Data Exercise
Download all fifty-four cards from the country cards page on this site, either as cards.csv or as cards.json, and the independence-year table, independence_years.csv, from the About the data page. Join them on the ISO3 code, keeping all 54 rows. Then answer four questions. First, regress scale.gdp_per_capita, in logs, on independence_year, once with all 54 and once dropping the four rows the table’s note column flags, and report how far the flagged rows move the coefficient. Second, replace the dependent variable with data_quality.spi_overall_score and repeat, noting that one country has no score and must be dropped rather than zero-filled. Third, add the former colonial power from the ruler column as a set of indicators and report whether it explains more of the variance than the year does; say in one sentence why a significant coefficient would still not be evidence of a causal effect. Fourth, restrict the sample to the seventeen states of 1960 and report the ratio of the highest to the lowest scale.gdp_per_capita within that group, then write two sentences on what a single-cohort comparison can and cannot establish. Fifth, confirm that scale.largest_city is null on all fifty-four cards, which is this book’s field for the trait Morris uses to measure organisation, and write two sentences on what would have to be fetched to fill it and what a filled column would let you test that this chapter cannot. Note which fields are null rather than zero, and never impute a null as a zero.
Data Sources and Further Reading
Key data sources
- UN World Population Prospects 2024 (population.un.org): the 1960, 2024, 2050 and 2100 continental benchmarks, medium variant.
- IMF World Economic Outlook, April 2026 (GDP per head, 2025 estimates) and World Bank Statistical Performance Indicators: the present-day outcomes in Figures 3.2 and 3.3, via the country cards.
- Independence-year table,
_figures/ch03/independence_years.csv: one row per UN member state, with the date, the basis on which sovereignty was transferred, a source, and a note on the four cases the book treats as not comparable. Compiled from national independence records and Encyclopaedia Britannica country histories (Encyclopaedia Britannica, 2026). - Slave Voyages (slavevoyages.org): the voyage-level reconstruction behind the embarkation and disembarkation figures.
- Maddison Project Database: the standard source for very-long-run income comparisons, and the reason this chapter quotes none as a series (Bolt and van Zanden, 2025).
- Morris’s energy-capture table,
_figures/ch03/ch03_morris_energy.csv: the Western and Eastern cores at the dates the index gives, one row per date and core, each carrying its source, its vintage and a ledger identifier; paired for the right-hand panel of Figure 3.2 with Ember’s yearly electricity release for generation and UN World Population Prospects 2024 for population, via the country cards.
Further reading
- Johan Fourie, Our Long Walk to Economic Freedom (2021), the model for this chapter and the source of its closing thesis.
- Gareth Austin, “The ‘Reversal of Fortune’ Thesis and the Compression of History” (2008), for the African economic historian’s objection to the institutions literature.
- Nathan Nunn, “The Long-Term Effects of Africa’s Slave Trades” (2008), and Nunn and Wantchekon (2011) for the trust mechanism.
- Ewout Frankema and Marlous van Waijenburg on colonial fiscal capacity (2014), and van Waijenburg (2018) on forced labour as an unrecorded tax.
- Benno Ndulu and co-authors, The Political Economy of Economic Growth in Africa, 1960 to 2000 (2008), for the syndrome typology and the country studies behind it.
- Thandika Mkandawire and Charles Soludo, Our Continent, Our Future (1999), for the African case against adjustment as it was actually run.
- Nicolas van de Walle, African Economies and the Politics of Permanent Crisis (2001), for why partial reform lasted twenty years, and A. G. Hopkins, An Economic History of West Africa (1973), still the best single volume on the precolonial commercial economy.
- Ian Morris, The Measure of Civilization (2013), for the four traits, their scoring and the two cores the index covers, read against Broadberry and Gardner (2022) and Manning (2014) for the nearest thing to a long African series.