19. Trade, Logistics, and Ports
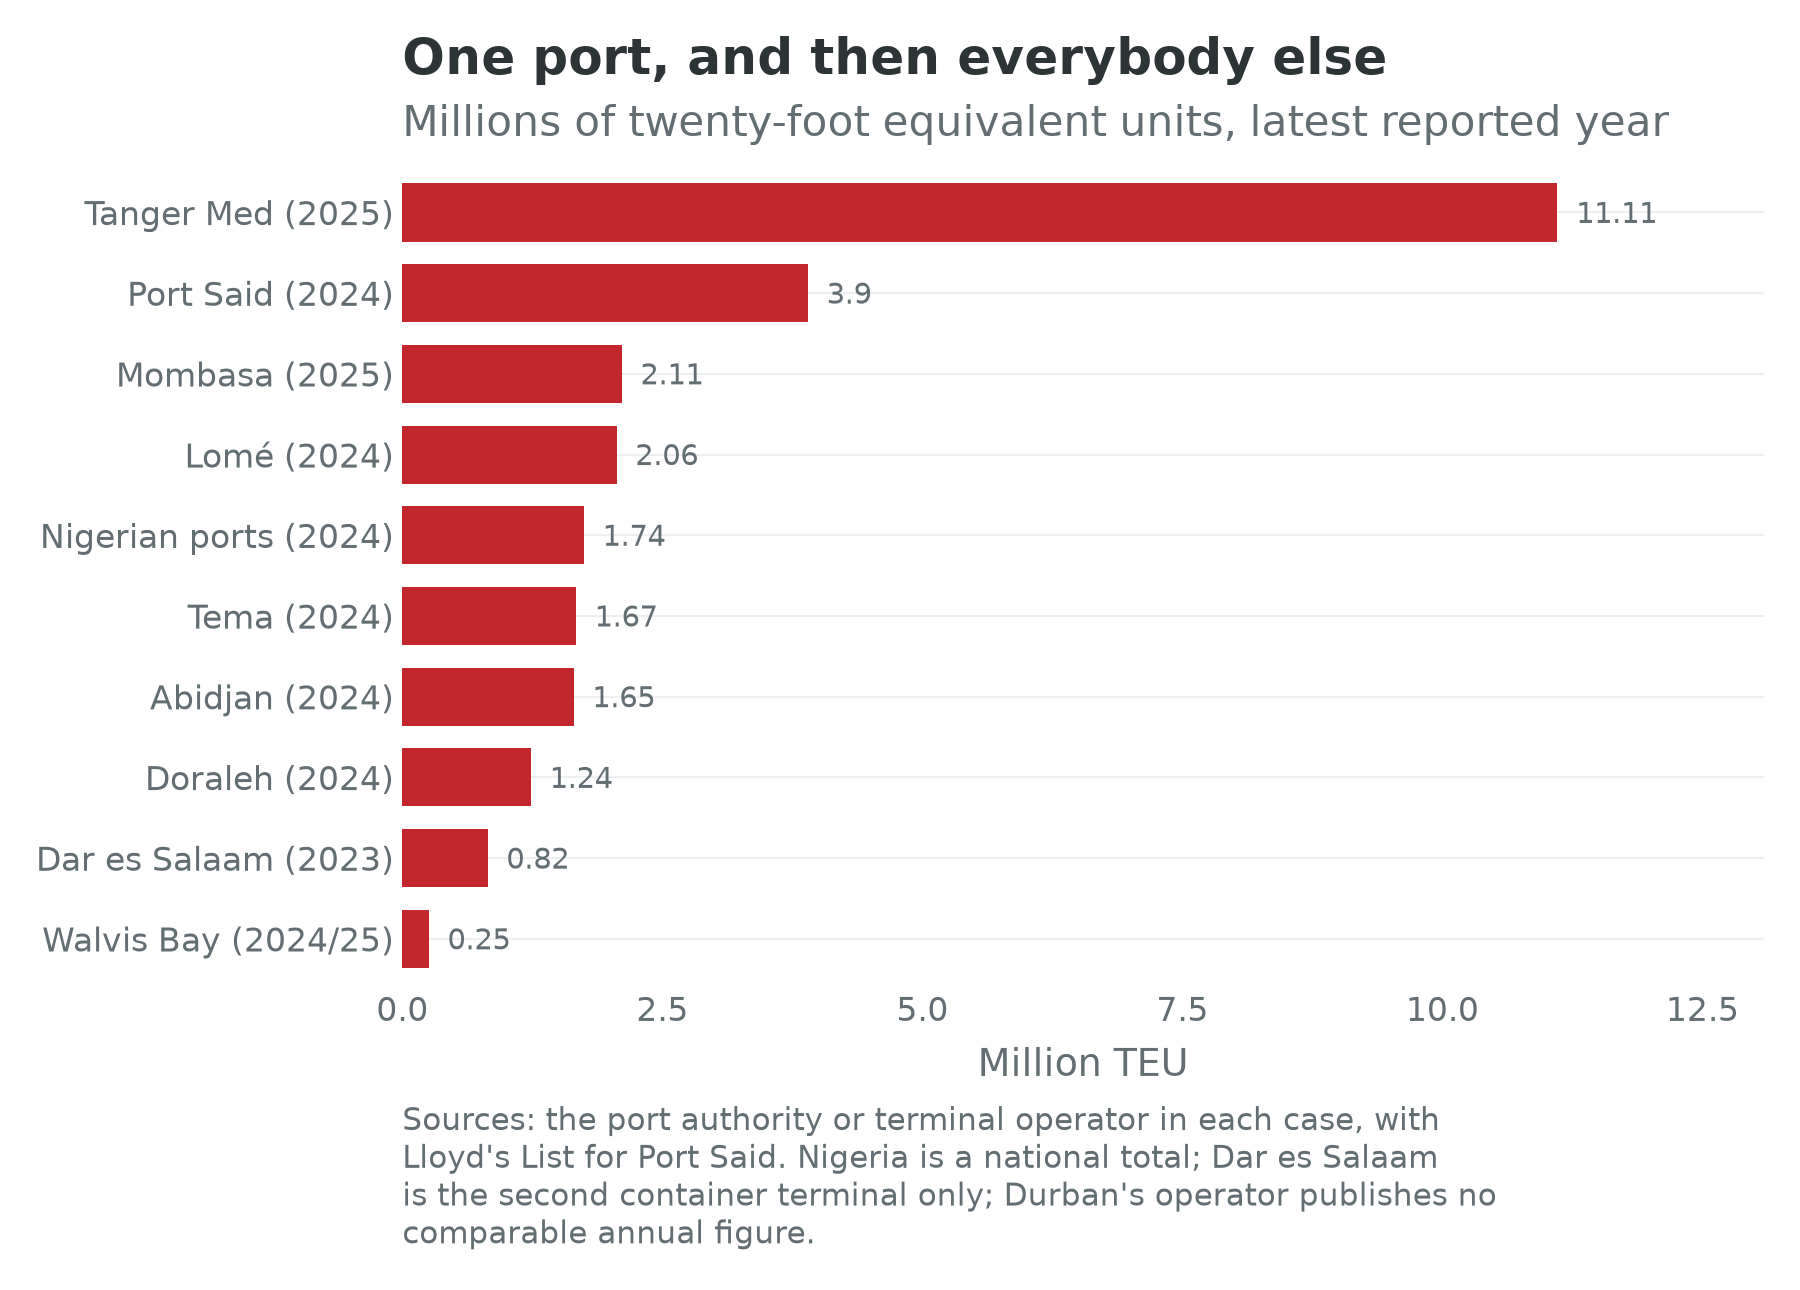
Four African ports appear in the industry’s table of the world’s hundred largest container ports: Tanger Med at seventeenth, Port Said at fifty-third, Alexandria at ninetieth and Lomé at ninety-second, on 2024 throughput (Lloyd’s List, 2025). A continent holding 18.6 percent of the world’s people has four of the world’s hundred busiest box ports. Three of the four are in North Africa. The fourth is in a country of 9.5 million people whose port is not a door into an economy at all: it is a place where boxes are moved from one ship to another and sent somewhere else.
Learning Objectives
After reading this chapter, you should be able to:
- Say where logistics sits in the book’s identity, and explain why a day of delay is a productivity number rather than an inconvenience.
- Describe how a container actually moves: the shipping line and its alliance, the terminal concession, the customs broker and the single window, the dwell time, the truck.
- Distinguish a transshipment hub from a gateway port, and say what each is worth to the country whose flag flies over it.
- Read the concession model: who brings the capital, who holds the pricing power, and what a state gives up when the concessionaire also owns the ships.
- Judge a corridor from transit times, dwell times and volumes rather than from its groundbreaking ceremony, and say what the evidence on trade costs can and cannot support.
Prior work: the corridor evidence, the four-corridor comparison, the rules of origin, the informal cross-border trade and the mirror-statistics problem are set out at length in the companion volume, The New Regional Economics, chapters 12 to 15 (Wilse-Samson, 2026). This chapter cites that material rather than repeating it, and adds what the volume does not have: the ports as an industry, the identity arithmetic, and the concession as a balance-sheet object.
One division of labour first. The growth-pole chapters own the places and Chapters 7 and 8 the regional architecture and the payment rail; this chapter owns the sector, meaning the lines, the terminal operators, the concession contract, the trucking industry and the trade costs.
1. Overview
Logistics does not appear in the national accounts as itself. Transport and storage are a few percent of measured output, and on that share the sector would deserve a paragraph. It gets a chapter because it is an input to everything else: the price of moving a tonne of anything decides which farms can sell, which factories can source and which firms face competition at all. On this continent that price is unusually high. Infrastructure gaps in transport, energy and communications put African trade costs on the order of 50 percent above the global average, a tax on every tradable activity in Chapters 11 to 18 (UNCTAD, 2024a).
Where the sector sits in the identity
The book’s identity says that GDP growth is approximately the growth of output per worker, plus the growth of the employment-to-working-age ratio, plus the growth of the working-age population. Logistics touches the first of those hard, the second lightly, and the third not at all.
| Identity term | What this sector does to it |
|---|---|
| Term one: working-age population | Nothing. Ports do not make people |
| Term two: employment-to-working-age ratio | Small directly. Trucking and clearing employ far more than the terminals and are far worse measured; the informal cross-border traders are counted worst of all (Chapter 6) |
| Term three: output per worker | The whole of the sector’s claim. Transit time and reliability enter the cost of every tradable good, and bind hardest on small consignments |
The three terms are annual growth rates throughout, as Chapter 1 requires. The middle row’s measurement problem is Chapter 10’s subject and the informality half of it is Chapter 6’s.
The term-three channel is not something this chapter has to establish from scratch. Chapter 24 finds the binding constraint on the Lagos to Abidjan pole to be the cost of being a city the grid and the port cannot serve, and Chapter 30 finds the Copperbelt’s to be the cost of moving ore two thousand kilometres by road.
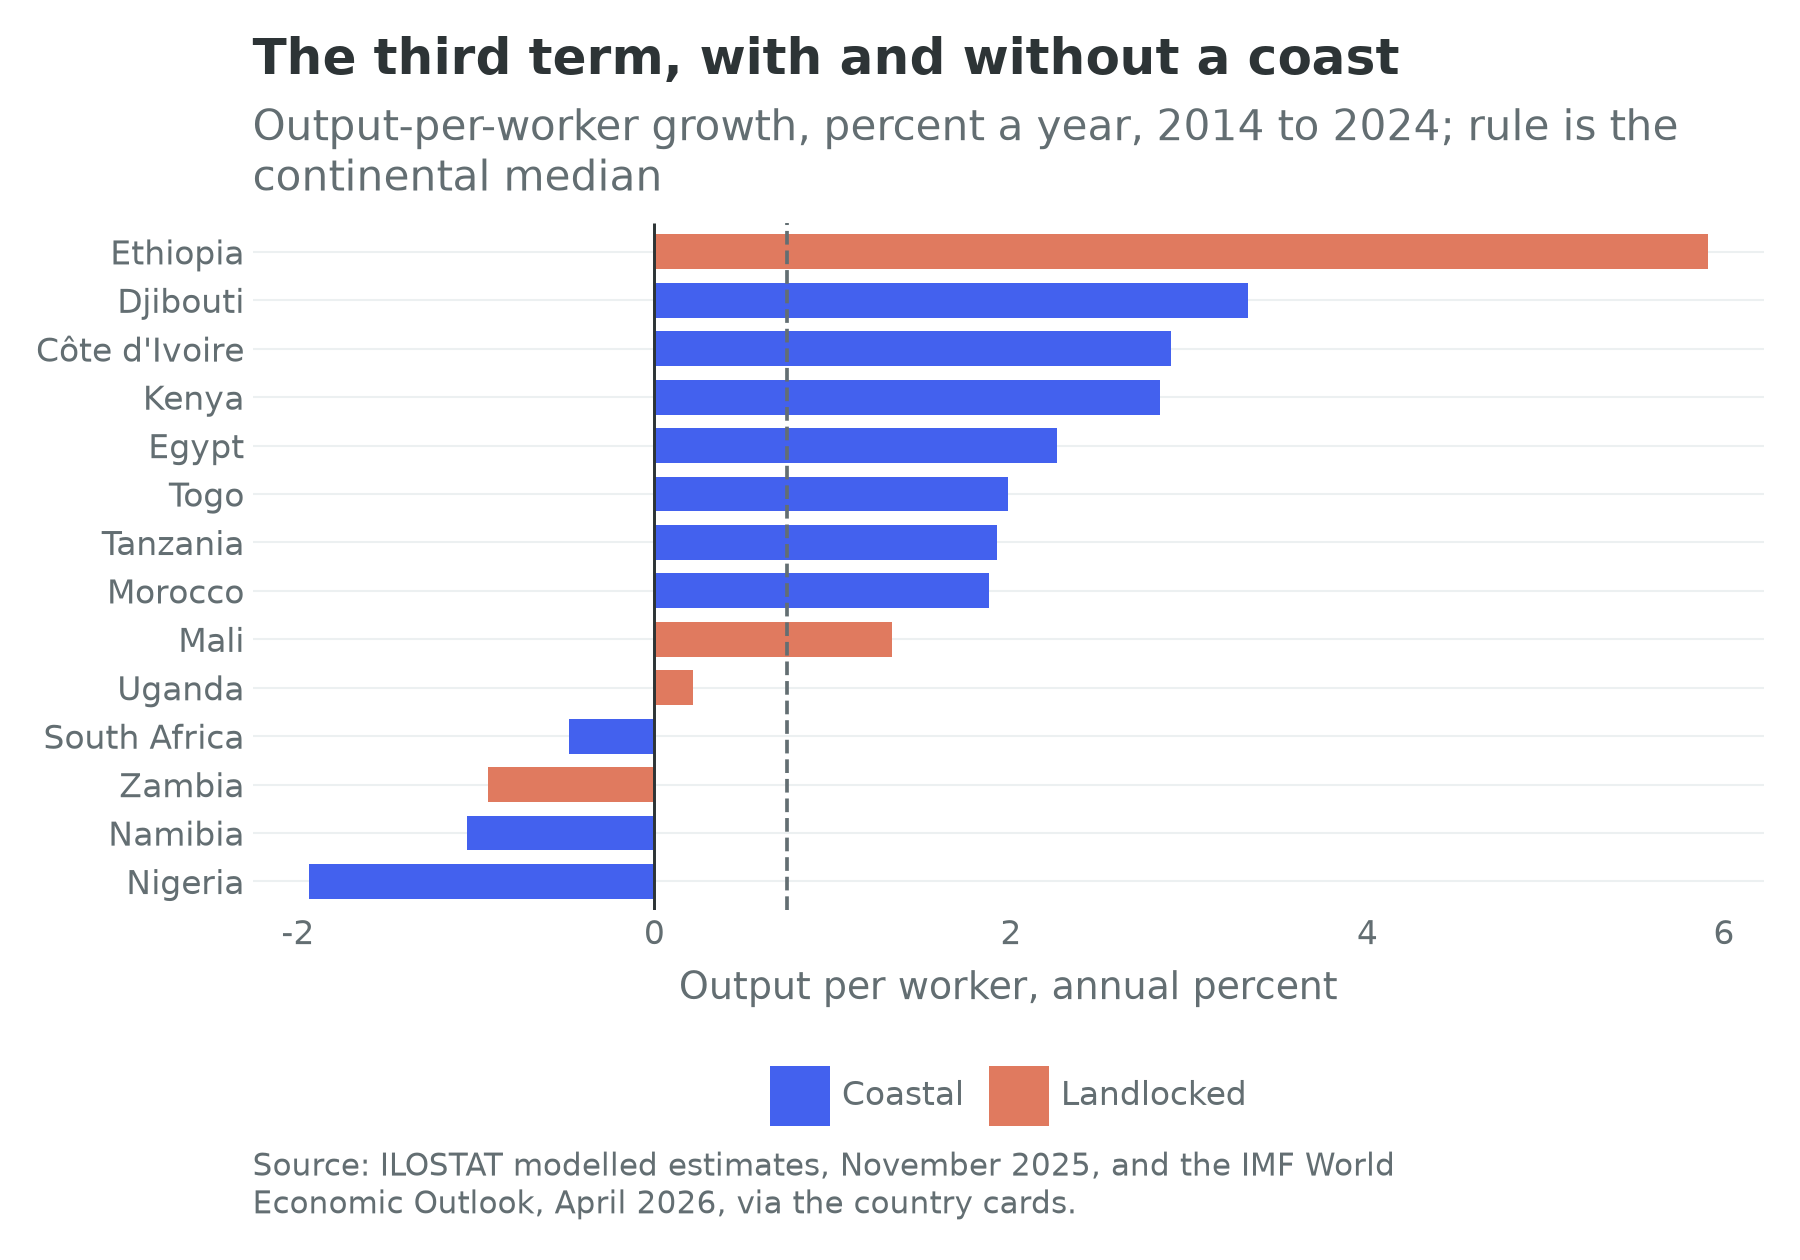
The chapter’s fourteen countries are the port states it discusses and the landlocked ones whose trade runs through them. Together they hold 56.2 percent of Africa’s people and produce 59.0 percent of its output.
| Country | Sea access | Term one | Term two | Term three | Wage employment (percent) | Non-agricultural employment (percent) | Confidence |
|---|---|---|---|---|---|---|---|
| Morocco | coastal | 1.10 | -0.45 | 1.88 | 59.6 | 71.7 | high |
| Egypt | coastal | 1.96 | 0.07 | 2.26 | 72.9 | 82.0 | high |
| South Africa | coastal | 1.61 | -0.45 | -0.48 | 82.7 | 94.6 | high |
| Nigeria | coastal | 2.90 | 0.29 | -1.94 | 13.6 | 65.9 | low |
| Kenya | coastal | 2.94 | -1.17 | 2.84 | 35.1 | 53.5 | high |
| Tanzania | coastal | 3.55 | 0.03 | 1.92 | 14.5 | 34.9 | medium |
| Djibouti | coastal | 2.28 | -0.20 | 3.33 | 48.7 | 98.8 | medium |
| Togo | coastal | 2.74 | 0.02 | 1.98 | 23.0 | 61.7 | medium |
| Côte d’Ivoire | coastal | 2.88 | 0.11 | 2.90 | 28.7 | 53.7 | medium |
| Namibia | coastal | 2.64 | -0.37 | -1.05 | 63.2 | 77.4 | low |
| Ethiopia | landlocked | 3.46 | -1.58 | 5.91 | 15.4 | 39.0 | low |
| Zambia | landlocked | 3.70 | 0.59 | -0.93 | 27.9 | 44.7 | medium |
| Uganda | landlocked | 4.17 | 0.33 | 0.22 | 19.3 | 34.6 | medium |
| Mali | landlocked | 3.54 | -0.72 | 1.33 | 23.1 | 36.5 | medium |
| Continental median | 2.89 | -0.15 | 0.74 | 31.0 | 59.0 |
Terms one to three are annual growth rates in percentage points over 2014 to 2024; the last three columns are shares and a flag. Term one is the working-age population aged 15 to 64, term two is modelled employment aged 15 and over divided by that population, term three is the residual output-per-worker series. The median row is taken column by column across the cards and is not a country. Sources: UN World Population Prospects 2024, ILOSTAT modelled estimates (November 2025) and the IMF World Economic Outlook (April 2026), via the country cards.
Access to the sea is visible in the cross-section, but not in the way a corridor economist would like. Across all fifty-four cards the sixteen landlocked states have a median third term of 0.23 percent a year against 1.04 for the thirty-seven coastal states carrying the series, and a median income per head of $1,147 against $2,481. Their median first term is faster, 3.13 percent a year against 2.81, the uncomfortable pairing this book keeps finding: the fastest-growing populations sit behind the highest transport costs. And yet the highest third term in Table 19.1 belongs to Ethiopia, which has no coast, and the lowest to Nigeria, which has four ports. Geography is a cost, not a destiny. Note also Djibouti and Togo, whose economies are most nearly a port: Djibouti’s non-agricultural employment share of 98.8 percent is the highest of the fifty-three cards carrying the overlay, and Togo’s second term is flat at 0.02 percent a year.
One warning. The cards carry a country’s top three exports and UNCTAD’s commodity-dependence share, and nothing on partners or routes. The share is the trade chapter’s starting fact: its median across the fifty-four is 90.6 percent, and 46 countries are at 60 percent or more. Every statement here about where Africa ships, and by which corridor, comes from a named external source.
2. How the industry works
The line and the alliance
Start at sea, because the sea is where the pricing power is. A handful of lines, mostly European and Asian, operate the deep-sea services, cooperating through vessel-sharing alliances that pool ships on the main east to west trades. No African trade lane is a main trade lane: African ports are served by feeders off the main strings, or by direct calls a line will make only if the volume justifies the deviation. The freight rate on a box from Shanghai to Lagos is not set in Lagos.
Two implications follow, running in opposite directions. African shippers are price-takers on ocean freight, and rates on their routes are volatile in ways they cannot hedge. But a port that attracts a main-line call captures a rent, because every feeder in the region then has a reason to come to it. That rent is the transshipment franchise, and it is the most lucrative thing a small African coastal state can own.
The hub and the gateway
A gateway port serves a hinterland. Its boxes are landed, cleared and taken inland to a market; its throughput is roughly proportional to the economy behind it, its bottleneck is usually on the land side, and it employs customs officers, brokers, truckers and warehouse workers. A transshipment hub serves other ports. Its boxes are lifted off one ship and onto another and never enter the country; its throughput has almost nothing to do with the local economy, its bottleneck is crane productivity, and its employment is small, skilled and inside the terminal. It earns handling revenue and, if the state negotiated well, a concession fee. The distinction is the most useful in this chapter and the most often elided.
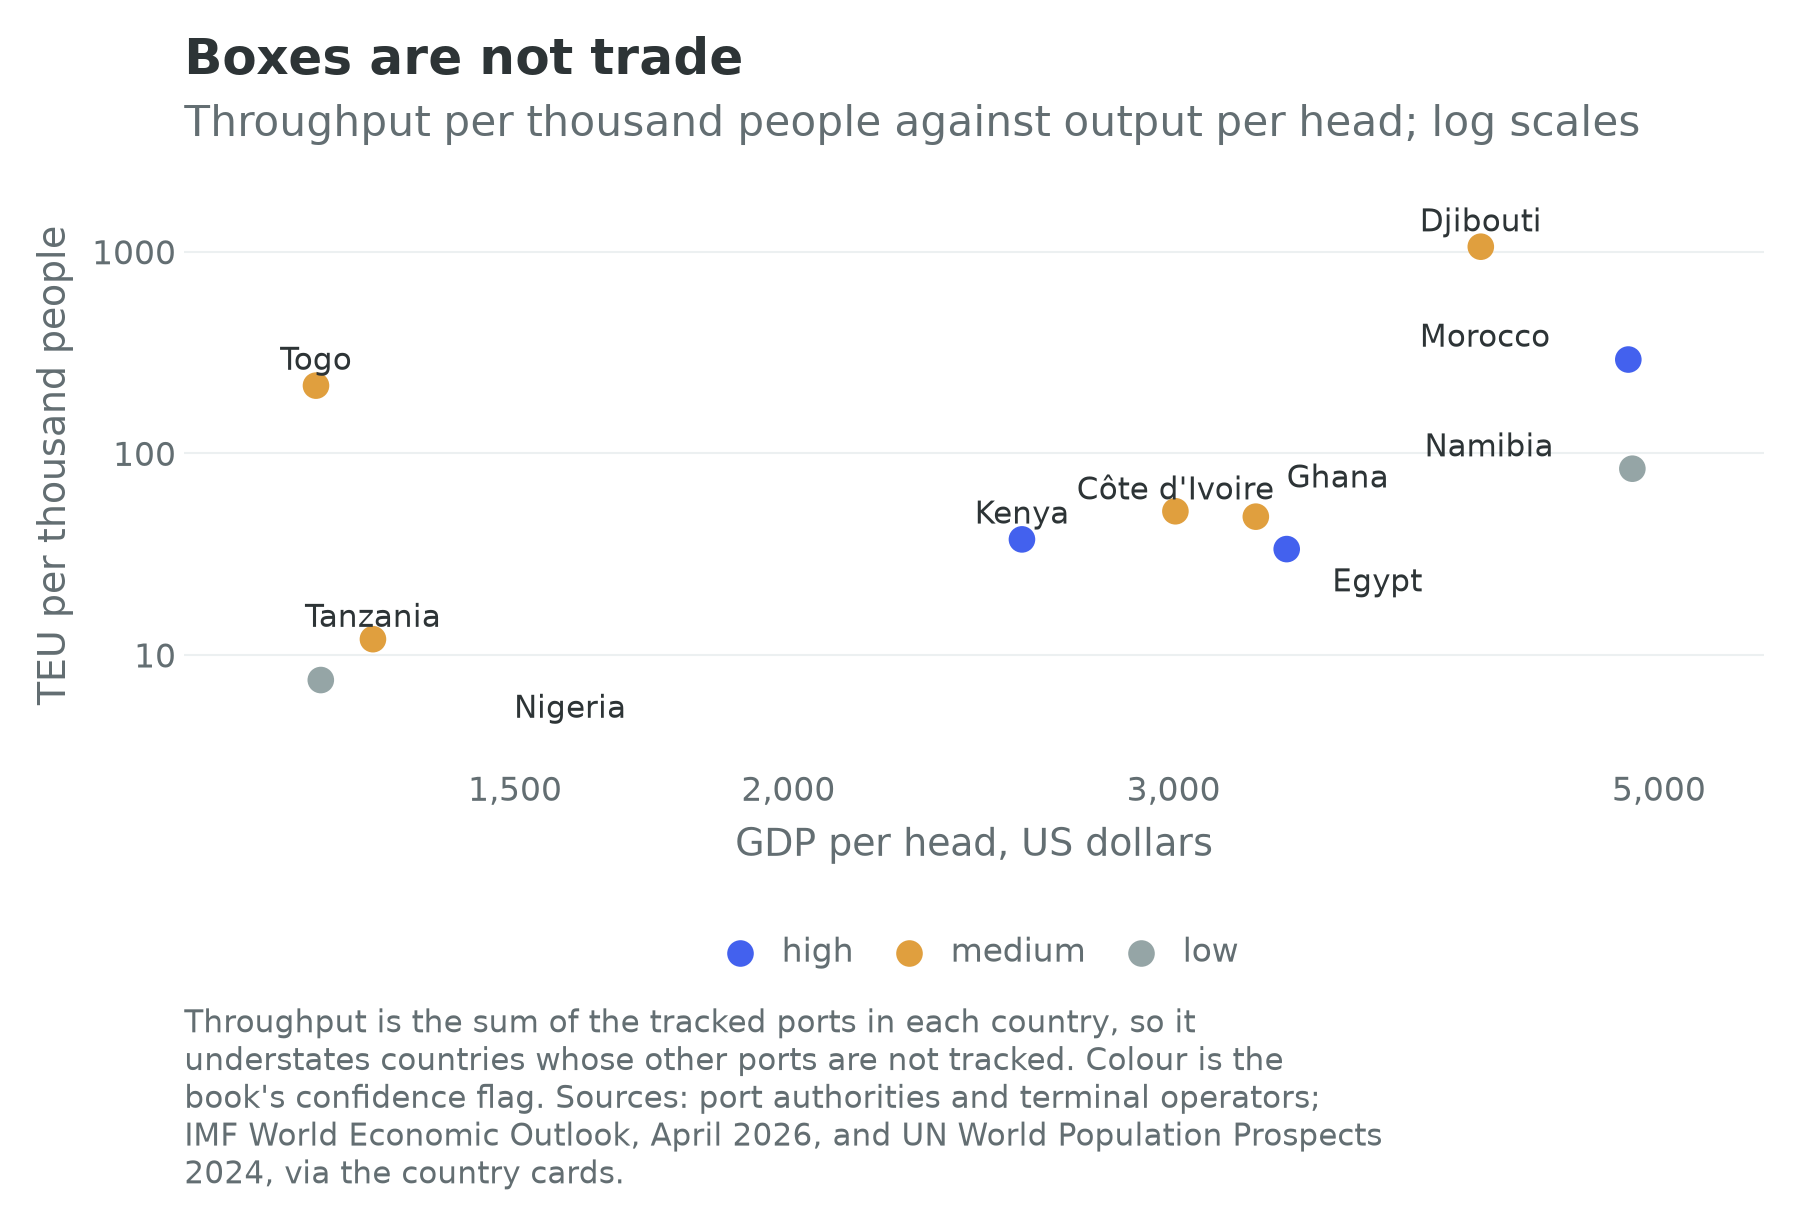
The two regimes separate cleanly. Djibouti moves over a thousand containers a year for every thousand of its people and Togo over two hundred; Nigeria moves fewer than eight and Tanzania about twelve. Nobody believes a Djiboutian consumes a hundred and forty times as much imported manufactures as a Nigerian: those boxes are Ethiopian, Sahelian and Nigerian cargo passing through, plus boxes that never touch land. Throughput measures a franchise, not a standard of living, and much commentary on African port performance mistakes the one for the other.
The concession, and the landlord
Almost every container terminal of consequence in Africa is operated under a concession. The model, which the industry calls the landlord port, splits the asset in two: the state, through a port authority, keeps the water, the land, the breakwaters and the channel and remains the regulator, while a private operator finances the cranes, the yard, the software and the labour, runs the terminal for twenty to thirty years, pays a fee per box or a share of revenue, and hands the facility back at the end.
The case for it is mostly correct: the difference between a well-run and a badly run terminal is a factor of two or three in boxes moved per hour, and concessions brought that capability to African quays faster than public procurement was going to. The case against is about pricing power, and it has sharpened as the operators have consolidated. When a terminal operator is independent it competes for the lines’ business and the shipper benefits. When the operator is owned by a shipping line, one firm sets the freight rate, chooses which port to call at and prices the handling, and a port authority negotiating with it is negotiating with the only bidder that matters. Two contractual details then decide whether a concession serves the country: the exclusivity clause, since forbidding a competing terminal for the whole term hands the operator a monopoly on the country’s trade, and the tariff mechanism, meaning whether handling charges are capped, indexed, or set by the operator subject to a regulator who may lack the capacity to review them.
What actually happens to a box
The water side is the part that works. Follow a container of imported machinery landed at an African gateway and the delays are almost all on land.
The ship’s agent files a manifest before arrival. The importer’s clearing agent, a licensed customs broker, lodges a declaration, increasingly through a national single window, an electronic system that takes one submission and distributes it to customs, the port, the standards bureau, the health inspectorate and the central bank’s foreign-exchange desk. Where it works it is the highest-return reform in this chapter, because it replaces a dozen counters with one screen; where it works badly it adds a screen to the dozen counters. Customs then chooses a channel: green for release on documents, yellow for a documentary check, red for physical inspection. The share sent to red is a good indicator of an administration’s confidence in its own risk engine, and in much of Africa it is high, which means containers are opened, stripped and repacked, which takes days.
Meanwhile the box occupies yard space. Dwell time, the interval between discharge and gate-out, is the number to watch: a few days at an efficient port, well over a week at a congested one. Long dwell is not only a delay. It is a storage charge, it fills the yard so the next ship waits at anchor, and it turns the terminal into a warehouse. Then comes the truck, and with it the gate queue, the axle-load weighbridge, the roadblocks inland and the border if the cargo is in transit; Chapter 24 describes the Apapa approach roads and Chapter 30 the queue at Kasumbalesa.
No single actor owns that chain. The line owns the ship, the operator the crane, the authority the land, customs the release, the broker the paperwork, and an owner-driver with one truck the last three hundred kilometres. A reform that fixes one link buys very little, which is why Chapter 7’s finding about border posts, that the building is a fifth of the intervention and the joint procedures are the rest, generalises to the whole sector.
Inland: the dry port, the railway and the truck
The dry port, or inland container depot, is the standard answer to a congested coastal yard: an inland facility, usually at a railhead, to which boxes move under customs bond and where clearance happens. Where the link to it is reliable and customs will genuinely clear there, as at the Kenyan railhead in the Rift Valley that Chapter 26 describes, it changes a corridor’s economics; where the link is unreliable it becomes an expensive place to store empty boxes.
Rail is the largest capital question in African logistics and the one on which this book is most cautious. It beats road decisively on bulk over long distances and loses on small consignments over short ones. The standard-gauge programmes were built on the first proposition and have had to live with the second: a railway needs volume, volume needs shippers, and shippers need a service more reliable than the trucking they already use. Chapters 26 and 29 carry the instructive cases and Chapter 30 the two ore corridors where the arithmetic is most favourable, ore being the cargo railways were invented for.
Trucking is what actually moves African freight, and it is overwhelmingly informal: small fleets, ownership fragmented among owner-drivers and family firms, expensive short-tenor finance, old vehicles, and a return leg frequently empty for want of an exchange on which to find a backhaul. Every one of those raises the cost per tonne-kilometre and none is fixed by building a road (Benjamin and Mbaye, 2012).
Air, parcels and the money
Air freight carries the high-value and perishable trade: Kenyan cut flowers into Europe, pharmaceuticals, electronics and express parcels. It is a small share of weight, a large share of value, and the one channel in which an African carrier is a genuine global competitor, since the Ethiopian flag carrier’s cargo arm is among the largest freight airlines outside the main manufacturing regions. E-commerce logistics is the attempt to build a parcel network on top of all this, and it has been harder than its promoters expected for reasons that are the whole of this chapter: no addresses, expensive last-mile delivery, and customs regimes designed for containers rather than envelopes.
Trade finance stops a shipment before it is loaded. An importer needs a letter of credit, and an African bank needs a correspondent to confirm it. The African Development Bank puts unmet demand at between $74 billion and $92 billion in 2024, about 5.4 percent of merchandise trade, with commercial banks intermediating about 23 percent of trade over 2020 to 2024 against about 40 percent before the pandemic, and rejection rates for small and medium firms around 37 percent (African Development Bank, 2026d). Behind it sits the correspondent-banking retreat of Chapter 8, in which large international banks exited small relationships because the regulatory cost of a mistake exceeded the profit (Rice, von Peter and Boar, 2020). The binding logistics constraint on a small African importer is often not the port. It is that nobody will confirm her letter of credit.
3. Industry structure
The global terminal operators
Five or six groups run most of the African container quays that matter, and their identities have changed more in the last five years than in the previous twenty. DP World, of Dubai, has terminals, concessions or announced projects at Sokhna, Dakar, Berbera, Luanda and Banana, as well as a share in the consortium holding the Maputo concession (The East African, 2022; The Maritime Executive, 2024). APM Terminals, the terminal arm of the Maersk group, operates the container terminal at East Port Said, a terminal at Apapa, and shares of the Tema joint venture and the Tanger Med complex. Mediterranean Shipping Company, the world’s largest container line, arrived at scale in 2022 by buying a colonial-era trading house’s African logistics arm and now controls terminals, agencies and inland depots across the continent. CMA CGM, the French line, holds the second container terminal at Abidjan and the operating role at the new deep-water port east of Lagos. China Merchants Port Holdings and other Chinese state-linked groups hold stakes at Doraleh, Lomé and Lagos. International Container Terminal Services, of Manila, and Adani Ports with AD Ports of Abu Dhabi are the newer entrants, the second pair having taken a thirty-year concession over the main container terminal at Dar es Salaam in 2024 through a joint venture that also bought the incumbent operator (Adani Ports and Special Economic Zone, 2024).
Africa’s container quays are therefore operated by firms domiciled in the Gulf, in Europe, in China and in India, and increasingly by firms that also own the ships calling at them. That is the balance-sheet lens applied to infrastructure: the asset stays in the country, the control and the margin do not.
The African operators
Transnet, in South Africa, is the only large vertically integrated state freight logistics company on the continent, owning the ports, the terminals and the freight railway; it is profiled in Section 9. Against it stand the landlord authorities that concession and regulate: the Kenyan, Tanzanian, Nigerian and Ghanaian port authorities, the Port Autonome d’Abidjan and Morocco’s national ports agency, with varying capacity to hold an operator to its contract (Nigerian Ports Authority, 2025; Ghana Ports and Harbours Authority, 2025). The capability that matters in a concessioned port is contract management, and it is scarce. Djibouti’s ports and free-zones authority is the third form, the port state as a business model: a state whose principal export is the use of its coastline and whose national accounts are a logistics profit-and-loss statement.
Below the terminals sits a fragmented industry of clearing and forwarding agents whose value added is knowing which official to see. The late 2010s brought venture-funded digital freight brokers promising to match shippers with trucks and squeeze that intermediation, of which Kobo360 in Nigeria and Lori Systems in Kenya were the best known; neither produced a durable large firm and both retrenched as venture funding tightened. The instructive point is not that the startups failed. It is that the constraint they attacked, matching cargo to trucks, was a smaller share of the cost than the constraints they could not attack: the border, the roadblock, the fuel price and the cost of capital for a man who wants a second truck.
4. Geographic distribution
Africa’s logistics geography is a set of gateways with corridors behind them, and this chapter marks them for the Growth Pole Map: the container ports, the inland depots and the one-stop border posts it names.
The Mediterranean and Suez gateways are transshipment plants: Tanger Med and Port Said between them handle more containers than every port south of the Sahara combined, and neither principally serves a hinterland (Lloyd’s List, 2025). The terminal at East Port Said completed a $500 million expansion adding about 2.2 million TEU of annual capacity, taking the facility to about 7 million (APM Terminals, 2025). The West African range, from Dakar through Abidjan, Tema, Lomé, Cotonou and Lagos, competes for two prizes, the domestic market behind each port and the Sahelian transit trade behind all of them; these ports substitute for one another to a degree the East African ports do not, which is why West African port investment is a competitive game and East African port investment a bilateral negotiation with a hinterland. The East African gateways, Mombasa and Dar es Salaam, each serve a fan of landlocked markets and carry the best documented reform record on the continent, and the Horn is the most concentrated dependence in the book, a landlocked country of 132.1 million people whose trade runs almost entirely through one neighbour of 1.2 million. The Southern African system is the only one built around a state-owned integrated railway rather than a concessioned port, with a western hedge at Walvis Bay and an Atlantic route out of the Copperbelt.
Behind them are the sixteen landlocked African states, whose transport costs are set by their neighbours’ administrations and whose trade policy is therefore substantially somebody else’s (United Nations Office of the High Representative for the Least Developed Countries, 2025).
5. Workforce
Logistics employment has three tiers. The terminal tier is small, capital-intensive and comparatively well paid: a terminal moving a million boxes a year employs on the order of a thousand people directly, and automation reduces that over time. These are exactly the wage jobs Chapter 10’s overlay is trying to count, and a country cannot employ its youth cohort in a port. The clearing and forwarding tier is larger, urban and formal only at the top, and it is the most exposed to reform, because a single window that works eliminates a category of intermediary whose function was navigating the absence of one. That is a productivity gain and a job loss at once, and a chapter that celebrates the first without noting the second is not being straight with its reader.
The road tier is by far the largest and the worst measured. Drivers, loaders, mechanics, agents at the truck stops, the informal economy of a border town: these are the people African logistics actually employs, and almost none appear in an establishment survey. Chapter 6 owns that measurement, and the figure to hold is the wage-employment column of Table 19.1: 13.6 percent in Nigeria, 14.5 percent in Tanzania and 15.4 percent in Ethiopia, against 82.7 percent in South Africa. Where the ports are busiest and growing fastest, fewer than one worker in six is paid a wage by somebody else. The informal cross-border trade carrying much of regional exchange is conducted overwhelmingly by women and is invisible in every trade statistic used here (UNCTAD, 2019); the reforms with the highest returns for those traders, simplified regimes for small consignments, are the cheapest items in the policy set and the least funded.
The survey base is thin. Of the fourteen countries in Table 19.1, four carry a high confidence flag, seven medium and three low; Côte d’Ivoire’s last labour-force survey was in 2019, Namibia’s in 2018 and Nigeria’s last census in 2006. Djibouti, whose economy is more nearly a single logistics business than any other in this book, has a statistical performance score of 38.1, fourth lowest of the fifty-three scored cards. The country whose national accounts are most nearly a port’s accounts is among those least able to publish them.
6. Regulation and policy
Concession law is the first regime, and it is mostly not a law. African port concessions are governed by individually negotiated contracts, often with confidentiality clauses and arbitration clauses that have proved expensive when a government changed its mind; Chapter 29 records the largest such case. What a country needs is a standard framework with a published tariff mechanism and a regulator with the capacity to audit, and very few have one. Cabotage rules reserve coastal shipping for national flags, and Nigeria’s regime is the most instructive: two decades of reservation and a fund to finance local vessels have produced waivers, delays and rent rather than a merchant marine. Protecting a service industry from foreign competition, without fixing the cost of capital that stops nationals buying ships, produces paperwork rather than tonnage.
Axle-load rules are the least glamorous item in African trade policy and among the most consequential. A road is destroyed by heavy axles at roughly the fourth power of the load, and limits differ between neighbouring states, so a legal truck becomes illegal at a border and the discretion that creates at the weighbridge is a documented site of informal payment. Harmonised limits, jointly enforced, are worth more to a corridor than an extra lane.
Border posts are Chapter 7’s subject and its evidence box the honest summary: a one-stop facility at which both administrations clear traffic once can cut clearance from days to hours, and the gains erode where the building is delivered and the joint operating procedures are not (AfDB, JICA and NEPAD, 2016). The continental agreement’s transit annexes create, in principle, a regime under which goods move on a single guarantee, but the binding items remain the rules of origin, the tariff schedules and the willingness of a customs service to release revenue it collects. The World Trade Organization’s Trade Facilitation Agreement matters less for its legal force than for its architecture, which lets a country schedule its own commitments and attach donor financing to them, and has made it the framework under which most African single-window projects were funded.
Sanctions are the regime nobody plans for: compliance is enforced through the dollar clearing system and reaches into African ports through the banks and insurers rather than the customs service, so a terminal can be technically excellent and still find its shipper cannot get paid. Chinese port finance gets one sentence, because Chapter 32 owns it: the debate has two halves usually conflated, a commercial one about interest rates, tenors and collateral, and a strategic one about whether a commercial port becomes a naval asset, which is a question about one facility in Djibouti and is not answered by the loan documents.
7. Recent trends
The Red Sea, and what a chokepoint is worth. From late 2023 attacks on shipping in the southern Red Sea pushed most container lines off the Suez route and around the Cape of Good Hope. Canal revenues fell by more than 60 percent in 2024, a loss the president put at about $7 billion (Reuters, 2024). The diversion adds roughly seven to fourteen days to an Asia to Europe voyage, and the major alliances rebuilt their networks around the Cape rather than treating the detour as temporary.
Two lessons follow. A chokepoint rent is not an entitlement: Egypt’s canal revenue is a claim on a routing decision made by foreign shipowners and can be withdrawn in a quarter. And the shock was not symmetrical for Africa: it hurt Egypt badly, helped nothing in East Africa, where Red Sea calls became dearer to insure, and delivered a windfall of bunkering and repair business to the southern African ports on the new route, which those ports were only partly able to serve.
Consolidation, and connectivity from a low base. The purchase of a continental logistics network by a shipping line in 2022 and the arrival of Indian and Emirati operators at Dar es Salaam in 2024 are the structural events of the decade here, and both were transactions between foreign parties over African assets (Labrut, 2022; Adani Ports and Special Economic Zone, 2024). Meanwhile container-ship calls at African ports rose by about 20 percent between the first half of 2018 and the first half of 2023 and tanker calls by about 38 percent; liner shipping connectivity improved by about 10 percent between June 2024 and June 2025; and developing Africa’s share of world container port traffic was about 5 percent in 2024 (UNCTAD, 2024b; UNCTAD, 2025b). The direction is right and the level is the story: a fifth of the world’s people, a twentieth of the world’s boxes. Against it, the African Development Bank projects the trade-finance gap widening to between $86.6 billion and $102.6 billion by 2027 (African Development Bank, 2026d).
The sector in the book’s two worlds
In the labour-abundant world this sector decides whether the rest of Part III happens. A garment plant in Ethiopia or an auto supplier in Morocco competes on delivered cost against a plant in Vietnam with a better port, and the difference is very largely logistics. Every point taken off transit time is a point on the third term, and the reforms are known, cheap and unglamorous: joint border procedures, a working single window, harmonised axle loads, a competitive second terminal, a trucking industry that can borrow. Nothing in this chapter’s policy list requires an invention.
In the labour-redundant world the sector does not disappear, it changes composition, and the container of ore matters more than the container of shirts. If the continent’s role in a compute economy is to supply minerals, electricity and land, as Chapters 1, 13 and 14 develop, the logistics that matters is bulk: rail to a mine, a berth deep enough for a Capesize, a smelter that cuts the shipping weight. That is the Chapter 30 corridor rather than the Chapter 24 one, and it employs very few people. The transshipment hub is then the most exposed asset here, because its value depends on a network of manufacturing trade whose volume is exactly what a compute economy might not need to grow. What survives is the part of the architecture carrying electrons and rules rather than goods, which is Chapter 7’s conclusion reached from the quayside: a cable landing station is a port in the second world, and Chapter 17 owns it. If that world arrives, the continent will have spent this decade’s capital on the right assets for the wrong century, and the ore terminals will be the part that keeps its value.
8. Climate exposure
Ports are at sea level. Every asset in this chapter sits within a few metres of it, most on reclaimed or low-lying land beside a city that is also on it. Chapter 26 works through the East African gateway’s exposure in detail, and the arithmetic is not peculiar to Mombasa: Lagos, Abidjan, Alexandria and Dar es Salaam all combine a low-lying port, a large adjacent population and a subsidence problem. The economic point is asymmetry. A country with several ports can lose one; a country with one port and a landlocked customer runs a corridor with no redundancy at all.
The chokepoints are climate objects too. Suez is a political and security chokepoint, as Section 7 showed; the Panama Canal is a hydrological one, since its locks run on fresh water from a rainfall-fed lake and drought has repeatedly cut daily transits. The alternative to both runs past Africa, a strategic fact the continent’s port planners have begun to price and its bunkering and ship-repair industries have not yet captured. Inland, water transport is the mode most directly exposed to rainfall: Chapter 31 describes the Congo river system, where the waterway is the transport network for a territory the size of Western Europe and low water closes reaches of it.
The shipping emissions regime. The International Maritime Organization’s Net-Zero Framework would introduce a global fuel standard and the first legally binding global carbon price for any sector, applying from 2028 at a price in the order of $100 a tonne of carbon dioxide equivalent, with a fund to redistribute the revenue. Its adoption was postponed for twelve months on 17 October 2025 after opposition from the United States, China and several developing economies, with a further vote scheduled for October 2026 (International Maritime Organization, 2026). The African stake is easy to state. A levy raises the freight cost of every tonne shipped, and a continent remote from its markets, shipping heavy low-value commodities and importing its manufactures, pays more of it per dollar of trade than one at the centre of the network. Whether that is a burden or a transfer depends on whether the revenue is recycled to the countries whose trade costs rise, which is what the fund is for and what the negotiation is about. It is Chapter 34’s border-adjustment argument, arriving by sea.
9. Firm profiles
Africa Global Logistics
Africa Global Logistics was Bolloré Africa Logistics until the Mediterranean Shipping Company bought it for about 5.7 billion euros in December 2022 (Labrut, 2022) and renamed it in March 2023. At the renaming it ran more than 250 shipping and logistics agencies, 22 port and rail concessions and 66 dry ports, and employed about 21,000 people across 49 countries (Engineering News, 2023). No African state has a logistics footprint of that reach.
The transaction is the balance-sheet lens in one line: a French colonial-era trading house sold a continental concession portfolio to a shipping line, and the terminals, rail concessions and inland depots changed owner without changing country. It is also the clearest instance of the vertical integration Section 2 warned about, since the group holding those concessions operates the largest container fleet in the world. It means a port authority that negotiated with an independent operator in 2005 finds itself, twenty years later, regulating a subsidiary of its own largest customer. The right question is therefore not whether concessions work, since Lomé, Tanger Med and Abidjan say they can, but what a state keeps: a tariff mechanism it can audit, a term short enough to re-tender, a prohibition on exclusivity, and the capacity to know whether the numbers it is shown are true.
DP World
DP World is the Gulf counterpart, and its African strategy has been different in kind: fewer flagship terminals in the largest economies, more positions in small states and at frontier locations, often bundled with a free zone. Its portfolio includes Sokhna, Dakar and the new deep-water project south of it, Berbera, Luanda, the Banana project on the Congolese Atlantic coast, as well as a share in the consortium holding the Maputo concession (The East African, 2022; DP World, 2025a; The Maritime Executive, 2024).
Two things make it worth a profile. It is a state-owned enterprise of a small Gulf emirate acting as an infrastructure investor across a continent, a form of external partner Chapter 33 takes up, and one that behaves differently from a development bank and a Chinese policy bank alike: it wants a return, it wants throughput, and it will take political risk where multilateral lenders will not. And it supplies the counter-case, since the most expensive port dispute in modern African history is the termination of this group’s Djibouti concession in 2018 and the arbitration that followed, which Chapter 29 records. A concessionaire holding a thirty-year contract over a small state’s only significant asset has great leverage; a small state that takes the asset back discovers the contract was written under somebody else’s law. That case is the strongest available argument for the standard framework recommended in Section 6.
Transnet
Transnet is the profile a chapter on African logistics cannot avoid, because it is the continent’s only example of the alternative model at scale and it has been failing in public. The company owns South Africa’s ports, its port terminals and its freight railway, and it moves the exports of the continent’s most industrialised economy. Freight-rail volumes fell from 226.3 million tonnes in 2017/18 to 149.5 million tonnes in 2022/23 and were about 152 million tonnes in 2023/24 against a 2030 target of 250 million, and Chapter 25 sets out what that did to the economy behind it (Transnet, 2025). Container operations have recovered somewhat: network container volumes rose about 7.1 percent in 2024/25, and the Durban container terminal, which handles about 65 percent of national container volumes, holds a nameplate capacity of 3.6 million TEU rising to 4 million after a berth extension (Transnet, 2025).
Two lessons, and they are not the ones usually drawn. This was not a financing failure: the state has shown it can find very large sums for a state-owned network when it decides to. What it could not do was procure spare parts, retain engineers and run a maintenance regime, and a railway that cannot do those things stops whatever its balance sheet says. And the remedy adopted, in ports and increasingly on rail, is to bring in private terminal operators and open the network to third-party train operators, which is to say that the continent’s largest experiment in state logistics has ended by adopting the model the rest of the continent adopted twenty years earlier. That is not a verdict on ownership but on what happens when a technical monopoly loses the ability to maintain itself.
10. What the evidence says
What the evidence says: trade costs, corridors, and what a border is worth
There is no randomized trial of a port. The unit of treatment here is a corridor, a border post or a customs administration, so the honest label is evidence rather than experiment.
Internal trade costs are enormous, and they are why a continental market is not a market. Atkin and Donaldson (2015) use prices of identical goods at many locations inside Ethiopia and Nigeria to estimate how much of a cost change at the port survives the journey inland. They find intranational trade costs several times higher than in the United States, with pass-through decaying far faster with distance, so a village a few hundred kilometres from a port is, in price terms, in a different economy from the port. Removing a tariff does very little for a producer who cannot reach the frontier, and the continental agreement’s returns therefore depend on the corridors far more than on the schedules.
Transport costs shape where African cities grow. Storeygard (2016) uses world oil prices, interacted with each city’s road distance to its country’s primary port, to identify the effect of transport costs on urban growth across Sub-Saharan Africa: cities farther from the port grow more slowly when fuel is expensive, most so where roads are worst. That is as close to exogenous variation in transport cost as the sector offers, and it says logistics is not merely a tax on trade but a determinant of economic geography.
The comparison case says the gains come from access rather than from track. Donaldson (2018) reconstructs the effect of India’s colonial railways on district trade and real income and finds substantial gains operating almost entirely through reduced trade costs and market access rather than through the infrastructure itself. The African standard-gauge programmes are implicitly betting on that mechanism, and the qualification is that gains accrue where the network reaches a market with something to sell.
Time is a trade barrier, and customs is where most of it is lost. Djankov, Freund and Pham (2010) estimate that each additional day in transit before shipment reduces trade by about 1 percent, concentrated in time-sensitive goods, which is the basis for treating dwell time as a price. Fernandes, Hillberry and Mendoza Alcántara (2021) supply the reform counterpart from outside Africa: an Albanian customs reform that cut the share of consignments sent to physical inspection raised imports through the affected offices with no evidence of revenue loss. That is the cleanest available evidence that risk-based inspection is not a trade-off between facilitation and revenue, the objection every African customs commissioner raises first.
What none of it can tell you. All four results concern specific corridors and reforms, and none identifies the effect of a continental agreement or a port concession on output per worker, because no counterfactual continent exists. The evidence supports claims about crossings and corridors, not about continents.
11. From a priority list to a financed asset
A named corridor is not a financed asset, and a remittance is not project equity. That sentence is the whole of this section. The rest is the institutional machinery that makes the three things look like one, and the reasons they are not.
The Programme for Infrastructure Development in Africa is the African Union’s continental filter for regional infrastructure, implemented with AUDA-NEPAD and with the African Development Bank as a recurring partner (AUDA-NEPAD, 2023). It is not a cadastre of everything Africa should build. The first Priority Action Plan ran roughly from 2012 to 2020. The second, PIDA PAP2, covers 2021 to 2030 and is the list the Union now points at: sixty-nine projects, commonly broken down as twenty-five transport, eighteen energy, eleven information and communications, and fifteen transboundary water (AUDA-NEPAD, 2023). Those sixty-nine sit with corridor agencies and national sponsors. Midterm reporting has been explicit that the binding work is early-stage preparation rather than a shortage of named priorities, and that net advancement is uneven by sector (AUDA-NEPAD, 2024). Many remain a concept, a pre-feasibility study or an unclosed offtake. The Growth Pole Map on this site draws schematic waypoints through named cities and border posts. It does not ingest the Virtual PIDA alignments, and it should not be read as a substitute for them.
The architecture around that list is the one a continental meeting will write on a whiteboard: the Union to AUDA-NEPAD, the African Development Bank and the Africa Finance Corporation as the recurring money institutions, corridor agencies underneath. Chapter 7 owns the political half of that stack. What belongs here is the quieter fact that a priority on that list is a nomination, not a claim a pension trustee can hold.
The stack that can actually clear a frontier is short and familiar. The African Development Bank is the continental multilateral and a recurring source of preparation capital. The Africa Finance Corporation is a principal investor rather than a sovereign prep shop. The Development Bank of Southern Africa is a regional development-finance institution with a southern-corridor footprint, already visible in the Lobito debt package Chapters 30 and 33 record. South Africa’s Industrial Development Corporation sits in the same national-DFI family on the industrial side. Beside them sit Africa50, Afreximbank, the European bilaterals, the American development finance corporation, and guarantee shops of the MIGA and GuarantCo class. A September 2026 New York roundtable put AFC and the IDC on a digital-economy panel in those capital-mobilisation and industrial roles; that is programme colour, not a claim that the panel finances PIDA. Chapter 16 has already said why those names, rather than a bank or a pension fund, are the marginal long-dated lenders.
Blended first-loss, grants for preparation and partial risk guarantees are the instruments that turn a wish into a term sheet. They are also the instruments that crowd into the same few bankable assets. Domestic pension funds and sovereign-wealth vehicles exist, and Chapters 16 and 37 have already said where they sit: on government paper, because the rules and the rated claims both point there. A design in which those pools, a diaspora sleeve and a development bank jointly own a cross-border asset is a design. It is not a product this book can point at.
One American rail is worth naming because it is so often misread as a fund. Prosper Africa is an interagency deal-facilitation platform: market intelligence, transaction support, and a path into United States government finance tools (Millennium Challenge Corporation, 2025). It is not itself a mega-fund, and it will not underwrite PIDA. Chapter 33 carries that teaching beside Global Gateway, which has the same shape at European scale: a mobilisation target, not a budget. The African Diaspora Finance Corporation, sketched in an African Union framework, is a proposed vehicle rather than an operating one (African Union, 2019). Chapter 10 sets the Nigerian 2017 issue and the Ethiopian SEC episode against that proposal, which is as far as the African product list currently runs.
Five frictions, in the order they usually bind.
First, bankability. Capital waits; contracted, revenue-modelled projects do not. A preparation facility is not construction finance, and a midterm review that asks for more early-stage work is saying the sixty-nine are not shovel-ready.
Second, foreign exchange and convertibility. Local-currency revenues against hard-currency debt, with hedging thin and expensive, is the mismatch a cross-border offtake does not dissolve (World Bank, 2023a).
Third, dual-sovereign coordination. Two finance ministries, two offtakers, a corridor agency with weak teeth: the same problem Section 6 and Chapter 7 record at the border post, one layer up. A one-stop building without joint procedures is the domestic version; a dual sovereign guarantee that nobody wants to sign is the regional one.
Fourth, for America-based diaspora capital, onshore compliance. United States persons typically need a registered or exempt offering, full disclosure, and sanctions and anti-money-laundering screening. That preference is necessary and not sufficient. Bankability, foreign exchange and governance usually fail first; a clean wrapper around an unprepared project is still an unprepared project. Chapter 33 states the American half.
Fifth, mobility, lightly. A project that needs counterparties in the same room still meets visa friction. Chapter 7 and Chapter 18 carry the openness numbers; they are an enabler of delivery, not a substitute for a term sheet.
None of this is an argument against the sixty-nine. It is an argument against reading a priority list as a pipeline of claims, and against reading a remittance bar as equity in one of them. Field notes from a September 2026 roundtable in New York record the same architecture as it was spoken in a room: the Union, AUDA-NEPAD, the development banks, the diaspora as a sixth region, and the American compliance wrapper. They are a primary record, kept on this site as notes rather than folded into the textbook voice.
12. Data sources
- Port authorities and terminal operators, by name: Tanger Med, the Kenyan, Tanzanian, Nigerian, Ghanaian, Ivorian, Namibian and Egyptian port authorities, the Djibouti ports and free-zones authority, and Transnet. Every throughput figure comes from one of these rather than a secondary compilation, and each carries its own year because the reporting calendars differ (Namibian Ports Authority, 2025).
- Lloyd’s List, One Hundred Container Ports: the global ranking and the position of the four African ports in it.
- UNCTAD, Review of Maritime Transport, the liner shipping connectivity series and the Economic Development in Africa Report, for port calls, connectivity, Africa’s share of world container traffic and trade costs.
- African Development Bank, Trade Finance Supply in Africa, for the trade-finance gap, and the International Maritime Organization for the Net-Zero Framework.
- AUDA-NEPAD and the Virtual PIDA Information Centre, for the PAP2 portfolio of sixty-nine and its sector split, which Section 11 quotes as a published filter rather than as a register of financial close.
- UN Comtrade and CEPII BACI, named for completeness: this chapter quotes no bilateral flow, because the companion volume’s mirror-divergence finding means an African bilateral flow should never be quoted without both sides (United Nations Statistics Division, 2026; CEPII, 2026).
- Country cards: identity terms, the overlays, population, output per head and the data-quality fields, but no trade composition.
13. Exercises
Connections to Other Chapters
- Chapter 7 owns the continental agreement and the border-post evidence this chapter defers to; Chapter 8 owns the payment rail and the correspondent-banking retreat behind the trade-finance gap.
- Chapters 11 to 13 are the cargo, and Chapter 13’s ore is the freight the labour-redundant world still needs moved; Chapter 15 is the sector whose delivered cost these transit times decide; Chapter 16 owns the banks behind the letters of credit and Chapter 17 the cables that are the second world’s version of a port.
- Chapters 24 to 31 own the places, from Lagos and Lomé through Durban, Mombasa, Port Said, Tanger Med and Djibouti to Lobito, Walvis Bay and the Congo river.
- Chapter 21 and Chapter 37 pick up the capital and playbook half of Section 11: a priority list is not a financed asset, and a remittance is not project equity. The UNGA Week 2026 field notes are the primary record behind that stitch; the Growth Pole Map is where the sixty-nine are named as the official list this book does not draw.
- Chapter 32 owns the port-financing debate, Chapter 33 the Gulf and Indian operators and the American facilitation rail, and Chapter 34 the border-adjustment argument the shipping levy repeats at sea.
Discussion questions
Djibouti moves more than a thousand containers a year for every thousand of its people and Nigeria fewer than eight, and neither number tells you what either country consumes. Write down what you would need to know to turn a port’s throughput into a statement about the economy behind it, then say which of those things is missing for at least half the countries in Table 19.1.
A concession brings capital and takes pricing power, and the operator is increasingly owned by the shipping line whose ships call at the quay. Draft the two clauses you would insist on in a new thirty-year terminal concession, one on tariffs and one on exclusivity, then say how a port authority in a country with a low confidence flag would enforce them. If your answer needs capacity the state does not have, say what the second-best contract looks like.
Suppose a government has money for exactly one of: a new container terminal, a joint border facility with harmonised procedures, or a credit line letting truckers refinance their fleets. Argue for one, using the evidence in Section 10, and state the observation before 2035 that would show you had chosen wrongly.
Try it
Open the country cards and put Djibouti, Togo and Nigeria side by side in the compare view. Read down the identity block, then the overlays, then the data-quality block. Two of these are small states whose principal industry is other people’s cargo; one is a continental giant with the lowest third term of the fourteen countries here. Write one paragraph on a single question: which would you expect to have the highest output per worker in 2050, and which field on the cards, rather than which sentence in this chapter, is doing the work in your answer? Then open the Growth Pole Map, switch on the ports and border-posts layer, and turn the confidence toggle on. The layer plots the ports, dry ports and one-stop border posts this chapter names, Doraleh and Lomé among them; note what happens to Nigeria, which has six of them.
Data exercise
Download all fifty-four cards from the country cards page on this site as cards.csv or cards.json, and take the chapter’s port-throughput data file beside it. Build a table with identity.output_per_worker_growth, identity.working_age_pop_growth, scale.gdp_per_capita, scale.population and data_quality.confidence_flag, then do four things. First, reproduce the landlocked comparison in Section 1: mark the sixteen landlocked states and compute the median third term and median income per head for each group. Second, join the throughput file to the cards, compute containers per thousand people, rank the result, and identify the two countries whose rank on that measure is furthest from their rank on income per head. Third, regress the third term on the logarithm of income per head across all fifty-four cards, then add a landlocked indicator, and report whether it survives. Fourth, repeat everything after dropping each card with a low confidence flag, and say in two sentences whether the chapter’s claim about sea access survives. Treat nulls as missing, never as zeros; balance_sheet.exports_top3 is empty on every card, so no part of this exercise can use trade composition.
Data Sources and Further Reading
The data series are listed in Section 12. For the argument:
- David Atkin and Dave Donaldson (2015) on intranational trade costs; Adam Storeygard (2016) on transport costs and African city growth; Dave Donaldson (2018) on railways and market access as the comparison case; Simeon Djankov, Caroline Freund and Cong Pham (2010) on time as a trade barrier; and Ana Fernandes, Russell Hillberry and Alejandra Mendoza Alcántara (2021) on risk-based customs reform.
- AfDB, JICA and NEPAD, One Stop Border Post Sourcebook, for the border-post record, read alongside Chapter 7; and The New Regional Economics, chapters 12 to 15 (Wilse-Samson, 2026), for the four-corridor table, the rules of origin, the informal cross-border trade and the mirror-statistics finding.
- AUDA-NEPAD, PIDA PAP2 Projects Prospectus and the Virtual PIDA PAP overview, for the sixty-nine and the sector split in Section 11; Millennium Challenge Corporation on Prosper Africa as a facilitation rail rather than a fund.
- Jaime de Melo and Jean-Marc Solleder (2025) on regional value chains, and the African Center for Economic Transformation (2021) on what a transformation agenda asks of trade logistics.