34. Climate Finance and the Carbon Market
A tonne of carbon dioxide costs a European cement importer about 87 dollars to bring across the frontier, and a European power station about 95 dollars to emit. The same tonne, kept out of the atmosphere by a Kenyan household that stops burning charcoal or a Congolese community that leaves a forest standing, fetches somewhere between three and five dollars (African Business, 2023a). Nothing about the physics differs. What differs is that one price is set by a law with an enforcement agency behind it and the other by a voluntary market of about half a billion dollars a year in which the buyer is doing the seller a favour (Gourlay and Szabo, 2025). This chapter is about that ratio, and about the larger version of the same question: who pays for African adaptation and for the African energy transition, through what instruments, at what price, and what the money has actually bought.
Learning Objectives
After reading this chapter, you should be able to:
- State the size of the African climate-finance flow and of the estimated need, name the four or five institutions the flow runs through, and say why the two numbers are not measuring the same thing.
- Distinguish the instruments by what they do to a balance sheet: a grant, a concessional loan, a guarantee, a blended structure, a labelled bond, a debt swap and a carbon credit, and say which of them can reach a country with no market access.
- Describe the carbon credit’s chain from project developer to retirement, explain what a corresponding adjustment does under Article 6, and set out what the integrity literature has established about baselines.
- Set out the African negotiating position in its own terms, from the Nairobi and Addis Ababa declarations, and state the strongest version of the right-to-develop and carbon-sink arguments together with the strongest reply.
- Place climate finance in the book’s identity, explain why adaptation is a third-term input and almost never a second-term one, and say what a carbon rent does to a political settlement.
Prior work: the Just Energy Transition Partnership arithmetic, the double exposure of African exporters to the European carbon border adjustment, and the fact that Africa contributes under 4 percent of global emissions are set out in the companion volume, The New Regional Economics, chapter 15 (Wilse-Samson, 2026). This chapter cites that material rather than repeating it, and adds the instruments, the prices and the identity.
Two disclaimers. This is not a climate chapter: the physical exposures live where the assets are, in the rains of Chapter 11, the stranded hydrocarbons of Chapter 12, the tailings of Chapter 13, the hydropower of Chapter 14, the reefs of Chapter 18, the sea-level ports of Chapter 19 and one paragraph in each of the eight pole chapters, with Chapter 36 carrying the tail risk. This chapter carries only the money.
The second is about the word “finance”. Almost everything in this literature is a commitment rather than a disbursement, and almost nothing is netted against what it displaced. Whenever a figure appears below, ask whether it is money committed, contracted, disbursed, or arrived at a project. The four differ by more than a factor of two, and the gap between them is where most of the argument about African climate finance actually lives.
1. The ledger
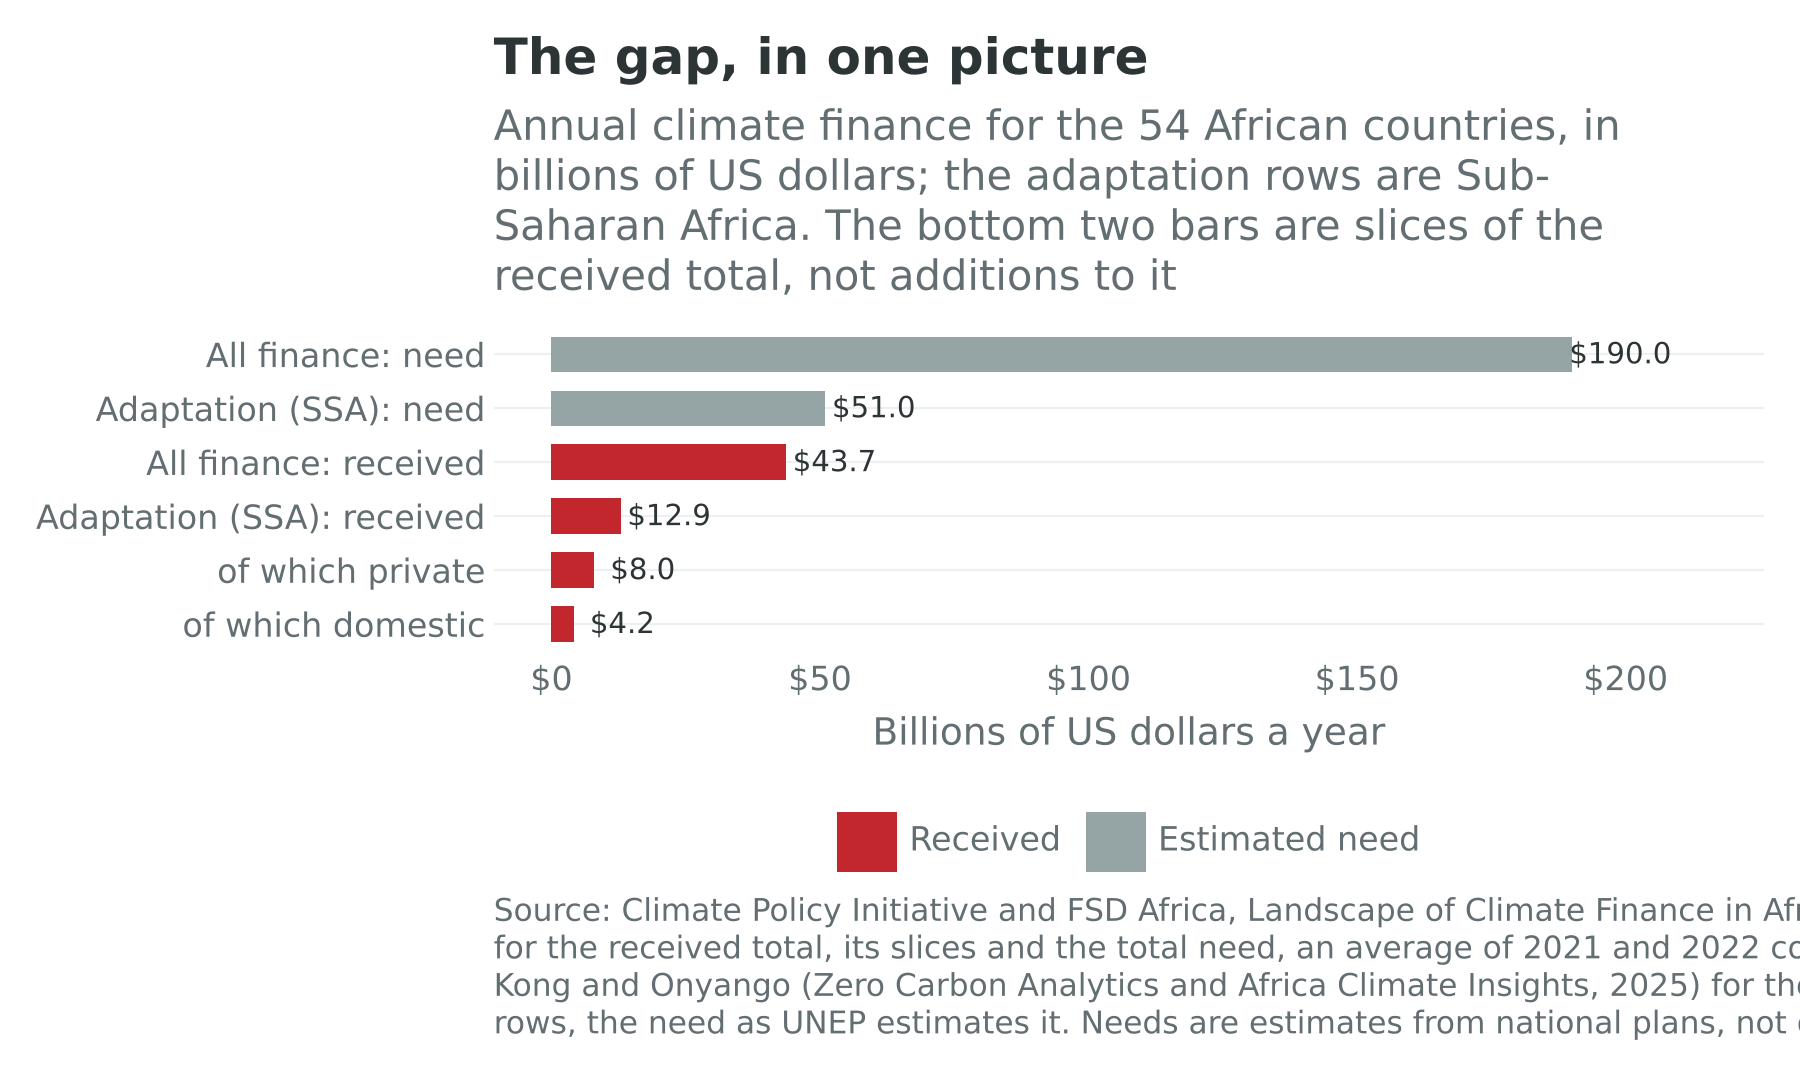
Start with the two numbers everything else hangs off. Tracked climate finance flowing to the 54 African countries ran at about 43.7 billion dollars a year in 2021 and 2022, up 48 percent from 29.5 billion in the two years before (Climate Policy Initiative, 2024). The same study puts the requirement at just under 2 trillion dollars to 2030, about 190 billion a year, assembled from what African governments themselves said their national climate plans would cost. The flow is therefore under a quarter of the stated need, about 23 percent of it.
Adaptation, the half of the problem Africa did not cause and cannot avoid, has its own pair. Adaptation finance reaching Sub-Saharan Africa was about 12.9 billion dollars in 2023, against a requirement the UN Environment Programme puts at about 51 billion a year (Kong and Onyango, 2025); globally, developing-country adaptation needs are projected at 310 to 365 billion a year by 2035 against international public flows of about 26 billion in 2023 (UNEP, 2025).
Three features of the flow matter more than its size.
It is public money. Public actors provide about 82 percent of African climate investment, and private finance about 18 percent, the lowest private share of any world region (Climate Policy Initiative, 2024). That fact is usually presented as a failure of mobilization. It is better read as a statement about the projects: a solar farm with a signed power-purchase agreement attracts private capital anywhere, and a drainage scheme in Kinshasa does not, because it has no revenue line. Section 2 develops this.
It is foreign money. Only about 10 percent of tracked African climate finance, some 4.2 billion dollars, comes from domestic actors (Climate Policy Initiative, 2024). A continent whose median informality rate is 89.1 percent has little fiscal room to finance adaptation out of its own revenue, which is Chapter 5’s argument about state capacity in a new costume.
It is concentrated. The top ten recipients take about half of the total and the bottom thirty about a tenth (Climate Policy Initiative, 2024). Money goes where projects can be prepared, and projects can be prepared where there are ministries to prepare them, which is the reverse of where the vulnerability is. Section 8 puts numbers on that reversal.
The pledges, in order
The institutional history is short and it is worth knowing, because every African negotiating position is a response to a specific broken promise.
The hundred billion. In 2009 the developed countries promised 100 billion dollars a year by 2020. It was missed in 2020 and 2021, and the OECD’s accounting recorded 115.9 billion in 2022, two years late (OECD, 2024a). The composition is what stuck in African memory: about 80 percent public, of which loans were 69 percent, or 63.6 billion, and grants 28 percent, or 25.6 billion. A promise of assistance was substantially delivered as debt, while the repayment wall of Chapter 21 was forming.
The New Collective Quantified Goal. At Baku in November 2024 the successor goal was set at 300 billion dollars a year by 2035, from a wide variety of sources including development-bank lending and mobilized private finance, inside an aspiration to reach 1.3 trillion by the same date (UNFCCC, 2024). The African Group of Negotiators had arrived asking for 1.3 trillion a year by 2030, mostly from public sources, as grants and highly concessional loans (Mills, 2024; Mwinzi, 2024). The distance between the ask and the outcome is the largest single fact in African climate diplomacy since 2009, and the reaction from the continent’s delegations was not diplomatic (Power Shift Africa, 2024).
Belém. At the thirtieth conference, in November 2025, the parties called for efforts to at least triple adaptation finance by 2035, which implies about 120 billion dollars a year (UNFCCC, 2025). Africa had asked for the tripling by 2030 and in grant form; the five-year deferral, in a decision whose adaptation indicators are voluntary, is why African assessments of Belém read as they do (Power Shift Africa, 2025).
The Loss and Damage Fund, agreed in 2022 and operationalized in 2023, carried about 768 million dollars of pledges by 2025 of which about 321 million had been paid in, and adopted a 250 million dollar start-up phase at Bridgetown in April 2025 (Climate Vulnerable Forum, 2025). Set 250 million against 51 billion and the fund is a rounding error with a governance structure. That is not the same as saying it does not matter: it establishes the principle that a transfer is owed, and principles compound.
The multilateral development banks are the largest channel and the least labelled. They reported a record 137 billion dollars of climate finance in 2024, of which more than 85 billion went to low- and middle-income countries, split 69 percent to mitigation and 31 percent, about 26.3 billion, to adaptation (Joint MDB Report, 2025). The honest caveat is Chapter 21’s about concessional lending generally: a development bank’s climate finance is largely its ordinary lending with a climate marker attached, and whether it is additional is a question the reporting is not designed to answer. The Green Climate Fund, the largest dedicated channel, is profiled in Section 5.
2. The instruments, and what they do to a balance sheet
The instrument is not a detail. It determines who bears the risk, whether the recipient’s debt rises, and whether the project can exist at all.
A grant transfers money and creates no claim. It is the only instrument that unambiguously helps a country whose problem is that it cannot service what it already owes, and it is in shortest supply: grants were 28 percent of the public component of the hundred billion in 2022 (OECD, 2024a), and rich-country aid then fell 23.1 percent in real terms in 2025, with bilateral assistance to Sub-Saharan Africa down 26.3 percent to 29.2 billion dollars (OECD, 2026). The grant window narrowed at the moment the adaptation argument was won.
A concessional loan is cheap money and still a claim: it raises the debt stock, consumes borrowing headroom, and has to be repaid in a currency the borrower does not print. For a country in debt distress that is not obviously assistance, which is why the African position at Baku insisted on the composition of the goal and not only its size. A guarantee, by contrast, creates no cash flow until something goes wrong: a development bank promises to pay if the borrower does not, and the lender therefore lends longer and cheaper. Guarantees are the cheapest instrument per dollar of private capital moved and the least used, partly because they sit awkwardly in donors’ own accounting, which counts money out of the door rather than risk taken on.
Blended finance puts concessional money in a junior position so that commercial money will take the senior one. Its record is the most over-promised in development finance: the claim that each public dollar mobilizes several private ones has not held at scale in low-income countries, and the deals that work have a contracted revenue stream, which means power generation and not flood defence. Labelled bonds are Chapter 16’s subject, and its verdict stands: a banking system that cannot lend at ten years cannot finance a twenty-year adaptation asset whatever colour the paper is.
The debt swap
The instrument that gets the most attention relative to its size is the debt swap, and it deserves a paragraph of mechanics because the mechanics are the argument.
A country’s existing debt trades below par. An arranger, typically a bank, lends the country new money at a lower rate and a longer tenor, credit-enhanced by a political-risk insurer or a development finance institution, and the country uses the proceeds to buy back the old debt at its discounted price. The difference between the old debt’s face value and its market price is the saving, and the country commits a defined share of it, over a defined period, to conservation or adaptation spending policed by a trust.
The Seychelles completed the first marine version in 2016, buying back about 21 million dollars of debt owed to European creditors and committing to protect a large share of its exclusive economic zone. Gabon did the first on the African mainland in August 2023, refinancing about 500 million dollars with the Bank of America as arranger, the United States development finance corporation as insurer and The Nature Conservancy as conservation partner, and committing about 5 million dollars a year for fifteen years to marine conservation (The Nature Conservancy, 2023). In December 2025 the same American institution agreed to proceed with a one-billion-dollar debt-for-food swap with Kenya (Capital FM, 2025).
Three things follow. A swap is a refinancing, not a cancellation: Gabon’s debt did not fall, its coupon did. The conservation money is a small fraction of the transaction, 5 million a year against 500 million refinanced, which is the standing criticism. And the instrument works only for countries whose debt trades at a discount and who can nonetheless attract an arranger, a narrow band the cards make visible: Gabon at 9,376 dollars a head and 31.5 percent external debt to GDP, Kenya at 2,558 dollars and 31.4 percent, the Seychelles at 18,479 dollars and no external debt stock recorded at all. These are middle-income countries with market access. The swap is not an instrument for Chad.
The Just Energy Transition Partnerships
The largest climate-finance construction aimed at Africa is the partnership agreed with South Africa at the 2021 conference: an initial 8.5 billion dollars from an international partners group, since raised to about 13.7 billion once the development banks are counted, against an investment plan whose own requirement is several times larger (The Presidency, 2023). Chapter 25 carries the political economy, which is that South African decarbonization is a labour-market problem in an energy costume. The financial history belongs here. Something over a billion dollars had been disbursed by 2025, into renewable infrastructure and reskilling, against a headline four years old, and most of the package was concessional and commercial lending rather than grants (Carnegie Endowment, 2025). In 2025 the United States withdrew from the partners group, cancelling about a billion dollars of loans and 56 million of grants, with the European Union announcing a package in Cape Town that covered part of the shortfall (Mail and Guardian, 2026). A partnership for Senegal, announced in 2023 at about 2.7 billion dollars, uses the same architecture (Carnegie Endowment, 2025).
The general lesson is not really about climate. A partnership between a sovereign and a coalition of foreign governments has no enforcement mechanism, and its terms change when one member’s government changes. That is a structural property of the instrument rather than an accident of one election, and it is why African finance ministries increasingly price this kind of pledge at a discount.
Why the adaptation project is different
Underneath all of this is one piece of project economics that explains the shape of the whole ledger.
A mitigation project usually produces something a customer pays for. A solar plant sells electricity, and a metered flow of revenue can be pledged to a lender, which is why 69 percent of multilateral climate lending is mitigation (Joint MDB Report, 2025). An adaptation project usually does not. A sea wall, a drainage channel, an early-warning system, a drought-tolerant seed programme: each produces avoided losses, which accrue diffusely, arrive as an absence, and cannot be billed. There is no revenue line to pledge, so there is nothing for private capital to underwrite and nothing for a blended structure to leverage.
Adaptation is therefore a public good financed out of a public budget, in countries where the public budget is the binding constraint on everything else too. That is why grant finance is the specific instrument the African position asks for, and why the composition argument at Baku and Belém is not a debating point.
3. The carbon market
The carbon market is the one instrument that promises to pay Africa for something Africa has rather than to lend Africa money it must repay. It is therefore the instrument the continent’s governments have bet on hardest, and the one whose integrity has collapsed most publicly.
The chain
A carbon credit is a claim that one tonne of carbon dioxide equivalent was not emitted, or was removed, relative to what would otherwise have happened. Every link in the chain is a place the claim can fail. A project developer designs an activity, such as distributing efficient cookstoves or protecting a forest that would otherwise be cleared, and writes a project document under a methodology published by a standard, of which the largest is Verra’s Verified Carbon Standard. The crucial component of that document is the baseline, a counterfactual statement of what would have happened without the project. A third-party verifier, paid by the developer, checks the document against the methodology; the standard issues serialized credits into a registry; a broker sells them; a buyer retires them against a claim.
Two structural problems are visible from that description alone. The counterfactual is unobservable, and the party that benefits from an optimistic one writes it. The verifier is paid by the developer. Neither is a scandal; both are design faults a market with no compliance authority behind it has no mechanism to correct.
What happened in 2023
In January 2023 an investigation by the Guardian, Die Zeit and SourceMaterial reported that the large majority of Verra’s rainforest credits did not represent a real tonne, on the basis of academic work finding project baselines that assumed deforestation far above what comparable untouched areas experienced (Greenfield, 2023). Verra disputed the arithmetic and published a technical rebuttal (Verra, 2023); its chief executive resigned in May 2023 and the standard rewrote its forest methodology to use jurisdictional rather than project-set baselines. The voluntary market’s value fell to about 535 million dollars in 2024, a 29 percent decline (Gourlay and Szabo, 2025).
The academic record is more careful than the headlines and points the same way, and Section 4 sets it out. The finding is specific: the activities are mostly real and the tonnes mostly are not, because a tonne is a difference from a counterfactual and the counterfactual was written by the seller. That matters for Africa more than anywhere, because the African market is overwhelmingly forest and cookstove credits.
The African market and its price
African projects issued about 50 million credits in the year to the initiative’s 2024 status report and retired about 25 million, and Africa made up about 16 percent of the global credit market (Africa Carbon Markets Initiative, 2024). The Africa Carbon Markets Initiative, launched at the twenty-seventh conference in 2022 and adopted as continental policy at Nairobi in 2023, set the ambition at 300 million credits retired annually by 2030, which it estimated would unlock 6 billion dollars of income and support 30 million jobs (Africa Carbon Markets Initiative, 2023). Set that ambition against the price and the arithmetic becomes hard. Figure 34.3 draws the ladder.
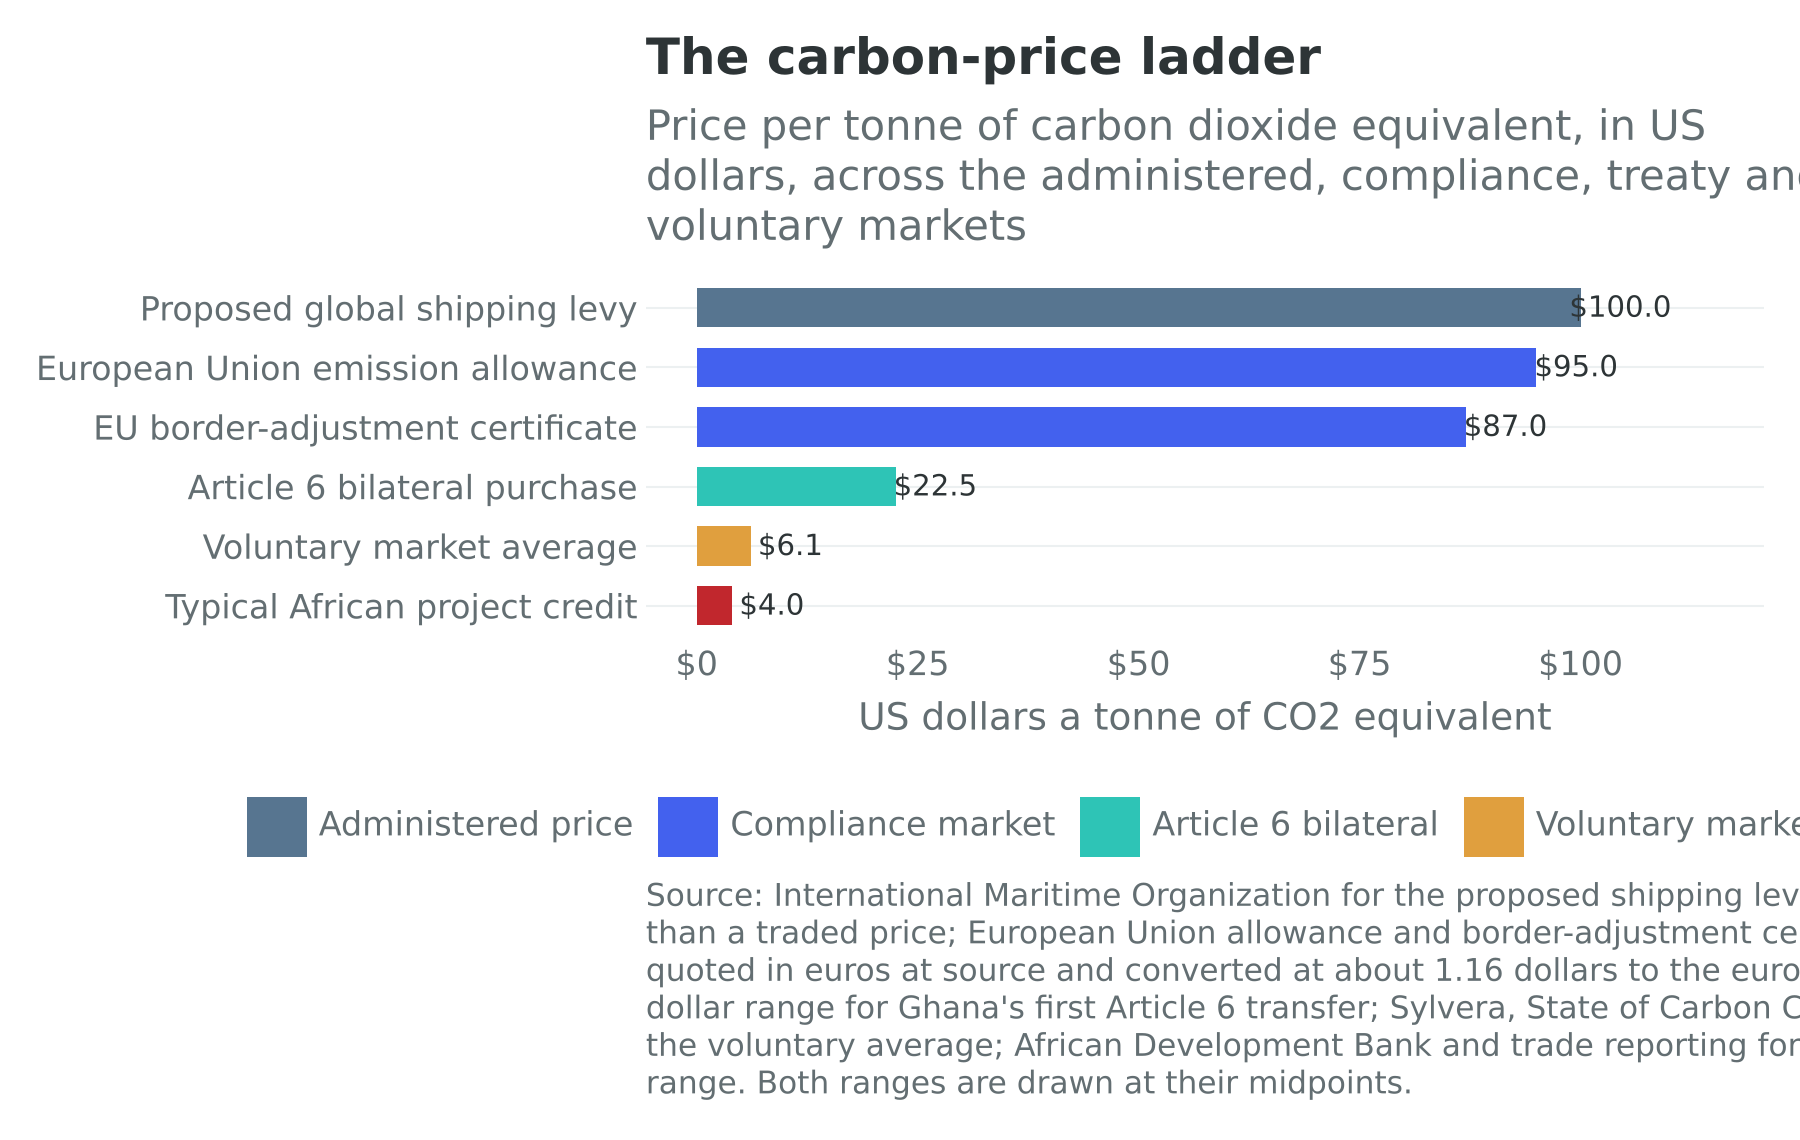
Three hundred million credits at four dollars a tonne comes to 1.2 billion dollars, not six (Africa Carbon Markets Initiative, 2023; African Business, 2023a). The initiative’s own number implies a price of about twenty dollars, which is roughly what Ghana’s first Article 6 transfer is reported to have fetched and roughly four times what an African forest credit actually fetches. The bet, in other words, is not on volume. It is on the African tonne converging towards the compliance price, and everything in Section 3 so far is a reason to doubt that it will while the baseline problem is unresolved.
Article 6, and the corresponding adjustment
The one mechanism that could close the gap is the Paris Agreement’s Article 6, which lets one country buy mitigation achieved in another and count it towards its own target. The accounting device that makes this honest is the corresponding adjustment: when Ghana sells a tonne to Switzerland, Ghana adds that tonne back to its own emissions ledger, so the same reduction is not counted twice.
Ghana issued the first African units for another country’s national target in July 2025: 11,733 units transferred to Switzerland from a rural cookstove activity, authorized by both governments in January 2024 (Government of Ghana, 2025). Eleven thousand tonnes is a demonstration rather than a market, but the price is the interesting part. It has not been disclosed; trade reporting puts it at an indicative 20 to 25 dollars a tonne (Financial Afrik, 2025), and the Swiss buyer has told the market it expects to pay an average of about 27 Swiss francs a tonne over 2025 to 2030 (Jardine, 2024). Either figure is several times the voluntary price. Gulf sovereign buyers have signed bilateral frameworks across the continent on the same model.
The corresponding adjustment carries a cost African negotiators have been slower to price than their counterparties. A tonne sold under Article 6 is a tonne the seller cannot count towards its own contribution, so a country with cheap abatement must decide whether to sell its cheapest tonnes now for cash or keep them for a target it will otherwise meet expensively later. Selling the cheap ones first is the classic extraction error, and the mineral chapters describe it in a different commodity.
The enclosure
The most consequential carbon story in Africa is not a market story. It is a land story, and it is Chapter 22’s.
Zimbabwe issued a decree in May 2023 asserting the state’s claim to half the revenue of any carbon project on its territory, with 30 percent to the foreign investor and 20 percent to host communities, and voided existing agreements pending re-registration (Government of Zimbabwe, 2023). In May 2025 new regulations repealed the decree and established a Zimbabwe Carbon Markets Authority (Government of Zimbabwe, 2025; Mugadza, 2025). The episode is instructive in both directions. A state discovering that a valuable right over its territory had been contracted away, and moving to tax it, is what a state should do; a state changing the terms of live contracts by decree is what deters the investment it wants. Chapter 5’s vocabulary handles this: the settlement decides how a rent is shared, and a settlement that decides abruptly gets a smaller rent to share. The decree’s proximate cause is the third profile in Section 5.
4. What the evidence says
What the randomized and quasi-experimental evidence establishes about carbon finance, and what it does not
This box is about instruments, not about climate. What the climate-damage literature establishes is that the damage is real and concentrated in hot, poor places: Burke, Hsiang and Miguel (2015) found output peaking at an annual average temperature of about 13 degrees Celsius and falling sharply above it, a relationship unchanged since 1960 and present in rich and poor countries alike, and Kalkuhl and Wenz (2020), working on subnational regions, found marginal damages larger than most integrated assessment models assume and largest in tropical regions. Neither says anything about whether a given financing instrument works. These do.
Paying people not to cut trees works, at a price a state could afford. Jayachandran, de Laat, Lambin, Stanton, Audy and Thomas (2017) randomized payments for ecosystem services across 121 villages in western Uganda; deforestation on treated land ran at about half the control rate over two years, with no evidence of displacement, and the delayed emissions were worth more than twice the programme’s cost. Chapter 18 reads this as the foundation under the conservancy model. Read as carbon finance it establishes the demand side of the credit: behaviour changes when payment arrives.
The supply side is where the failure is. The same result also shows why crediting is hard, because the estimate exists only against a randomized control. West, Börner, Sills and Kontoleon (2020) and Guizar-Coutiño et al. (2022) built synthetic controls for real projects and found the credited reductions far larger than the measured ones. Alix-Garcia and Wolff (2014), reviewing the wider payments-for-ecosystem-services literature, reached the earlier and more general version: these schemes work when they target land actually at risk and fail when they pay for land that was never going to be cleared. Gill-Wiehl, Kammen and Haya (2024) found the cookstove methodologies over-crediting by roughly a factor of nine, with the exception of the one that meters fuel. The pattern is a single finding: the intervention is real and the counterfactual is inflated, and the fix is measurement rather than intention.
The adaptation evidence points at risk, not capital. Karlan, Osei, Osei-Akoto and Udry (2014) gave northern Ghanaian farmers cash, rainfall index insurance, or both; insurance changed behaviour and cash largely did not, with insured farmers cultivating more land and buying more inputs. Chapter 11 carries the sequel, which is that take-up depends on when the premium is paid rather than on its size, and drought-tolerant maize is the agronomic complement: in south-eastern Zimbabwe, households growing it harvested about 617 kilograms a hectare more than comparable households that did not (Lunduka et al., 2019). The systems reading is that the highest-return adaptation instruments identified by trials are insurance and seed, both of which are cheap, neither of which produces a cash flow a lender can pledge, and both of which therefore sit on the wrong side of the divide in Section 2.
Put the two halves together and the honest verdict is this. The evidence supports paying for adaptation and is sceptical of selling avoided emissions. The instrument Africa has bet on is the one the evidence treats worst, and the instruments the evidence supports are the ones no market will finance.
5. Three institutions
The Green Climate Fund (Incheon)
The fund created by the 2010 climate conference to be the main channel of the hundred billion is now the largest dedicated climate institution, with a portfolio of 336 projects and about 19.3 billion dollars of its own resources at the end of 2025, some 40 billion under management once co-financing is counted, and 50 approvals worth 3.26 billion in that year alone (Green Climate Fund, 2026). Africa took 46 percent of the latest round of approvals; the fund maintains a floor of half its adaptation allocation for least developed countries, small island states and African states; and its second replenishment, for 2024 to 2027, has attracted about 10.6 billion dollars of pledges.
Three things are worth a reader’s attention. It is the one institution here whose mandate requires a balance between adaptation and mitigation, and it meets it. Its access process is the most complained about, because proposals run through accredited entities and the countries with the fewest accredited national entities are the countries of Table 34.1, so the money is routed through international agencies that take a share and set the design. And its scale is modest against Section 1’s arithmetic: 19.3 billion dollars accumulated over a decade, worldwide, against an African adaptation requirement of 51 billion a year. The fund is not the answer to the gap; it is the best-governed instrument inside it, which is a different thing and still worth having.
The cookstove developer and the forest developer (Nairobi and Kasigau)
Two Kenyan projects show the carbon chain working and failing.
BURN Manufacturing, based in Nairobi, has made and distributed more than 4.5 million efficient cookstoves since 2011, opened a factory in Kano in 2024, employs more than 700 people, half of them women, and finances much of the discount to the consumer by selling the resulting emission reductions as credits: about 60 million dollars of discounts in the eighteen months to May 2024 (BURN Manufacturing, 2024). The product is real, the health benefit of not breathing charcoal smoke is real, and the business could not exist at its price without the carbon revenue. It is the clearest African case of a credit paying for a good thing. It is also the sector Gill-Wiehl, Kammen and Haya (2024) found over-credited by roughly a factor of nine, and their remedy, metering fuel use rather than assuming it, is a cost the developer bears and the buyer does not. A market that will not pay for measurement gets the measurement it pays for.
The Kasigau Corridor project, between Tsavo East and Tsavo West, is the continent’s best-known forest carbon project and for a decade its showcase: several hundred thousand hectares of dryland forest, community ranches as the landholders, and large multinationals as buyers. In 2023 an investigation by the Dutch research organization SOMO and the Kenya Human Rights Commission documented widespread sexual harassment and abuse by staff of the project developer, and the standard opened a review that closed in February 2024 (SOMO and Kenya Human Rights Commission, 2023; Verra, 2024). The case makes the general point about the chain: a verifier paid to check an accounting document against a methodology does not audit what happens to the people on the land, and nothing else in the chain does either.
Blue Carbon (Dubai)
Through 2023 an Emirati firm owned by a member of Dubai’s ruling family signed memoranda with several African governments covering forest carbon rights over very large areas: reportedly about a fifth of Zimbabwe’s land, about a tenth of Liberia’s, and areas of Zambia and Tanzania, together on the order of the land area of the United Kingdom, with none of the agreements published in full and several signed without the participation of the communities living on the land (CNN, 2023; MERIP, 2024). Most have since stalled or been renegotiated, and Zimbabwe’s decree of May 2023 was in part a response.
The significance is not the deals, which mostly did not happen. It is that they could be attempted at that scale, in that time, with that little disclosure, in countries whose own record of who holds what is thin: Liberia produces 5.2 billion dollars of output with 5.6 million people. Chapter 22’s finding was that nine tenths of African land is held without a document. A world that begins to pay for African land will pay whoever can produce one, and in 2023 the party best placed to produce one was a buyer with a memorandum and a ministry’s signature.
6. The African position
The continent negotiates as a bloc through the African Group of Negotiators, unusual among developing-country groupings in holding together across quite different national interests: a Nigerian gas exporter, a Kenyan carbon-credit seller and a Sahelian adaptation claimant in the same room. Four positions have hardened.
A price on carbon at the global level, not the national one. The Nairobi Declaration of the first Africa Climate Summit, in September 2023, called on world leaders to support a global carbon taxation regime covering fossil-fuel trade, aviation and maritime transport, augmented by a financial transaction tax (African Union, 2023). The logic is Chapter 19’s for the shipping levy: an African country gains from a levy it does not pay and whose revenue is recycled, and loses from one that raises its trade costs without a transfer. The summit closed with about 23 billion dollars of commitments announced, which is the distance between a declaration and a cheque.
Carbon markets on African terms. The second Africa Climate Summit, in Addis Ababa in September 2025, refined the bet: its declaration committed to an Africa Action Plan on Carbon Markets and to equity and integrity principles described as an African gold standard, and endorsed the roadmap towards 1.3 trillion dollars a year (African Union, 2025a). The shift between the two summits is the interesting part. Nairobi treated the carbon market as an opportunity; Addis Ababa treated it as something to be governed, which is what two years of integrity failure teaches.
The right to develop. The African Union’s Common Position on Energy Access and Just Transition, adopted in July 2022, holds that the continent will deploy all of its energy resources, renewable and non-renewable, to reach universal access, and names natural gas as a transition fuel (African Union, 2022). Chapter 12 states the argument at its strongest and weakest: the arithmetic of a continent with a few percent of cumulative emissions and some 600 million people without electricity is not seriously contested, and gas-for-export is not gas-for-access.
Africa as a carbon sink. The strongest version sits under the Congo basin, where the largest tropical peatland complex on earth, about 167,600 square kilometres, stores roughly 29 to 30 billion tonnes of carbon, some 28 percent of the world’s tropical peat carbon (Dargie, 2017; Crezee, 2022). It lies under an economy at 871 dollars a head whose government has repeatedly offered oil and logging blocks over parts of the basin. Chapter 31 states the problem exactly: the service the world most needs from this territory is that nothing happens on it, and no mechanism pays for that at a competitive scale. A carbon credit is the wrong instrument, because a credit requires a counterfactual threat, so the payment is largest where destruction is most credible, which is a strange thing to reward. What the peatlands need is a standing payment for a stock, not a market for a flow.
On the delivery side sits the African Development Bank’s Africa Adaptation Acceleration Program, run with the Global Center on Adaptation, which aims to mobilise 25 billion dollars over five years (African Development Bank, 2025d). It is real, and it is small against a 51 billion dollar annual requirement.
7. The transfer running the other way
One part of the ledger is negative, and it is growing.
The European Union’s carbon border adjustment mechanism entered its definitive phase on 1 January 2026, pricing the embedded carbon of imported cement, iron, steel, aluminium and fertiliser at the European frontier, with certificate coverage rising from a small fraction of embedded emissions in 2026 towards the full amount in the following decade (European Commission, 2026a). Chapter 15 states the African exposure: it hits exporters twice, once on the product’s carbon intensity and once on the intensity of the grid it was made with, and it hits hardest the heavy industries with the best case for being in Africa at all. Mozambique is the extreme case, because almost all of its aluminium goes to Europe from a single smelter, and South Africa’s exposed steel and aluminium exports to the European Union are of the order of a billion euros a year (International Growth Centre, 2025; Engineering News, 2025a).
The mechanism is defensible as climate policy and indefensible as development policy, and both can be true at once. A carbon price with a leaky border is not a carbon price. But the revenue accrues to the importing jurisdiction, the compliance cost falls on the exporter, and nothing in the design returns anything to a country whose grid is dirty because it is poor. Chapter 19’s shipping levy is the same instrument arriving by sea, with one difference: its design includes a fund to recycle revenue, which is exactly what the African position asks the border mechanism to add.
8. Climate finance in the identity
Where does any of this sit in the book’s arithmetic, in which GDP growth is approximately the growth of output per worker, plus the growth of the employment-to-working-age ratio, plus the growth of the working-age population?
Climate finance is a third-term input where it works. An irrigation scheme raises output per worker on the same land, a grid connection lets a firm run a machine instead of a generator, and a drought-tolerant seed raises the yield in the bad year and so the ten-year average; Chapters 11 and 14 carry both. It is almost never a second-term input, because adaptation projects are capital works and seed programmes whose labour content is a construction phase. Chapter 10’s overlays would not move if every adaptation project in the pipeline were built tomorrow.
A carbon credit is different again, and it is best understood through Chapter 5 rather than through the identity. It is a rent on land, and a rent does not enter the identity as production; it enters as income accruing to whoever holds the claim, and the settlement decides how it is shared. Zimbabwe’s decree was a settlement deciding in public that the state’s share was half. Blue Carbon’s memoranda were a settlement deciding in private that the share was contractible by a few signatories. Chapter 13 has written the general form of this story in cobalt.
Who is exposed, and what can reach them
The chapter’s central claim about instruments follows from a table. Table 34.1 takes twelve African countries that the published vulnerability rankings place at or near the bottom of their scale and reads them off the cards. The selection can be checked against the cards themselves: fifty-three of the fifty-four carry a climate-vulnerability tercile, ranked among the African countries the index covers rather than against the world, because Africa fills most of the top of the world distribution and a world ranking would put almost every country here in the worst third and tell the reader nothing (Notre Dame Global Adaptation Initiative, 2026). Eleven of the twelve come out in the worst third. Madagascar does not, and it misses by a thousandth of a point, standing nineteenth of fifty-three and first below the line; it stays in the table because the argument the table makes is about which instruments can reach these countries, and one place either way does not move it. The tercile also names seven countries the chapter’s twelve do not: Benin, Djibouti, Malawi, Mauritania, Sierra Leone, The Gambia and Rwanda, eighth worst on the continent and the one this chapter did not expect, which Section 10 takes up. No vulnerability score is quoted anywhere in this book. A tercile is a rank, the index beneath it is a composite of thirty-six indicators whose weights are its authors’ choice, and a rank survives an argument about weights better than a decimal does. Everything else in the table is from the cards.
| Country | Term one | Term two | Term three | GDP per head ($) | External debt to GDP (%) | Private share of guaranteed debt (%) | Vulnerability | Confidence |
|---|---|---|---|---|---|---|---|---|
| Burundi | 2.94 | 0.06 | -1.87 | 478 | 14.8 | none reported | high | low |
| Central African Republic | 1.27 | 0.01 | 1.08 | 579 | 32.8 | 0.5 | high | not computable |
| Madagascar | 3.03 | -0.16 | -0.05 | 622 | 34.0 | 2.9 | medium | low |
| Eritrea | 1.98 | -0.12 | -2.31 | 689 | 32.3 | none reported | high | not computable |
| Niger | 4.01 | 0.81 | 0.84 | 750 | 24.3 | 3.3 | high | high |
| Somalia | 3.79 | -0.09 | 1.06 | 764 | 13.9 | none reported | high | low |
| Sudan | 3.20 | -0.81 | -2.87 | 788 | 55.4 | 31.9 | high | low |
| Democratic Republic of the Congo | 3.38 | -0.18 | 1.81 | 871 | 13.4 | 0.9 | high | low |
| Liberia | 2.61 | -0.14 | -0.98 | 910 | 42.8 | 1.9 | high | low |
| Chad | 4.14 | -0.43 | -1.31 | 1,165 | 15.2 | 7.9 | high | low |
| Mali | 3.54 | -0.72 | 1.33 | 1,190 | 21.4 | 0.0 | high | medium |
| Guinea-Bissau | 2.97 | 0.34 | 1.41 | 1,311 | 54.1 | 37.8 | high | low |
| Median of the twelve | 3.11 | -0.13 | 0.39 | 776 | 28.3 | 2.9 | ||
| Median of all cards | 2.89 | -0.15 | 0.74 | 1,678 | 35.1 | 14.9 |
The three identity terms are annual growth rates in percentage points over 2014 to 2024: term one is the working-age population aged 15 to 64, term two is modelled employment aged 15 and over divided by that population, term three is the residual output-per-worker series. Publicly guaranteed long-term debt is divided by type of creditor into three lines that partition it exactly, multilateral, official bilateral and private, with bonds a part of the private line rather than a fourth line beside it, so the private share is the private line over the sum of the three. The column reads “none reported” where the debt statistics carry no private line for the country at all, which is not a zero, and its two medians are therefore taken over the nine of the twelve and the 43 of the 54 that carry one. Guaranteed debt does not sum to the external debt stock, which also carries short-term debt, Fund credit and private non-guaranteed borrowing. The other medians are taken column by column across the 54 cards, or the 53, 50 and 51 that carry the relevant field, and are not countries. The twelve were selected from the published climate-vulnerability ranking rather than from the card field, so the vulnerability column checks the selection rather than making it; that column is the card field, a tercile of the ND-GAIN vulnerability score ranked among the 53 African countries the index covers, and eleven of the twelve fall in the worst third. Sources: UN World Population Prospects 2024, ILOSTAT modelled estimates (November 2025), the IMF World Economic Outlook (April 2026), World Bank International Debt Statistics (2025 release) and the ND-GAIN Country Index, via the country cards.
Read the table across and four findings appear, in ascending order of consequence.
They are poor. The median income of the twelve is 776 dollars a head against a continental median of 1,678, and nine of the twelve sit below 1,000 dollars, out of fifteen such countries on the continent. Together they hold 313 million people, 20.7 percent of Africa, produce 8.3 percent of its output, and reach 584 million people by 2050.
They are badly measured. Eight of the twelve carry a low confidence flag, one is medium, one is high, and two cannot be flagged at all because the Central African Republic has never run a labour-force survey and Eritrea has never held a census. Their median statistical performance score is 51.7 against a continental 61.7, six last counted their populations before 2010, and only three have run a labour-force survey since 2021. Niger is the exception that proves the rule, with a statistical performance score of 70.5 and a survey in 2022.
Their demography is the continent’s fastest and their productivity its slowest. Median term one among the twelve is 3.11 percent a year against 2.89 for the 54, and seven exceed 3 percent; median term three is 0.39 percent against 0.74; and eight have a negative second term. Six of the twelve are also in Chapter 10’s fourteen, the countries adding people of working age faster than they add work.
And they owe almost nothing to markets. This is the finding that decides which instruments can reach them. Private lenders hold a median of 2.9 percent of the guaranteed debt of the nine of the twelve whose cards carry a private-creditor line, against 14.9 percent across the 43 cards that carry one, and seven of the nine are below 10 percent; only Sudan and Guinea-Bissau are not. The remaining three, Burundi, Eritrea and Somalia, have no private line in the debt statistics at all. That is a gap in the record and not a zero, so no share is computed for them; but a country for which the debt statistics have never had occasion to open a private-creditor column is not one a debt swap can reach either. Added together rather than taken as medians, the nine owe 13.5 percent of their guaranteed debt to private lenders against 42.4 percent across the 43. The mirror image is weaker than it looks: multilateral lenders hold a median 52.7 percent of the nine’s guaranteed debt against 48.5 percent across the 43, a gap too narrow to carry an argument on its own; the private side carries this one. Their median external debt to GDP is 28.3 percent against a continental 35.1, so they are not obviously over-borrowed either.
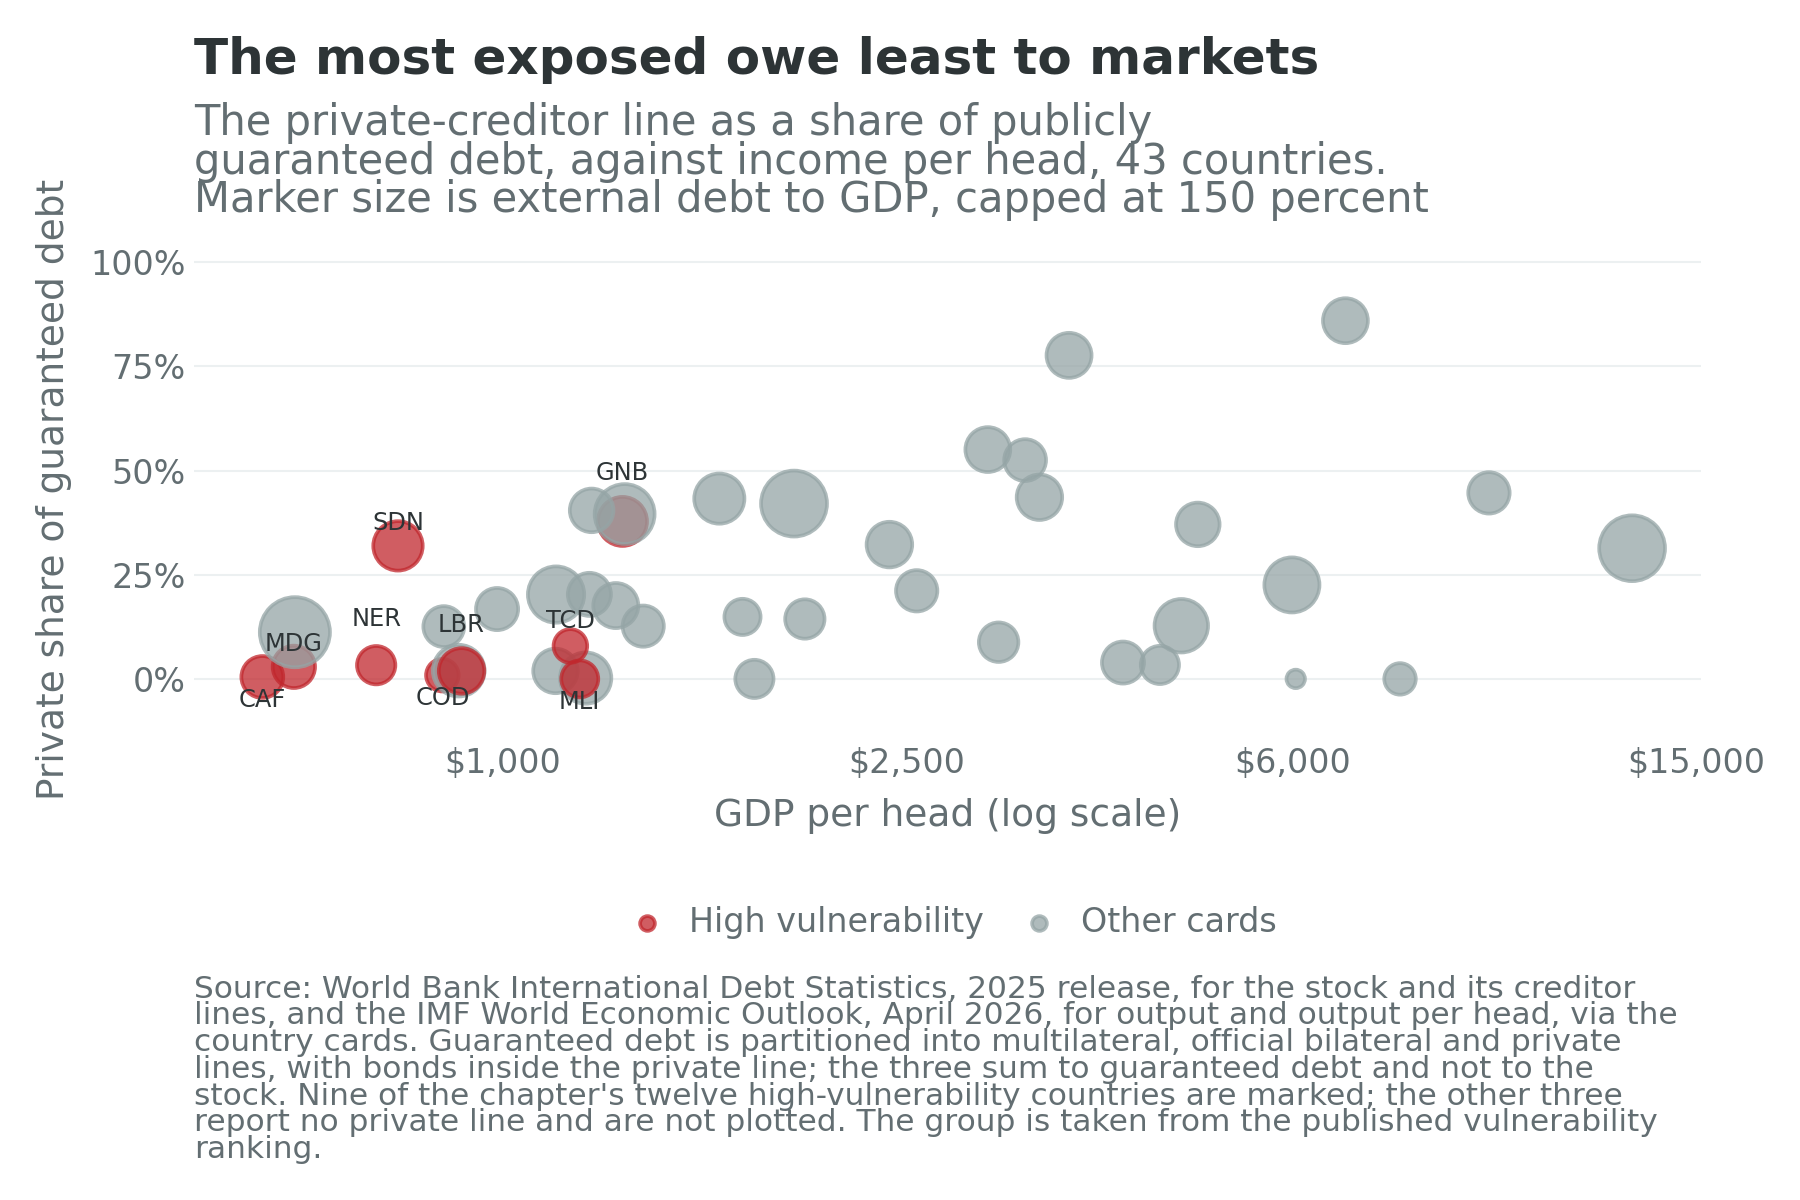
Now put the four together. A debt swap needs debt trading at a discount and an arranger, which needs a bond. A sustainability-linked bond needs a bond market. A blended structure needs a project with a revenue line and a legal system that will enforce a security package. A carbon credit needs a registry, a verifier and a land title. The twelve have almost none of these, and the reason is not that their finance ministries have been idle. It is that instruments designed to lever private capital cannot reach an economy private capital has not entered. What is left is the grant and the concessional multilateral loan: the two instruments in shortest supply, through the one channel that already holds most of their external debt.
That is the chapter’s central finding, and it is about instruments rather than about generosity. The countries most exposed to climate damage are the ones least reachable by almost everything the last decade of climate-finance innovation has produced.
9. Carbon in two worlds
Chapter 1 set out the assumption underneath the identity and the world in which it fails: one in which the frontier of production is a stock of machines and energy rather than a stock of workers. It named four holdings that keep their value when the frontier stops needing workers: people, whose value is the open question, land, sun and ore. Carbon is the fourth holding’s shadow, and this chapter is where it acquires a price.
In the labour-abundant world, climate finance is a development-finance problem with a moral surcharge. It pays for the irrigation, the grid and the sea wall that let a growing labour force be productive, and the argument is about how much and on what terms.
In the labour-redundant world it becomes something else. If income stops arriving through wages, it arrives through ownership, and carbon is an ownership claim over African ground that a rich world would have every reason to keep paying. A country whose population the world’s production no longer needs, but whose forests the world’s atmosphere does, would be paid a rent to hold an asset still. That is not hypothetical; it is what the Congo basin peatlands already are, minus the payment.
Two consequences follow. The first is competition for ground: land for carbon, land for solar and land for food are the same land, and Chapters 11 and 22 both end at this junction. A hectare of Miombo woodland is worth more standing if carbon pays and more cleared if maize pays, and the price of both is set outside the country. In a world with a serious carbon price, the highest-value use of a great deal of African land would be to have nobody on it, which is a proposition about people and not about trees.
The second is the settlement. Chapter 10’s hardest question was what employment is for in a world that does not need it for output; this chapter’s version is who receives a carbon rent in a settlement that does not need its population. Chapter 5’s answer is not reassuring: rents accrue to whoever holds the claim, and the claim is a document. Zimbabwe’s decree and the Blue Carbon memoranda are the two available answers, a state taxing the rent and a private party contracting it away, and the difference between them is a registry and a parliament. Chapter 23 asks what follows: if income is a rent rather than a wage, its distribution is a political decision taken every year, by a state whose median statistical performance score is 61.7.
The carbon enclosure is the second world’s first land grab, and it happened in 2023, quietly, before anybody had automated anything.
10. Data quality
Two gaps in this chapter deserve to be stated rather than smoothed.
The first is the vulnerability field, and it changes what this chapter can say. Fifty-three of the fifty-four cards carry a climate-vulnerability tercile; South Sudan’s is empty because the index does not score the country, and that null means unscored rather than unexposed. The tercile ranks a country among the African countries the index covers and not against the world, which is the comparison this chapter and the book’s maps actually make; a reader who wants the global position should go to the published ranking. The table’s ordering is by income rather than by exposure, and that is a choice rather than a limitation.
The three tests the exercise below sets can therefore be run off the cards, and the argument survives them. Vulnerability tracks poverty closely: across the fifty-three the correlation with the logarithm of income per head is about minus 0.71, and the median income of the worst third is 889 dollars a head against 4,753 in the best. It tracks the statistical apparatus more loosely, at about minus 0.28 against the statistical performance score, but the confidence flag is blunter and says it plainly: of the eighteen countries in the worst third, ten carry a low flag and two cannot be flagged at all, against four low flags among the eighteen in the best third. Where the exposure is worst the measurement is worst, which is Section 1’s concentration finding arriving from the opposite direction. The third of them, whether vulnerability predicts the private-creditor share, runs and does not shrug: forty-three cards carry both a tercile and a private-creditor line, and across them the median private share of guaranteed debt falls from 27.0 percent in the least exposed third to 12.7 in the middle and 5.6 in the worst, a rank correlation of about minus 0.33. That is Section 8’s finding reached without selecting anybody by hand, and it is the reason this chapter’s argument about instruments does not depend on which twelve countries the table happens to name.
One country in the worst third is not where this chapter would have put it. Rwanda is eighth of the fifty-three, one place worse than Sierra Leone, and it carries a high confidence flag, a statistical performance score of 72.6 against a continental median of 61.7, a census in 2022 and a labour-force survey in 2024. It is the development bargain of Chapter 9 and the best-measured poor country on the continent, and it is also small, landlocked, mountainous, densely farmed and dependent on rain, which is what the index is measuring. That is the useful thing about an exposure index built from physical and sectoral indicators rather than from institutions: it does not reward good government, and it should not, because the rain does not either.
The second is the climate-finance data itself, which is worse than most of what this book uses, because nobody audits it. Tracked flows are commitments assembled from donor and development-bank reporting, with different institutions counting differently, so a project financed by three lenders can appear three times; the mitigation and adaptation labels are applied by the reporting institution to its own lending; and the needs are national plans priced by the governments asking for the money. The accounting systems behind Figure 34.1 do not reconcile, and the honest statement is that the gap is very large and its width is not known to better than a factor of two. This is the one place in this book where the numbers are worse than the African statistical apparatus, and they are produced in Paris, Washington and Bonn.
Connections to Other Chapters
- Chapter 5 (States, Political Settlements, and Development Bargains) supplies the framework in which a carbon credit is a rent whose sharing the settlement decides, and Chapter 22 (Land) the tenure system that determines who can sign the contract.
- Chapters 11, 12, 13, 14, 18 and 19 (the sectors) each carry the physical exposure this chapter finances: irrigation and the rain-fed share, stranded hydrocarbons and the right-to-develop argument, water and tailings, hydropower and the cooling peak, reefs and aviation, and ports at sea level with the shipping levy.
- Chapter 15 (Manufacturing) owns the carbon border adjustment’s industrial exposure and Chapter 16 (Finance and Fintech) the labelled-bond market; Chapter 21 (Capital and Sovereign Debt) asks whether transition finance is additional or the same debt with a label.
- Chapters 24 to 31 (the growth poles) each hand their climate-exposure paragraph here: Gauteng’s coal transition in particular is Chapter 25, and the Congo basin peatlands are Chapter 31.
- Chapter 23 (Inequality, Social Protection, and Health) carries the transfer question a carbon rent poses, Chapter 33 (The Other Partners) the Gulf buyers whose land agreements Section 5 describes, and Chapters 35 and 36 (Scenarios; What Could Go Wrong) the climate tail risk this chapter deliberately does not price.
Discussion Questions
Adaptation projects produce avoided losses rather than revenue, which is why they attract no private capital, and grant finance is the instrument in shortest supply. Design a financing instrument that would make an adaptation project bankable without inventing a revenue stream that does not exist. Then say who bears the risk in your design, and why that party would accept it.
The evidence in Section 4 supports paying people to change land use and is sceptical that the resulting emission reductions can be credited honestly. Those are different claims. Set out what would have to change in the crediting chain for the second to catch up with the first, then say whether a market with no compliance authority behind it can make that change, and what would replace it if it cannot.
Table 34.1 shows that the most exposed countries owe a median of 2.9 percent of their publicly guaranteed debt to private creditors, against 14.9 percent across the 43 cards carrying a private-creditor line, and that three of the twelve carry no private line at all. One reading is that they are protected, because a country with no bonds cannot have a debt crisis of the Chapter 21 kind. Another is that they are unreachable, because every instrument that levers private capital requires private capital to be present. Argue for one reading, then say which observation over the next decade would settle it.
Try It
Open the Sovereign Debt Tracker and look at the three swap countries in turn: Gabon, which did the first mainland African debt-for-nature conversion; the Seychelles, which did the first marine one; and Kenya, which agreed a debt-for-food swap in 2025. For each, read the external debt stock, the creditor composition and the bond line, and note that the Seychelles card carries no external debt stock at all. Then switch the tracker to any of the twelve countries in Table 34.1 and look for the same instruments. Write one paragraph on a single question: what do the three swap countries have in common that the twelve do not, and is that a fact about their climate exposure or about their capital markets?
Data Exercise
Download all fifty-four cards from the country cards page on this site, as cards.csv or cards.json. First, count data_quality.climate_vulnerability_tercile by value: you should find fifty-three filled in three groups of eighteen, seventeen and eighteen, and one card empty. Find the empty one and say, in a sentence, why treating it as a low tercile would be worse than dropping it. Second, build a table with scale.gdp_per_capita, scale.population, balance_sheet.external_debt_stock, scale.gdp_usd, the creditor fields under balance_sheet.external_debt_by_creditor, data_quality.spi_overall_score and data_quality.confidence_flag. Compute the private-creditor share as other_private over the sum of multilateral, other_bilateral and other_private, which is how the debt statistics partition publicly guaranteed debt: eurobond is a part of other_private and not a line beside it, so adding it to the denominator counts bonds twice. Leave the share empty on every card with no other_private line rather than reading the gap as a zero, then reproduce the medians in Table 34.1 for the chapter’s twelve and for all cards carrying the fields, and check the counts. Third, run Section 10’s three tests off the tercile itself: does vulnerability predict income per head, does it predict the statistical performance score, and does it predict the private-creditor share? Report the direction and rough size of each, count how many cards each test actually runs on, and say which of the three you would refuse to report at all. Fourth, and this is the exercise the tercile makes possible, rebuild the terciles yourself against the world rather than against Africa, using the published index for all the countries it covers, and count how many African countries land in the worst global third. Then say in three sentences what the book gains and what it loses by ranking within the continent. Treat nulls as missing, never as zeros.
Data Sources and Further Reading
Key data sources
- Climate Policy Initiative and FSD Africa, Landscape of Climate Finance in Africa 2024: the tracked flow to the 54 countries, its public, private and domestic composition, its concentration among recipients, and the estimated annual requirement to 2030. Commitments assembled from donor and institutional reporting, not disbursements observed.
- UN Environment Programme, Adaptation Gap Report 2025: the adaptation finance gap, globally and for Africa, and the distinction between modelled costs and needs extrapolated from national plans.
- OECD, Climate Finance Provided and Mobilised by Developed Countries: the accounting of the 100 billion dollar goal, including the loan and grant split the African position is a response to, with the OECD’s preliminary 2025 aid figures for the collapse in grant finance.
- UNFCCC decisions for the New Collective Quantified Goal of 2024 and the Belém package of 2025; the Fund for Responding to Loss and Damage, the Green Climate Fund and the Joint MDB Report on Climate Finance for their own pledge, approval and portfolio figures.
- Ecosystem Marketplace, State of the Voluntary Carbon Market, and the Africa Carbon Markets Initiative status reports for prices, issuance and the African share, both resting on registry data from Verra and Gold Standard.
- Notre Dame Global Adaptation Initiative, ND-GAIN Country Index: the vulnerability ranking used to select this chapter’s twelve, and the source of the country cards’ climate-vulnerability tercile. The vulnerability half of the index alone, thirty-six indicators of exposure, sensitivity and adaptive capacity across food, water, health, ecosystem services, human habitat and infrastructure, and never the readiness half, which would make the field partly a statement about institutions. The tercile is computed among the African countries the index covers; no score is quoted anywhere in this book.
- Country cards: UN World Population Prospects 2024 for term one; ILOSTAT modelled estimates, November 2025, for terms two and three; the IMF World Economic Outlook, April 2026, for output and income per head; World Bank International Debt Statistics, 2025 release, for the debt stock and its creditor composition; the Statistical Performance Indicators and the book’s own data-quality table for the flag.
Further reading
- Seema Jayachandran and co-authors (2017) on payments for ecosystem services in Uganda, with Jennifer Alix-Garcia and Hendrik Wolff (2014) on when such schemes work; Thales West and co-authors (2020), Alejandro Guizar-Coutiño and co-authors (2022) and Annelise Gill-Wiehl, Daniel Kammen and Barbara Haya (2024) on the baselines under forest and cookstove credits, with Verra’s technical responses beside them.
- Marshall Burke, Solomon Hsiang and Edward Miguel (2015) and Matthias Kalkuhl and Leonie Wenz (2020) for the damage function this chapter’s finance is a response to, and Chapter 36 for what it implies about tails.
- The Nairobi Declaration (2023), the Addis Ababa Declaration (2025) and the African Union’s Common Position on Energy Access and Just Transition (2022) for the African position in its own words, with Power Shift Africa’s assessments of Baku and Belém for the sharper version.
- The New Regional Economics, chapter 15 (Wilse-Samson, 2026), for the border-adjustment and Mpumalanga material this chapter cites rather than repeats.