36. What Could Go Wrong
Learning Objectives
After reading this chapter, you should be able to:
- State each of the book’s six failure modes in one form: the mechanism, where it is already visible on the cards, the chapter carrying the detail, the indicator to watch, and which identity term it moves and in which direction.
- Set out the Sahel case in full, joining the fastest first term on the continent to a falling employment ratio, a contracting state, a drying climate and a gold economy that finances the people contesting the state, and say which parts of that account the numbers can carry.
- Explain why the demographic dividend is a conditional rather than a gift, using the fertility-stall and youth-bulge literatures, and say what would have to be observed for the bulge reading to be the right one.
- Distinguish a shock arriving through the balance sheet from one arriving through the settlement and one arriving through the physical economy, trace each to the terms it lands on, and explain why a diagram of those channels is a map of mechanisms rather than a model.
- Say which failure modes are specific to the labour-abundant world, which to the labour-redundant one, and which are common to both, and use the answer to rank them.
Prior work: the Sahel’s distress urbanization, the southward movement of the arable margin and the Lake Chad numbers are developed at length in the companion volume, The New Regional Economics, chapters 13 and 15 (Wilse-Samson, 2026). This chapter cites that account rather than restating it, and adds the identity, the settlement sequence, the conflict record and the data-quality layer.
Niger, Mali, Burkina Faso and Chad hold 95.4 million people between them and produce $101.1 billion of output, less than Kenya produces with 56.4 million. On the United Nations medium variant the four hold 174.8 million people in 2050 and 289.6 million in 2100, which is to say they triple inside the lifetime of a child born this year. Over the decade to 2024 the share of their working-age populations actually in work fell in three of the four. Three of the four are governed by soldiers, and the same three left their regional community in January 2025.
That is the book’s bet with the sign reversed. Everything the case rests on is present, and nothing that would convert it is.
This chapter is the counter-case gathered in one place. Chapter 4 staged six objections and said which delay the case and which defeat it; Chapters 5 to 34 supplied the evidence. What is left is to treat each objection as a failure mode rather than as an argument: how it would happen, where it is already happening, what to watch, and what it does to the arithmetic. Chapter 35 carries the scenarios with their assumptions exposed; this chapter carries the mechanisms. A failure mode is not a mood, and the difference between a counter-case and pessimism is that a counter-case names the observation that would settle it, so every section ends in the same two places: an indicator, and a term of the identity with a sign attached.
How to read a failure mode
The chapter is organized by the identity of Chapter 1, in which GDP growth is approximately the sum of three growth rates. Failure modes are not equally shaped: some subtract from a term, some prevent one from ever rising, and one changes what the terms mean.
| Failure mode | The mechanism, in one line | Where it is visible now | Carried in | What to watch | Identity |
|---|---|---|---|---|---|
| The Sahel configuration | The fastest working-age growth on the continent meets a contracting state, a falling employment ratio and a drying climate | Mali, Burkina Faso, Niger, Chad; the edges in Mauritania and northern Nigeria | This chapter | Territory under government control; whether the surveys keep being run | Term one large, term two negative, term three hostage |
| The dividend that never arrives | Fertility stalls, the working-age share stops rising, and the bulge is not converted into employment | Stalls recorded in Kenya, Ghana and Nigeria; stage-one fertility in seven countries | Chapters 2, 10 | Total fertility in the stage-two bloc; the wage-employment share in large low-income countries | Term one flattens later than hoped; term two never moves |
| The second wave of defaults | Refinancing at eight to ten percent meets a growth slowdown, and debt service crowds out the investment that would raise output per worker | Senegal’s restatement; the 2024 and 2025 refinancings | Chapter 21 | Spreads and the ratio of debt service to revenue; the primary balance a legislature will actually pass | Term three, through the investment channel |
| Conflict | Territory leaves the state, markets close, and capital and people leave with them | Sudan, eastern DRC, the Sahel, Amhara, Cabo Delgado, anglophone Cameroon | Chapters 29, 31 and this chapter | Displacement counts; whether a statistical office keeps operating | All three, term two first |
| Climate in the tail | Not the average year but the failed season, the empty reservoir and the shifted crop band | The Horn drought; Kariba in 2024; the cocoa and coffee bands | Chapters 11, 14, 30, 34 | Reservoir storage; consecutive failed seasons; crop-suitability maps | Term three directly, term two through agriculture |
| The trap before the middle | Deindustrialization arrives before industrialization, the services rungs are taken by machines, and a resource rent pays for consumption | Nigeria’s negative term three; the dual-firm finding; the outsourcing layer | Chapters 9, 12, 13, 15, 17, 20, 22 | Manufacturing and tradable-services employment shares; where a graduate’s first job is | Term three low, term two flat, permanently |
Table 36.1. The chapter’s six failure modes. The last column names the term each one moves and the direction. This is the chapter’s own scheme rather than a measurement, and every row is argued below.
The Sahel
Chapter 31 declined to make the Sahel a third thin-state writeup and gave a reason rather than an excuse: a growth pole is a place where the identity’s terms are being pushed in a direction, and the Sahel is a place where they are being pushed back. This section runs Mali, Burkina Faso, Niger and Chad, with Mauritania and northern Nigeria at the edges, and takes the whole configuration rather than any one part, because the parts are not separable. The demography is what makes the conflict expensive. The conflict is what stops the state collecting. The absence of collection is what leaves the climate unadapted to. And the gold pays for the people contesting the state.
The four in the identity
| Country | Term one: working-age population | Term two: employment ratio | Term three: output per worker | Implied growth | Observed growth | Wage employment (percent) | Non-agricultural employment (percent) | Informal employment (percent) | Confidence |
|---|---|---|---|---|---|---|---|---|---|
| Niger | 4.01 | 0.81 | 0.84 | 5.65 | 5.73 | 10.3 | 26.5 | 98.5 | high |
| Chad | 4.14 | -0.43 | -1.31 | 2.40 | 2.47 | 8.5 | 28.1 | 97.6 | low |
| Mali | 3.54 | -0.72 | 1.33 | 4.16 | 4.27 | 23.1 | 36.5 | 92.8 | medium |
| Burkina Faso | 3.31 | -1.12 | 2.47 | 4.66 | 4.68 | 17.2 | 47.8 | 95.1 | high |
| Mauritania | 3.37 | -0.52 | 1.21 | 4.06 | 4.07 | 42.3 | 67.2 | 89.3 | medium |
| Median of the cards | 2.89 | -0.15 | 0.74 | 2.91 | 31.0 | 59.0 | 89.1 |
Table 36.2. Annual growth rates in percentage points over 2014 to 2024, except the last four columns, which are shares. Term one is the working-age population aged 15 to 64; term two is modelled employment aged 15 and over divided by that population. The median row is taken column by column across the cards carrying each series and is not a country. Sources: UN World Population Prospects 2024 (medium variant), ILOSTAT modelled estimates (November 2025) and the IMF World Economic Outlook (April 2026), via the country cards.
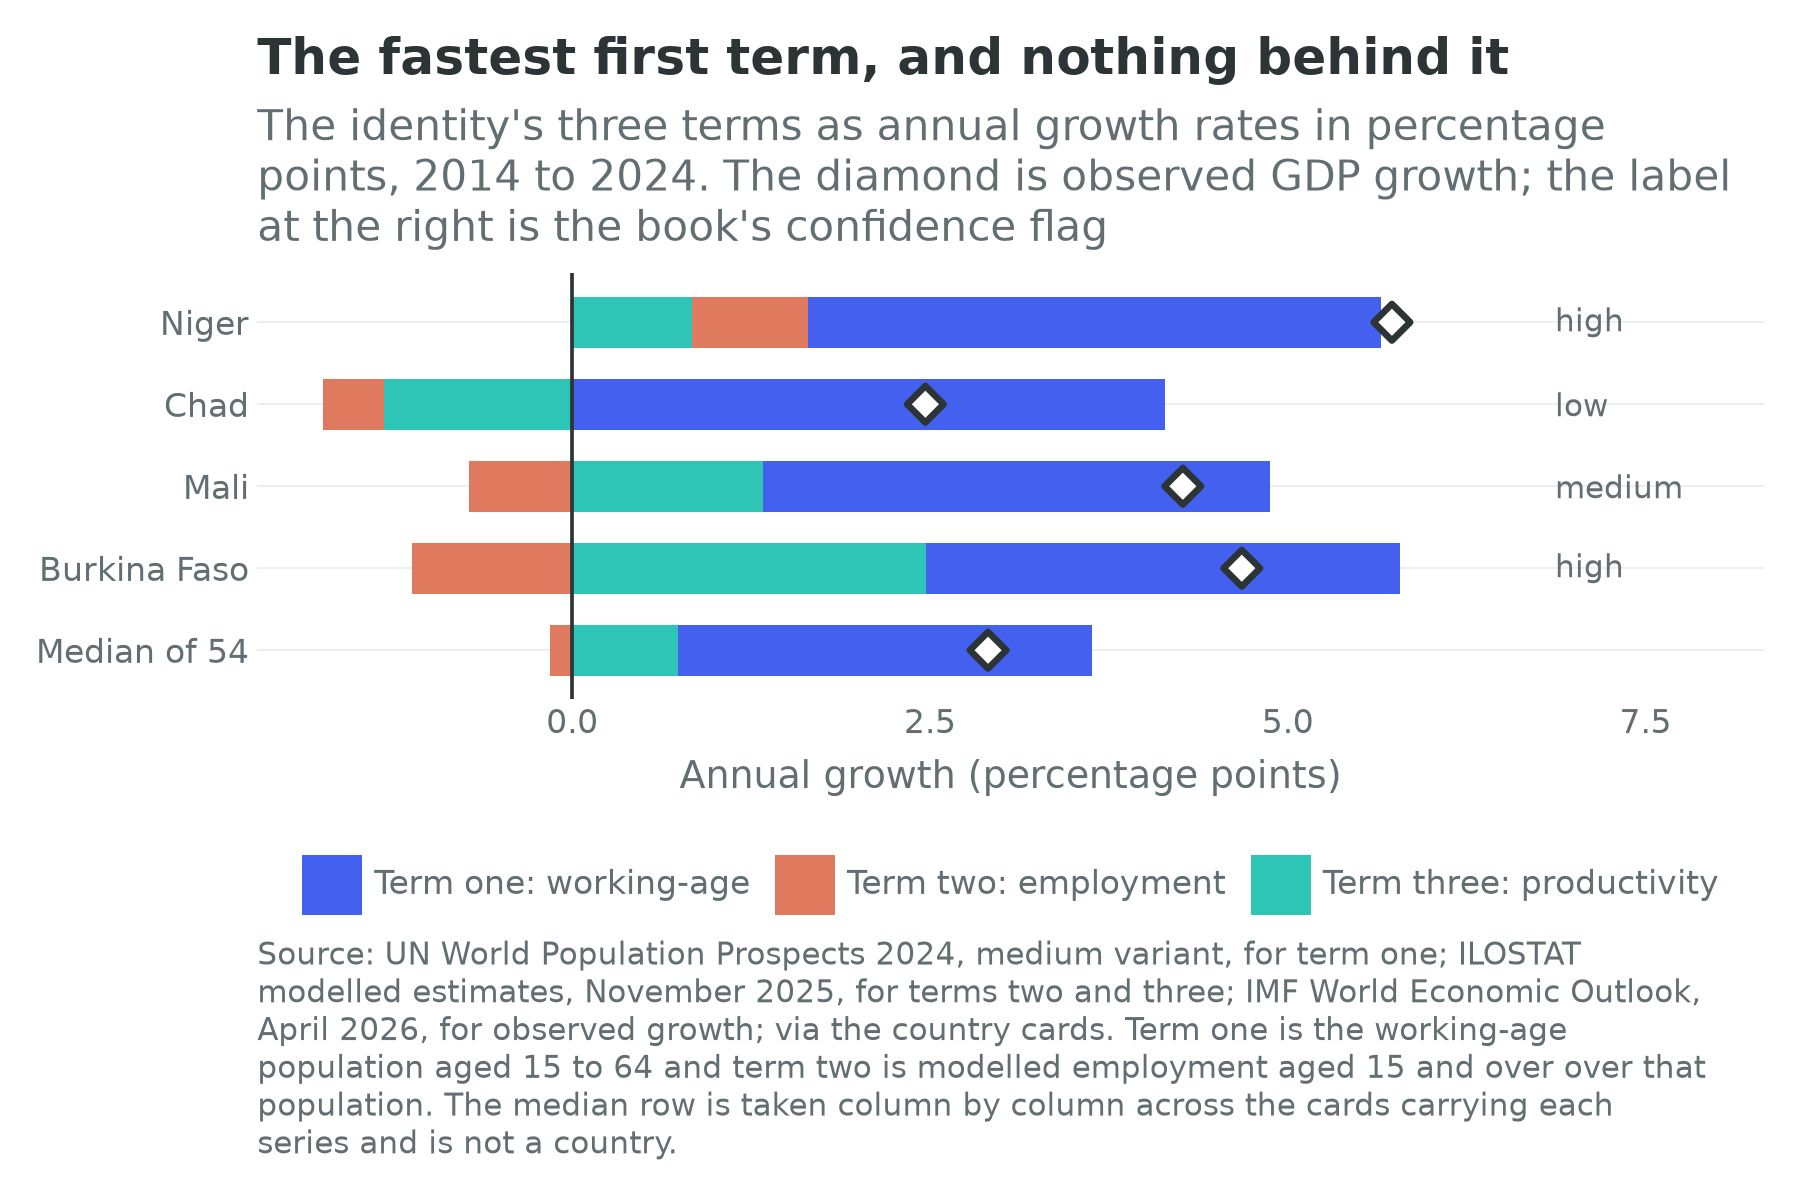
Term one is at the top of the continent and it is not close. Chad runs at 4.14 percent a year and Niger at 4.01, second and third of the 54 cards behind Uganda; Mali is eighth at 3.54 and Burkina Faso fourteenth at 3.31, against a continental median of 2.89. Mali, Niger and Chad all carry the doubler note, meaning the United Nations has them at least doubling their populations over the thirty years to 2054.
Term two is negative in three of the four. Burkina Faso’s employment ratio fell at 1.12 percent a year, the sixth largest decline of the 53 cards carrying the series; Mali’s fell at 0.72 percent and Chad’s at 0.43. Chapter 10 put Burkina Faso, Chad, Mali and Mauritania in its fourteen, the countries that added people of working age faster than they added work. Niger is the exception at plus 0.81 percent, and it is instructive rather than encouraging: it has the highest recorded informality of the 45 cards carrying the field, at 98.5 percent of employment, and the second lowest wage-employment share of the 53. A rising employment ratio where 98 in every 100 workers are informal is a statement about subsistence absorbing a cohort, not about firms hiring one. On the international definition almost everyone in the Sahel is employed, and Chad’s wage-employment share of 8.5 percent is the lowest of the 53 cards. Where the adding-up series and the overlays point in opposite directions, as in Niger’s row, the book follows the overlays.
Term three carries the surprise. Burkina Faso posted 2.47 percent a year, well above the continental median of 0.74; Mali posted 1.33 and Niger 0.84; only Chad is badly negative at minus 1.31. Three of the four have been getting more output per worker through a decade of insurgency. Burkina Faso is the only one carrying the within-and-between split, and it is the whole explanation: within-sector productivity growth of minus 0.67 percent a year against between-sector growth of 3.91. Nothing inside any sector improved; workers moved out of the least productive activity, which in Burkina Faso means off the land, and the average rose because the composition changed.
Set that beside Chapter 2’s distress-urbanization account and the mechanism is not a happy one. A farmer who leaves a field because an armed group has made it unfarmable, and who sells water in Ouagadougou instead, raises measured output per worker and has become more productive at nothing. Reallocation driven by displacement looks in the accounts exactly like reallocation driven by industrialization, and the difference is that one can be repeated for thirty years and the other stops when there is no field left to leave. The arithmetic itself holds tightly, implied and observed growth differing by 0.08 points in Niger, 0.07 in Chad, 0.11 in Mali and 0.02 in Burkina Faso, so the output series and the arithmetic agree. The split between terms two and three rests on a modelled employment count that this check cannot see, as Chapter 1 explains. What it decomposes is another question, and the last part of this section is about that.
The demography underneath
| Country | Total fertility | Median age (years) | Dependants per 100 of working age | Population 2024 (m) | 2050 (m) | 2100 (m) | Last census | Last labour-force survey | Statistical score | Confidence |
|---|---|---|---|---|---|---|---|---|---|---|
| Niger | 5.93 | 15.4 | 96.8 | 27.0 | 52.5 | 90.8 | 2012 | 2022 | 70.5 | high |
| Chad | 6.03 | 15.7 | 92.9 | 20.3 | 38.9 | 69.5 | 2009 | 2018 | 53.6 | low |
| Mali | 5.51 | 15.6 | 94.3 | 24.5 | 46.2 | 79.4 | 2022 | 2024 | 66.5 | medium |
| Burkina Faso | 4.11 | 17.5 | 80.0 | 23.5 | 37.3 | 49.9 | 2019 | 2025 | 76.4 | high |
| Mauritania | 4.63 | 17.3 | 85.0 | 5.2 | 9.4 | 17.1 | 2023 | 2024 | 58.4 | medium |
| Median of the 54 cards | 3.84 | 18.9 | 73.9 | 61.7 |
Table 36.3. Populations in millions, medium variant. The statistical score is the World Bank’s overall statistical performance measure. The confidence flag is this book’s rule, described in Chapter 1. Sources: UN World Population Prospects 2024 (medium variant), the World Bank Statistical Performance Indicators and the book’s census and survey table, via the country cards.
Chad records the highest total fertility on any card, at 6.03 births per woman, and Niger the fifth highest at 5.93. Niger is often described as having the world’s highest fertility and on this vintage it does not, since Chad, Somalia, the Democratic Republic of the Congo and the Central African Republic are all above it. The correction matters because the sentence is usually deployed to make Niger a category of its own, and the useful point is the opposite: four of the continent’s five highest-fertility countries are places where the state’s reach is contested, and the fertility and the contest have the same root in an economy that has never offered a household a reason to have fewer children. Chapter 2’s distinction applies exactly to the dependency column: these are not countries whose dividend has been delayed but countries that have not entered the transition that produces one. Burkina Faso is the partial exception on every demographic line, the one of the four that does not double by 2054, and it has the worst employment ratio of the four.
The settlement, 2020 to 2025
Chapter 5 read the seizures of power since 2020 as settlement changes rather than security events: most were adjustments inside an existing elite, made by armies whose grievance was about the terms on which the ruling coalition operated. The Sahelian instances are the core of the record. Soldiers took power in Mali in August 2020 and again in May 2021, in Burkina Faso in January 2022 and again that September, and in Niger in July 2023; in Chad the army installed the late president’s son at the head of a transitional council in April 2021 (Associated Press, 2025).
What followed is the part that belongs in an economics book. In September 2023 Mali, Burkina Faso and Niger signed a mutual-defence charter at Liptako-Gourma; in July 2024 they constituted themselves as a confederation, the Alliance des États du Sahel, which the African Union does not recognize as a regional economic community; in January 2025 their withdrawal from the Economic Community of West African States took effect, with a transition period through that July; and in March 2025 the confederation announced a levy of 0.5 percent on goods imported from outside it. The three cards carry the exit as a note.
For a landlocked economy, transit arrangements are trade policy. Every unit of Malian, Burkinabè and Nigerien trade that is not gold moves on a road to a port in a country the three have just left, and the ports are Abidjan, Lomé, Tema, Cotonou and Dakar. Chapter 7 gives the architecture and Chapter 19 the corridor economics; the point is that a decision taken for reasons of sovereignty raised the cost of every imported input and every exported bag of cotton, in three of the poorest countries on the cards, at the moment their working-age populations were growing fastest. The confederation’s logic is not irrational, since an alliance whose members expect to be sanctioned has a reason to build an alternative, but the economics are not in dispute. Chapter 5’s coding puts all four countries in its disordered-and-closed quadrant, and the settlement is doing what that predicts: a state whose first commitment is survival does not build a port, and a state that cannot secure a road cannot collect the duty that would pay the soldiers who secure it.
The French exit and the Russian entry
Chapter 33 records the end of the French security architecture in dates: bases closed or handed over in Mali in 2022, in Burkina Faso and Niger in 2023, and in Chad, Senegal and Côte d’Ivoire in 2025, leaving Djibouti as France’s only substantial permanent facility on the continent (Lawal, 2023; Agence France-Presse, 2025). Mali expelled a French force, a United Nations mission and a European training mission inside three years. The replacement is Russian, and Chapter 33 states its formula: a government facing an insurgency or a coup risk receives troops, trainers, equipment and an information campaign, and pays in mining concessions, in cash from the treasury, or in both (Africa Center for Strategic Studies, 2025c). What Russia does not supply is finance: no concessional window, no development bank and no measurable investment outside mining and nuclear.
The Sahel has therefore executed a swap, trading a security guarantor that came with a currency arrangement, a development budget and a set of conditions for one that comes with none of the three. Whether that was worth doing is a political question this book need not settle, and there is a serious case that the previous arrangement was not delivering security either. The economics are less ambiguous, because Chapter 33’s aid arithmetic lands hardest exactly here, in states that collect on the order of a sixth of output in tax and whose health systems were substantially externally financed, in the same years as the largest one-year contraction in the sixty-year history of development assistance.
The violence
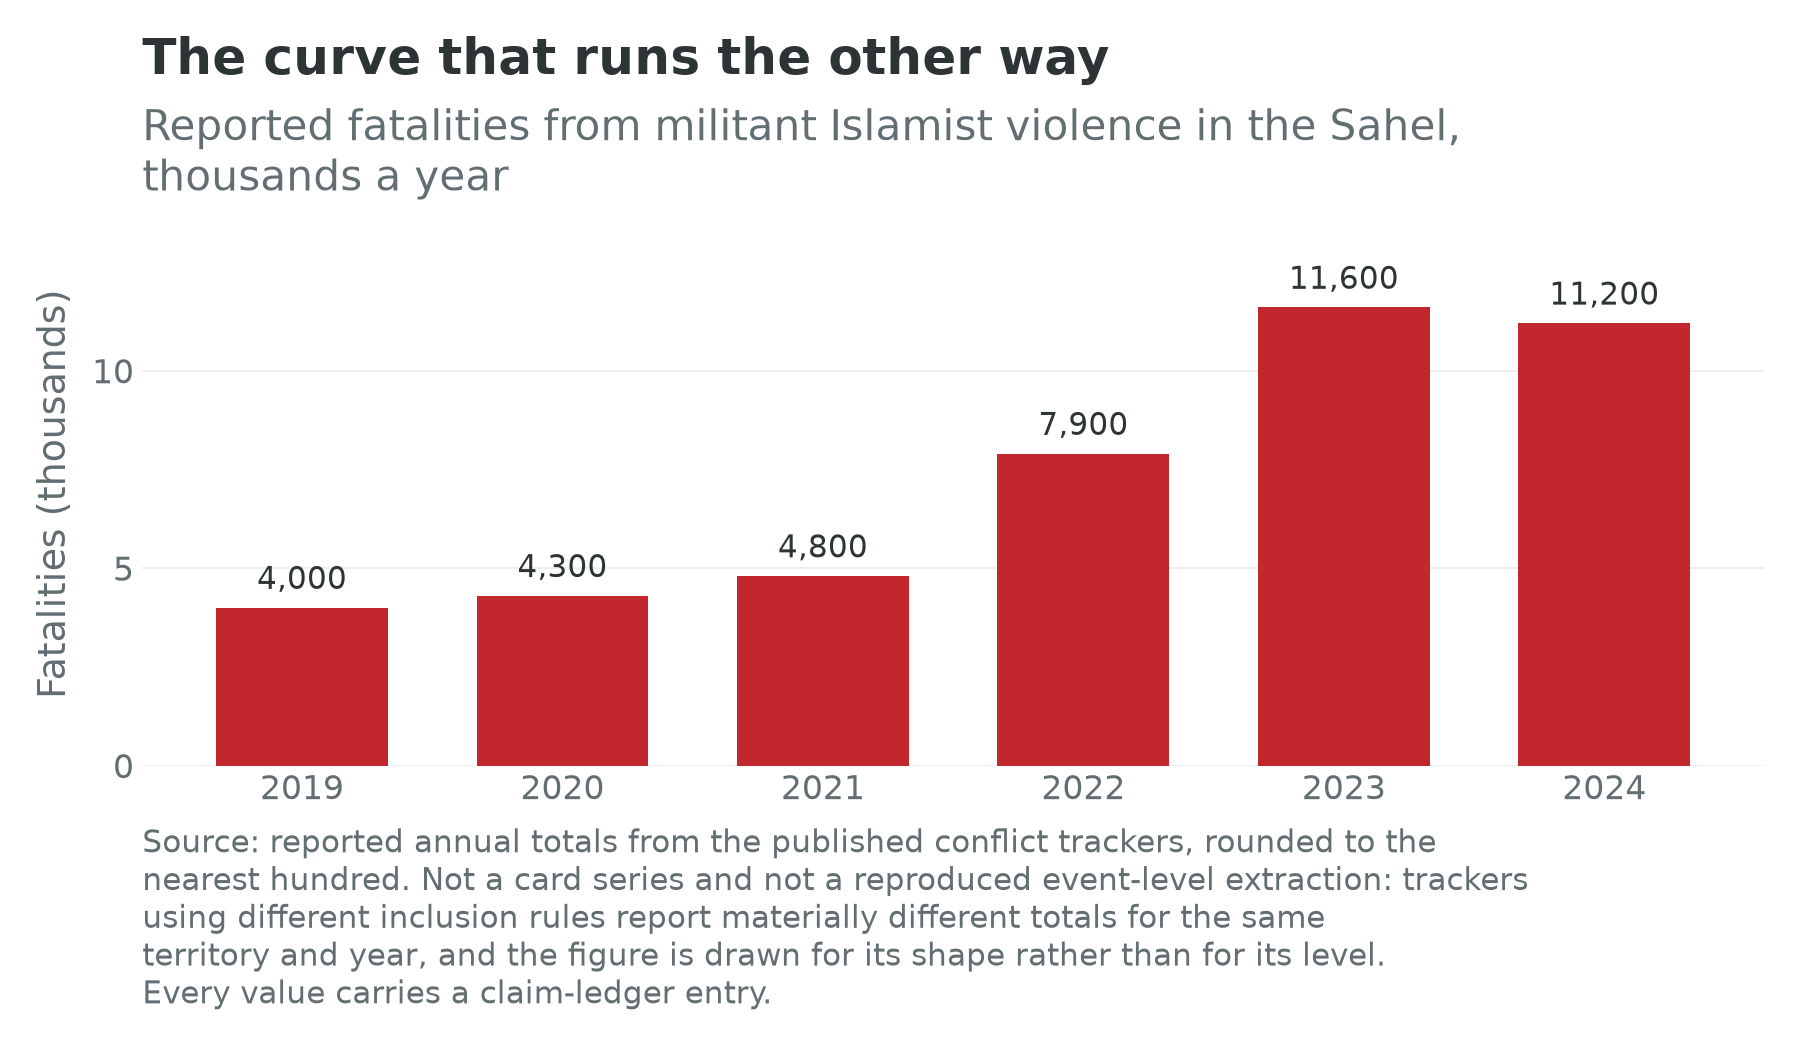
The insurgency began in northern Mali in 2012, spread into central Mali and then into Burkina Faso from about 2016. Reported fatalities from militant Islamist violence in the region roughly tripled between 2019 and 2023, to the order of ten thousand a year. The Global Terrorism Index counts a narrower category, and on its count the Sahel had more than half of the world’s deaths from terrorism in 2024 (Institute for Economics and Peace, 2025).
Give the numbers the treatment they need. Two trackers counting the same territory in the same year disagree by margins large enough to change a ranking, because they differ on what counts as an event, on whether communal violence and state reprisals are included, and on how a reported massacre with no independent verification is treated. This book therefore quotes the direction and the order of magnitude and refuses the count, the rule Chapter 31 applied to mineral flows across the Rwandan border.
Displacement is where the economics are legible. Burkina Faso recorded more than two million internally displaced people by early 2023, about a tenth of its population, and then stopped publishing the figure, which is itself a finding of the kind this book is built to notice: a government that has stopped counting the displaced has told you what it expects the count to show. Chad, with GDP per head of $1,165, hosts more than 1.2 million Sudanese refugees, 859,000 of them arrived since April 2023, and in its east one person in three is now a refugee (UNHCR, 2025a). How much of the national territory lies outside effective government control is asked constantly and answered by nobody with a stated method. The forty percent that circulates for Burkina Faso entered the record as a remark by an ECOWAS mediator in June 2022 (Al Jazeera, 2022); the Africa Center for Strategic Studies called it roughly half in August 2023, naming no source for the assessment (Africa Center for Strategic Studies, 2023); Burkina Faso’s own prime minister told the transitional assembly in January 2026 that nearly seventy-four percent of the country was under full state control (Ouédraogo, 2026), in the same season that analysts were putting the share held by the two insurgent coalitions at as much as sixty percent (Africa Defense Forum, 2025b). Those readings cannot all be right, the people making them have opposite interests in the answer, and for Mali no assessment publishes a share at all. What can be said without a number is that the violence is economic in its targets. Roads are mined, markets are closed, cattle are taken, schools are shut, and mining sites are taxed. Each is a transaction that used to happen and no longer does, and each is a subtraction from term two before it is anything else.
The climate
The Sahel is where the climate argument was first made and where it is least settled. The droughts of the 1970s and 1980s were among the twentieth century’s largest humanitarian events, rainfall recovered partially from the 1990s, and the region is warming at something like one and a half times the global rate. The published projections disagree about whether the west gets wetter or drier and agree that rainfall becomes more variable and more intense when it arrives, which for a rain-fed farming economy is worse than a lower mean.
The companion volume works through the consequences and this chapter cites them: the arable margin has moved south by something on the order of fifty to a hundred kilometres, and Lake Chad is a fraction of its extent in the 1960s, with the size of the fraction disputed and the recovery since the 1980s real (Wilse-Samson, 2026). Chapter 11 supplies the general condition: roughly ninety-five percent of Sub-Saharan cropland is rain-fed, so a Sahelian farmer without a tubewell has not converted a weather event into a pumping cost (FAO, 2024).
The mechanism that matters here joins the climate to the conflict, and it is not the one the popular account uses. Herders moving south into farming country because the pasture has moved is a real process, and one local institutions have managed for centuries. What is new is that the institutions which arbitrated it, the chieftaincies and the transhumance agreements, are the ones the state has stopped underwriting. Chapter 22’s land argument is the general form: a resource dispute becomes a war when there is no longer anybody both sides accept as an arbitrator, and the removal of the arbitrator is a settlement failure rather than a climate event.
The largest number in the regional climate literature is a projection and should be read as one, the World Bank’s modelling putting up to about 86 million people on the move within Sub-Saharan Africa as internal climate migrants by 2050 under its pessimistic scenario (Clement et al., 2021). And Chapter 34’s central finding applies without modification: the instruments the last decade of climate finance has produced need a bond market, a registry or a land title, and these four have almost none of the three.
The gold
The Sahel’s mineral economy is gold, and Chapter 13 hands it here because its economics are inseparable from its security. Mali is among Africa’s largest gold producers and Burkina Faso a significant one, and alongside the industrial mines sits orpaillage, artisanal and alluvial panning, which on the published estimates employs well over a million people across the three countries and produces a quantity nobody can state because most of it is not declared where it is dug.
Three things follow. The first is that gold is the one part of these economies that has done well: it is priced in dollars, it goes out by air or in a pocket rather than by road to a port, and it does not need the state. That is why term three in Table 36.2 is not worse: a commodity whose value rose was mined in countries whose other tradable sectors were closing.
The second is that a mineral with those properties finances whoever controls the site. Chapter 31 quotes Sánchez de la Sierra (2020) on the physical characteristics of an ore shaping the institutions that form around it, and gold produces the worst version of that, being concealable and therefore taxed at the point of consumption rather than at the mine. A high gold price in a territory the state does not reach is a subsidy to the people contesting it, and the box below gives the general finding.
The third is that the governments have noticed, and have moved to take more of the industrial rent. Niger withdrew a French company’s uranium permit and took control of the site; Mali fought a long dispute with a foreign gold major over a new mining code, seized gold stocks and placed the country’s largest complex under provisional administration; Burkina Faso adopted a code raising the state’s carried interest and nationalized several assets. Chapter 5’s vocabulary reads this as Chapter 34 read Zimbabwe’s carbon decree: moving to tax a valuable right that had been contracted away is what a state should do, and changing the terms of live contracts by decree gets a smaller rent to share. The result will show up in term three within five years.
What these numbers can and cannot bear
Chapter 31 closed with a method for arguing where the numbers are absent. This section applies it, with one finding that inverts the expectation the method was designed for.
Print the data-quality fields beside every claim and let them argue. Here they argue against the assumption. Burkina Faso carries a high confidence flag: a census in 2019, a twice-yearly employment survey most recently in 2025, a rebasing in 2026 and a statistical score of 76.4, the sort of record that would place it among the best-documented countries on the continent. Niger also carries a high flag, on a statistical score of 70.5 and a survey in 2022. Mali is medium and only Chad is low.
That is not what a reader who has been told the Sahel is a statistical void expects, and it is the most useful thing in this section. The confidence flag measures whether a statistical office produced a document, not whether the state reached the territory the document describes. A labour-force survey fielded in 2025 in a country where a substantial share of the territory is outside government control is an excellent survey of the part of the country a surveyor can reach. The bias is not random and its direction is known: the enumerator does not go where the fighting is, so the sample over-represents the places where markets still function and the estimate of the employment ratio is therefore too high. This is the clearest instance in the book of a data-quality rule failing in the direction of optimism.
Use the flag as a filter, and say what drops out. Switch a map into confidence mode and the Sahel largely survives while the Democratic Republic of the Congo, Sudan, Somalia and the Central African Republic vanish. A reader who took that as a ranking of how much to believe the two groups would have it backwards for the Sahel and right for the others, and the response is not to abolish the flag but to say what it is a flag about. Nor do Chapter 1’s correctives rescue it: nightlights cannot see subsistence farming, and a settlement burned and abandoned looks from orbit like one never electrified.
And say what the numbers can carry. They can carry the direction and rough magnitude of all three identity terms, the demographic levels, and the contrast between the four and the continental medians, which is far too large for measurement error to close. They cannot carry a Chadian per-head figure to more than one significant figure, given a census from 2009 and no recorded rebasing; a claim about employment in the districts the surveys do not reach; or a fatality count. Nor can the fragility flag beside the confidence flag carry one: it is the World Bank’s list of fragile and conflict-affected situations and nothing else, a register with two columns and no scale running between them, and it is deliberately not a measure of intensity, because the event data set that would supply one cannot be licensed on terms this book can meet.
The dividend that never arrives
The Sahel is the acute case. The chronic one is a continental version of the same failure, and it is more likely.
The demographic dividend has always been a conditional, and the literature that named it said so. Bloom, Canning and Sevilla (2003) is the standing statement: the age-structure shift creates an opportunity and delivers it only where policy allows the additional workers to be employed and the additional savings invested, so the same demography produced an East Asian miracle and a Latin American disappointment. Lee and Mason (2006) split the mechanism, and Chapter 2 carries the split: the first dividend is arithmetic and expires when the working-age share peaks; the second is behavioural, permanent, larger, and conditional on financial institutions most of the countries in this chapter do not have. Three things could go wrong, and they are separable.
The transition could stall. Bongaarts (2008) established that fertility transitions in several developing countries had halted mid-course, and Shapiro and Hinde (2017) put the pace in the statistic Chapter 2 quotes: twenty years after peak fertility for Sub-Saharan Africa’s rate to fall by 10 percent, against ten in Asia and in Latin America and the Caribbean, and fifteen in Northern Africa. Shapiro and Gebreselassie (2008) documented the pattern that gave it its name, falling and stalling, in Kenya and Ghana; Schoumaker (2019) revisited the evidence and reached the more careful conclusion that matters for a book quoting projections, that stalls are real, less common than the earlier literature claimed once data quality is accounted for, and sometimes survey artefacts. Kenya’s and Ghana’s declines resumed; Nigeria’s has been slow throughout and decides the continental aggregate, at 4.38 births per woman on 232.7 million people. The projection consequence is what to watch: the medium variant’s African fertility paths assume declines faster than the recent record, and if they are wrong in the direction the stall literature suggests, the working-age share rises later and the first dividend arrives smaller than every planning document assumes, without anything catastrophic in any single year. That is Chapter 4’s counter-case path, compatible with continued announcements that Africa is growing.
The bulge could arrive without the employment. This is Chapter 10’s finding restated as a risk rather than a description. The employment ratio across the 53 cards carrying it had a median of minus 0.15 percent a year over the decade to 2024, and Chapter 5 found the countries it codes as having the best settlements and the worst converting their demographic inheritance into employment at almost exactly the same rate. Twenty-one of the 54 cards record observed output growth below their own working-age population growth, which is output per person of working age falling over a decade. If the middle term does nothing for another twenty-five years while term one delivers, the arithmetic is not a dividend and not a catastrophe: it is a continent that grows at three percent a year and does not become richer.
And the bulge could be dangerous. Urdal (2006) tested the proposition on a large cross-country panel and found large youth cohorts associated with an increased risk of political violence, the association stronger where economic conditions are poor and the cohort is educated into an economy with no positions for it, and Cincotta, Engelman and Anastasion (2003) had made the security version earlier. The finding is real, the effect sizes are modest and the mechanism is contested. It is also exactly the configuration Table 36.2 describes, and Chad’s youth measure is the continent’s high end, at 42.3 percent of young people not in employment, education or training against a median of 24.5 across the 48 cards carrying it.
The indicator, for all three, is the one Chapter 4 named: the wage-employment share in the large low-income countries. If it rises there rather than in the small well-governed ones, the dividend is arriving; if measured output per worker rises while it falls, the bulge reading is right.
The second wave
Chapter 21 owns the debt and this section takes only the failure mode from it. The wall of the 2020s was refinanced rather than repaid: African sovereigns raised about $13.7 billion of new bonds in 2024 (Intelpoint, 2025), and the first issues of that year were priced at 8.4 to 10.4 percent (Direction générale du Trésor, 2024). A sovereign that rolls a ten-year bond at a higher coupon has bought time and committed to paying the difference every year for a decade, and whether that was worth doing depends on what the first borrowing bought, which is a question about term three.
The failure mode is the conjunction. Suppose growth disappoints for two or three years across a group of these borrowers at once, through a commodity price, a drought, or a slowdown in the economies that buy from them. Revenue undershoots the debt-sustainability analysis; the primary balance it assumed turns out to be a political forecast dressed as an arithmetic one, which Kenya’s Finance Bill of 2024 established at a cost of at least twenty-four lives; spreads widen; the window closes for the weakest two or three; and the Common Framework’s three-year timetable begins again in several countries at once.
The watch list is short and the cards say why. Senegal carries an external debt stock of $47.1 billion against an economy of $37.1 billion after the restatement of 2025, on a five-year growth forecast of 2.93 percent a year, roughly half what its identity terms over the previous decade would have predicted. Kenya carries $42.9 billion against $136.5 billion of output and refinanced its 2024 maturity against a market that had been pricing a default. Ethiopia carries $36.5 billion against $109.1 billion, spent five years in the Common Framework, a treatment of its official bilateral debt, and defaulted on its only Eurobond, of $1 billion, in December 2023 (International Monetary Fund, 2026b).
What a second wave would do to the identity is not a mystery. It lands on term three through the investment channel: a government spending a large share of revenue on external debt service is not the government that electrifies the industrial park. It reaches term two indirectly and slowly, through the firms that would have hired, and term one not at all. This is the failure mode with the clearest transmission and the shallowest depth, a lost decade rather than a lost century, and its indicators are public and daily: the spread over the benchmark, the ratio of debt service to revenue, and whether a legislature has passed the revenue measures the programme assumes.
The arc of wars
Conflict is the failure mode that touches all three terms, and the one where the book’s numbers are worst. Sudan’s war since April 2023 has produced the largest displacement crisis in the world, on the order of twelve million people displaced inside the country and across its borders (UNHCR, 2025b), with famine confirmed by the international classification’s review committee in Darfur’s Zamzam camp in August 2024 (UNICEF, 2024) and in further areas since. The card records observed growth of minus 4.91 percent a year over the decade, output per worker falling at 2.87 percent, and a last labour-force survey from 2011. Chapter 10 records that Sudan is one of only two cards where the identity does not add within 1.5 points, because the employment series does not carry the collapse. The country with the world’s largest humanitarian catastrophe is one whose economic statistics cannot see it.
Eastern Congo is Chapter 31’s, with more than seven million displaced and two provincial capitals lost in 2025 (OCHA, 2025). Ethiopia’s Tigray war and the Amhara insurgency that followed are Chapter 29’s, and that chapter carries the exhibit this section needs: damage to infrastructure put at $22.7 billion with a further $6 billion of productivity losses in the first fourteen months alone, about 26 percent of a year’s output, and cumulative losses reaching roughly $125 billion by 2027 (Oxford Initiative on Peace and Recovery in Ethiopia, 2022). Mozambique’s insurgency in Cabo Delgado sits on a liquefied natural gas project and Cameroon’s anglophone conflict has run since 2017 in two of its ten regions, with employment ratios falling at 0.47 and 0.99 percent a year. The scale is the argument: twelve countries carrying an active insurgency or a recent war hold 489.2 million people between them, 32.3 percent of the continent, produce 15.5 percent of its output, and reach 882.7 million by 2050, and seven of the twelve carry a low confidence flag, two a medium one, two a high one, and one cannot be flagged at all.
The Ethiopian figure is the one to hold, because it prices what the identity cannot. A war destroys the capital stock that term three is made of, removes the market that term two needs, and reaches term one through mortality, displacement and emigration. It also destroys the apparatus that would measure any of the three, which is why the estimate comes from a university initiative rather than a statistical office, and Chapter 31’s rule applies: where the state does not count, somebody else’s estimate is the only number there is.
The indicator here is not a fatality count. It is displacement, because a displaced household is one that has left a market, and the count is produced by agencies whose incentive is to publish. The second is whether the statistical office is still operating, the cheapest available signal that a state still expects to govern the territory it claims.
The climate tail
Chapter 34 carries climate finance and its instruments. What belongs here is the physical tail, and the distinction is the whole point: the damage arrives not as a slowly rising average but as a failed season, an empty reservoir and a crop band that has moved. Three exhibits, each already in the book.
The Horn drought is the preview, and Kariba the grid version. Five consecutive failed rainy seasons in the Horn between late 2020 and 2023, the worst in forty years and an event attribution work found roughly a hundred times more likely because of human-caused warming (World Weather Attribution, 2023); then usable live storage at Kariba at 8.7 percent in August 2024, the 1,080 MW Kariba North station shut in September, Zambian load-shedding of up to twenty hours a day, and mines that run three shifts or do not run (Energy Regulation Board of Zambia, 2025). Chapter 14 has the arithmetic that generalizes the second: about a fifth of African generation is hydroelectric, Zambia was 82 percent hydro in 2024, Ghana’s hydro plants, Akosombo the largest, produced about 40 percent of its electricity in the first half of 2024, and Ethiopia is 94.5 percent hydro by installed capacity (Ghana Energy Commission, 2024; Ethiopian Electric Power, 2025). A drought in these systems is a fiscal event, not a weather event.
The crop bands are the slow version. Cocoa’s suitable area in Côte d’Ivoire and Ghana is projected to contract and shift upslope, and there is not much upslope in either country (Schroth et al., 2016); a large share of Ethiopia’s arabica area could become unsuitable by the end of the century, while relocation to higher ground could in principle multiply it several times over (Moat et al., 2017). What decides between the two halves is whether a smallholder can move, replant and wait five years for a tree to bear, which is a question about land tenure and credit rather than about climate.
And heat has the widest reach. Burke, Hsiang and Miguel (2015) found output peaking at an annual average temperature of about 13 degrees Celsius and falling sharply above it, a relationship unchanged since 1960 and present in rich and poor countries alike; Dell, Jones and Olken (2012) found a one degree rise in a poor country’s annual temperature reducing growth by something on the order of 1.3 percentage points; Kalkuhl and Wenz (2020), on subnational regions, found marginal damages larger than most integrated assessment models assume and largest in the tropics.
Now qualify it, because this literature is regularly over-applied. The relationship is estimated from year-to-year variation, so using it to price a permanent warming assumes that adaptation over decades looks like adaptation within a year, which it does not. The African coefficients also rest on the statistical apparatus Chapter 1 spent its length on, and a growth series that is a projection off a forty-year-old census is a noisy dependent variable. The sign is well established, the magnitude for African warming paths is not, and the direction of the bias is unknown. Chapter 34’s caution applies here in a different shape. The cards carry a climate-vulnerability tercile on fifty-three of the fifty-four, ranked among the African countries the index covers, so a chapter may say which third of the continent a country sits in without quoting a score, and none is quoted anywhere in this book. The Sahelian four sit where this section would put them: Mali, Niger and Chad in the worst third, with Mauritania at the top of it, and Burkina Faso in the middle. Nigeria sits in the best third, and that is the field stating its own limitation: the index is national, the north of Nigeria is not Nigeria, and a country large enough to contain both a Sahelian frontier and a delta averages the two away. The indicators this section actually watches are physical, published and sub-national: reservoir storage against the same week last year, consecutive below-average seasons, and the crop-suitability maps as they are revised.
The trap before the middle
The fifth failure mode is the one that arrives without an event, and it is the one this book thinks most likely.
The classical middle-income trap describes an economy that industrializes, reaches middle income, and then cannot make the second transition into higher-value production. What the counter-case describes is worse and earlier: an economy that never industrializes, arrives at the trap’s symptoms at a quarter of the trap’s income, and stays there. Its components are all in this book.
Premature deindustrialization and the dual firm. Manufacturing everywhere absorbs less labour at a given income than when Korea industrialized, and developing countries deindustrialize at incomes far below the early industrializers’ (Rodrik, 2016). Underneath it, large firms raise productivity without adding employment while small firms add employment without raising productivity, so the two halves of the recipe never meet (Diao, Ellis, McMillan and Rodrik, 2021). Chapter 15 works the first through at plant level and Chapter 6 explains why the small half stays small.
The resource-rent trap. Chapters 12 and 13 carry it. A rent is captured without employing anybody, appreciates the currency against the tradable sectors that would, and is the asset a settlement is easiest to organize around. Chad’s row is what that looks like after a decade: term three at minus 1.31 percent a year in an oil economy.
The services rungs, education without jobs, and the consumption city. Chapter 17’s layer of the digital economy that produces contracts, payslips and payroll taxes is the smallest of that sector’s four and the most exposed. Chapter 20’s configuration delivers certificates into an economy with no positions. And Chapters 6 and 22 carry the last: density without tradable production is urbanization without industrialization, and it does not deliver the productivity gain urbanization delivered elsewhere (Gollin, Jedwab and Vollrath, 2016).
Nigeria is the exhibit, and it is uncomfortable because it is the largest thing on the continent. Its working-age population grew at 2.90 percent a year over the decade, its employment ratio rose slightly at 0.29 percent, and its output per worker fell at 1.94 percent, giving observed growth of 1.20 percent. More people worked and each produced less. The within-and-between split says it twice: within-sector productivity at minus 1.19 percent a year against between-sector at 1.48.
This failure mode has no date and no headline, which is what makes it the most probable one. The indicator is the share of employment in tradable production, in goods or in tradable services, and Chapter 10’s overlays are where it would show up first.
The machines
The sixth objection is the one Chapter 4 said defeats the case rather than delaying it, and Chapter 35 carries it as a scenario axis. What belongs here is narrower: not the world in which the frontier stops needing workers, but the things that go wrong on the way there.
The offshoring industry is lost first. Chapter 17’s account of Sama is the single firm in which the argument is visible: an impact-sourcing venture that recruited from low-income Nairobi neighbourhoods and from refugee communities to label data and moderate content, whose largest contract ended in 2023 with more than a thousand jobs, and whose litigation has run in the Kenyan courts ever since. The work that layer sells is by construction the work of training a machine to do the work. Chapter 17’s exposure arithmetic has an uncomfortable shape: Africa is the least exposed region on earth to the first wave, because most Africans work informally in agriculture and petty trade, and the protection consists of being too poor to be worth automating (Gmyrek, Berg and Bescond, 2023). The exposed layer is precisely the one an African graduate entered in the 2010s because it was tradable and needed no port.
The apparel rung is automated next. Cut-and-sew and entry-level assembly are the tasks automation reaches earliest, being repetitive, indoors and performed on standardized objects, and Chapter 15 records that Ethiopia has already had that rung removed once by a political decision rather than by a robot, with Chapter 33 on what a lapsing trade preference did to Kenyan, Lesotho and Malagasy plants.
The power goes to the data centre. Chapter 14 has the sharpest version, and it is not hypothetical: a hyperscale campus announced in Kenya in 2024 wanted an initial 100 MW with the potential to reach 1 GW, in a country with about 3,000 MW of installed capacity, and by 2026 it had stalled on that arithmetic, the president saying that switching it on would mean shutting off power to half the country (Semafor, 2026). A country that allocates a third of its capacity to a foreign hyperscaler has taken an industrial-strategy decision while believing it took an investment decision.
And the ground is enclosed. Chapter 34’s finding is that the carbon enclosure is the second world’s first land grab and that it happened in 2023, before anybody had automated anything.
The counter-case to the counter-case belongs on the same page, because this book’s rule is that it always does. The same technologies are adaptation tools, and the one African trial in this book is encouraging: Chapter 20’s six-week pilot in Edo State gave about 800 secondary students a language model as an English tutor under teacher supervision and reported gains among the most cost-effective on record, at a cost on the order of $48 per student (World Bank, 2025b). Hold it at arm’s length, as Chapter 20 does: one small trial, after school, supervised, with no evidence on durability. What it establishes is that the cost structure of remediation may be about to change in a region whose binding constraint is teachers it cannot hire. The machines that take the rung may also teach the person who was going to stand on it.
What the evidence says
What the conflict and climate literatures establish about African tail risks, and what they do not
Wars and droughts cannot be randomized, so everything here is quasi-experimental, and the standard of proof is whether the instrument is plausibly unrelated to the outcome except through the channel claimed.
Income shocks cause conflict, and rainfall was the first credible instrument. Miguel, Satyanath and Sergenti (2004) used year-to-year variation in rainfall growth as an instrument for economic growth across 41 African countries from 1981 to 1999 and found a five-percentage-point fall in growth raising the likelihood of civil conflict in the following year by more than half. Ciccone (2011) showed the result to be sensitive to whether rainfall levels or growth rates are used and to mean reversion; Sarsons (2015) ran the sharpest test, using Indian districts downstream of dams whose income is insulated from rainfall, and found rainfall still predicting rioting there. If rainfall moves conflict through channels other than income, it is not a valid instrument for income. What survives is that rainfall shocks predict conflict; what is contested is that they do so because of income.
Prices move conflict, and the mechanism is local and commodity-specific. McGuirk and Burke (2020) split the effect of food prices geographically: in food-producing areas, higher prices lowered conflict over control of territory and raised conflict over appropriation of the surplus; in areas without crop agriculture, higher prices raised both forms, so a national coefficient masks effects with opposite signs. Berman, Couttenier, Rohner and Thoenig (2017) did the mineral version on an African grid from 1997 to 2010, finding a mineral price rise raising conflict where that mineral is mined, which is the general form of the mechanism the gold section describes.
Temperature is associated with conflict, and the aggregate estimates are the least secure part of the literature. Hsiang, Meng and Cane (2011) found civil conflict in the tropics roughly doubling in El Niño years relative to La Niña years, and Hsiang, Burke and Miguel (2013) assembled 60 studies into a common effect size, a synthesis criticized for pooling scales and for a publication filter. The association is real, the mechanism runs through income and displacement rather than through heat directly, and no coefficient here should price a future warming path.
The review is the honest summary. Blattman and Miguel (2010) went through the cross-country civil-war literature and found the standard regressors poorly measured, the theory underspecified and the identification weak. Fearon and Laitin (2003) is the finding that survived: what predicts insurgency is conditions favouring it, above all a weak state over rough or remote terrain, rather than ethnic diversity or grievance, which describes the Sahel and eastern Congo. And Powell and Thyne (2011) is a dataset rather than a theory: it establishes frequency and clustering, and supports no claim about the economic consequence of a coup, because the country that has one was not a random draw.
The defensible position is narrow and useful. Income shocks and commodity prices raise conflict risk in poor agricultural economies, weak states over difficult terrain are where insurgency takes hold, and both mechanisms are present at once in the places this chapter is about. What it cannot do is tell a finance minister how much conflict a given warming path or price fall will produce.
How a shock propagates
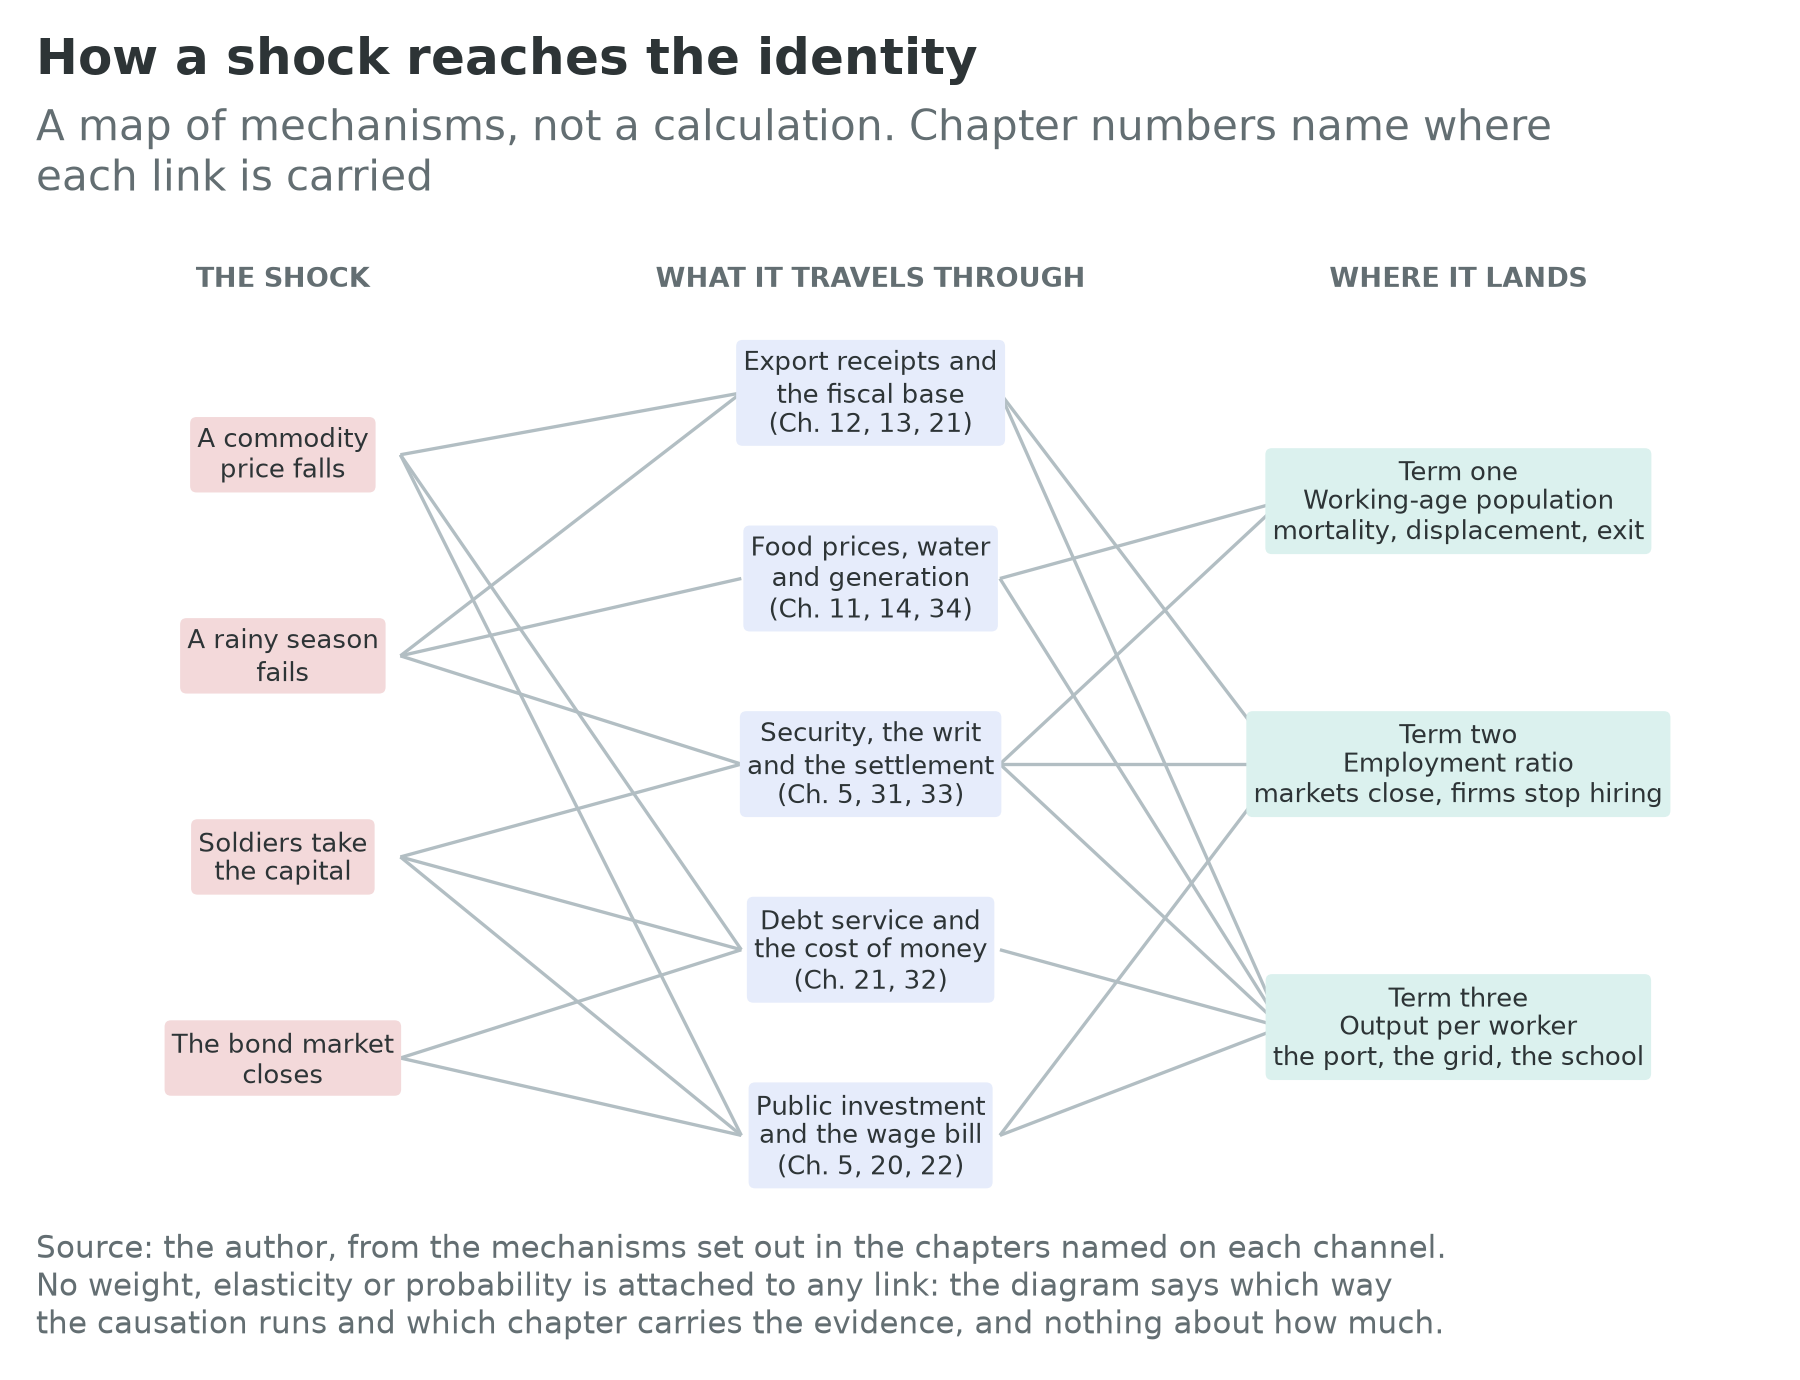
This book’s plan once carried a shock-propagation calculator, and it was demoted to a figure for a reason worth stating in the text. A calculator would have to assign a number to every arrow, and there is no defensible number for most of them: the elasticity of Malian employment to a copper price is not a quantity anybody has estimated, and putting an invented one behind a slider would produce exactly the false precision Chapter 1 argues against.
Read it as three claims. The same shock arrives by different routes in different economies: a commodity price fall reaches an oil exporter through export receipts and the fiscal base, and reaches a landlocked agricultural economy through the cost of imported fuel and fertilizer, which is the opposite sign, so a continental average of the two is a number without a referent. The settlement is a channel and not a background condition, which is why the diagram puts Chapter 5’s loop in the middle band rather than off to the side: a coup does not reach the identity by any route that does not pass through it, and a drought in a state with a functioning transfer system and a drought in one without are different events. And the channels run at different speeds, which the diagram cannot draw. A bond market closes in an afternoon, a harvest fails in a season, a settlement changes in a week and then takes a decade to show, and a crop band moves over thirty years. A reader tempted to add the arrows should notice that some have not finished arriving.
Failure modes in two worlds
Chapter 1 asked every chapter to say what its subject becomes if the frontier of production stops needing workers, and this chapter’s answer is the one that sorts the whole list.
In the labour-abundant world, a lost decade is a jobs catastrophe. Term one delivers regardless, ten to twelve million young people enter the labour market each year, and every failure mode above is an account of why the other two terms failed to meet them (AfDB, 2016). The cost is measured in people who spent their working lives in subsistence, and the remedy always has the same shape: a state that can collect, a firm that can hire, and a market that stays open.
In the labour-redundant world, a lost decade is not a deviation from the path. It is the path. If the frontier does not need workers, an economy that fails to employ its cohort has not failed at anything the world economy was going to reward, and the failure modes reorder: the debt wall matters less, the middle-income trap stops being a trap and becomes a description of the equilibrium, and the machines section stops being a risk and becomes the setting.
Three failure modes are common to both worlds, and a reader should weight them most heavily for that reason. Conflict, because a war destroys assets, and a country whose territory is contested cannot sign an enforceable contract over its sun, its land or its ore, which is the only thing the second world would pay it for. Climate, and worse in the second, because there land is the asset and a hectare whose value is carbon, solar or food has that value set by physical conditions the country does not control. And the settlement, which is decisive in the second. In the labour-abundant world employment is what makes a growth bargain self-enforcing, because a wage-earning class acquires organizational power and settlements must accommodate power. In the labour-redundant world that mechanism is gone: every rent, from a licence to a mine to a carbon credit, is captured without employing anybody, and an elite that does not need its population in order to produce has no economic reason to bargain with it.
Which is why the Sahel is at the centre of this chapter rather than at its edge. Four states with the fastest first term on the continent, an employment ratio going backwards, a gold economy that pays whoever holds the site, a sun a data centre would want and a population that nothing in either world obviously needs, are not an exception to the book’s argument. They are the book’s argument, run for a decade, with the second and third terms removed. Whether that is a warning or a preview is Chapter 35’s question.
Connections to Other Chapters
- Chapters 2 and 4 (The Demographic Century; The Case and the Counter-Case) own term one and the fertility stall, and stage the six objections this chapter converts into failure modes.
- Chapters 5 and 7 (States, Political Settlements, and Development Bargains; Regional Architecture) supply the settlement reading of the seizures of power, the coding that puts all four Sahelian states in the disordered-and-closed quadrant, and the community the three left.
- Chapter 10 (Labor, Youth, and Migration) carries the fourteen countries in which a fast term one met a falling term two, four of them in this chapter’s Sahel.
- Chapters 11, 12, 13, 14, 30 and 34 (Agriculture; Oil and Gas; Critical Minerals; Energy; the Copperbelt; Climate Finance) carry the climate exhibits, the commodity exposure and the mineral-price mechanism, and hand the Sahel’s gold to this chapter.
- Chapters 15, 17 and 20 (Manufacturing; Digital; Human Capital) carry the rungs of the ladder this chapter argues may be removed, and the tutoring pilot that is the counter-case to the counter-case.
- Chapter 21 (Capital and Sovereign Debt) owns the wall, the Common Framework’s four cases, and the Senegalese restatement.
- Chapters 29 and 31 (Addis–Djibouti; Where the State Is Thin) carry the two conflicts cited at length here, and Chapter 31 supplies the method for arguing where the numbers are absent.
- Chapter 33 (The Other Partners) carries the French withdrawal, the Russian entry and the aid retreat of 2025, and Chapters 35 and 37 (Scenarios; The Playbook) turn these mechanisms into paths with their assumptions exposed, and into what to do about them.
Discussion Questions
Burkina Faso carries a high confidence flag on a 2019 census, a 2025 employment survey and a statistical score of 76.4, in a country where a large share of the territory is reported to be outside government control. Explain what the flag is measuring and what it is not, state the direction of the bias in an employment estimate drawn from a survey an enumerator can field only in the accessible districts, and propose one additional card field that would catch the problem.
This chapter argues that Burkina Faso’s output-per-worker growth of 2.47 percent a year, made up of minus 0.67 within sectors and 3.91 between them, is displacement showing up in the accounts as structural change. Construct the strongest case that it is genuine reallocation and the chapter is wrong, then name two observations, available before 2035, that would distinguish the two readings.
The conflict literature supports the claim that income shocks raise conflict risk and does not support a coefficient a finance minister could use. A colleague proposes to use the temperature-output estimates anyway, on the grounds that an imperfect number beats no number when a budget has to be written. Argue against that position using this chapter’s box, then argue for it, and say which you would defend to a minister who has to decide something on Monday.
Try It
Open the Growth Pole Map and switch on the confidence toggle, which fades every country flagged low or with no computable flag. Watch this chapter’s two groups: the Sahel four largely survive, because Burkina Faso and Niger are flagged high and Mali medium, while the Democratic Republic of the Congo, Sudan, Somalia and the Central African Republic fade. Then open the four Sahelian cards and read, for each, the three identity terms, the wage-employment and non-agricultural overlays, and the four data-quality fields in that order. Write one paragraph on a single question: if the layer tells you to trust Burkina Faso’s numbers more than Sudan’s, is it right? Argue for one of three positions: the flag is right; the flag is right about the statistical system and wrong about the country, which is this chapter’s position; or a composite that can be this misleading should be abolished. Then say what the map should hatch instead.
Data Exercise
Download all fifty-four cards from the country cards page on this site, as cards.csv if you work in a spreadsheet and cards.json if you want the release each number came from travelling beside it. Build a table with these fields: identity.working_age_pop_growth, identity.employment_to_wa_growth, identity.gdp_growth_observed, overlays.wage_employment_share, scale.informal_employment_share, scale.population, scale.gdp_usd, data_quality.last_lfs_year and data_quality.confidence_flag. Then do four things.
First, select every card whose identity.working_age_pop_growth is above 3.5 and whose identity.employment_to_wa_growth is below zero, and report for each its data_quality.confidence_flag and data_quality.last_lfs_year. Write two sentences on whether the flags are what you expected, and on what a survey year tells you that a flag does not.
Second, widen the screen to term one above 3.0 and term two below zero, count the countries you gain, and report their combined scale.population and scale.gdp_usd as shares of the continent’s. Say why the threshold is a convention rather than a finding.
Third, compute for all 54 the difference between identity.gdp_growth_observed and identity.working_age_pop_growth, rank it, and list every country where it is negative. That is output per person of working age falling over a decade. Then check how many carry a low or unset data_quality.confidence_flag, and write two sentences on whether the list would look different if you could see only the well-measured countries.
Fourth, regress identity.employment_to_wa_growth on scale.informal_employment_share across the 45 cards carrying both, and then on overlays.wage_employment_share across the 53 carrying that. Report both, and explain why a positive coefficient on informality would be evidence for this chapter’s reading of Niger rather than against it. Treat nulls as missing, never as zeros: a country with no recorded survey is not a country with no labour market.
Data Sources and Further Reading
Key data sources
- The country cards for every identity term, demographic level, balance-sheet line and data-quality field quoted here: UN World Population Prospects 2024 (medium variant, ages 15 to 64) for term one and the demography, ILOSTAT modelled estimates (November 2025) for terms two and three and the overlays, the IMF World Economic Outlook (April 2026) for output and growth, World Bank International Debt Statistics, 2025 release, for the debt stocks, and the World Bank Statistical Performance Indicators with the book’s census and survey table for the data-quality layer. The GGDC Economic Transformation Database supplies the within-and-between split, which among the Sahelian four exists only for Burkina Faso.
- ACLED and the Africa Center for Strategic Studies for the record of seizures of power, the conflict series behind Figure 36.2 and the Russian security deployments; UN OCHA, UNHCR and the humanitarian agencies for the displacement counts (UNHCR, 2025a, 2025b); the Integrated Food Security Phase Classification review committee for the famine determinations in Sudan. These are reported magnitudes rather than card fields and each carries an entry in the book’s claim ledger.
- World Weather Attribution for the Horn drought attribution; the Notre Dame Global Adaptation Initiative ranking, quoted for its ordering only, since the cards carry no vulnerability score; the World Bank Groundswell modelling for the internal climate-migration scenario; and Afrobarometer for what citizens report about a state that does not report about itself.
Further reading
- Christopher Blattman and Edward Miguel, “Civil War” (2010), which should be read before any of the cross-country conflict literature it is about, with James Fearon and David Laitin (2003) for the finding that survived it.
- John Bongaarts (2008) and Bruno Schoumaker (2019), for what a fertility stall is and how often it is a survey artefact, and David Shapiro and Andrew Hinde (2017) for the regional pace Chapter 2 quotes; David Bloom, David Canning and Jaypee Sevilla, The Demographic Dividend (2003), for the conditional in its original form, with Ronald Lee and Andrew Mason (2006) on the two dividends.
- Henrik Urdal (2006) for the youth-bulge finding at its most careful, with Richard Cincotta and co-authors (2003); Edward Miguel, Shanker Satyanath and Ernest Sergenti (2004), read with Antonio Ciccone (2011) and Heather Sarsons (2015), as a short course in what an instrument has to satisfy; and Jonathan Powell and Clayton Thyne (2011) for the coup dataset.
- Marshall Burke, Solomon Hsiang and Edward Miguel (2015) with Melissa Dell, Benjamin Jones and Benjamin Olken (2012) on the temperature-output relationship; and Laurence Wilse-Samson, The New Regional Economics (2026), chapters 13 and 15, for the Sahelian distress-urbanization account, the arable margin and the Lake Chad record.