10. Labor, Youth, and Migration
Learning Objectives
After reading this chapter, you should be able to:
- Read the identity’s middle term country by country, say what a falling employment-to-working-age ratio means during a working-age boom, and name the countries where the two happened together.
- Distinguish the adding-up series that makes the identity balance from the overlays that carry the jobs argument, and explain why the first will always understate the problem the second is about.
- State the survey coverage behind any claim about African employment: which countries have measured it recently, which have not, and what a continental average made from the two together is worth.
- Describe African migration at the right scale, with intra-African movement, the Gulf, the Mediterranean and internal rural-to-urban movement in their true proportions, and place each in the identity.
- Set out what employment is for under each of the book’s two worlds, the labour-abundant and the labour-redundant, and say which of this chapter’s findings changes meaning when the world changes.
Prior work: the urbanization and consumption-city material this chapter leans on for internal migration is developed at length in the companion volume, The New Regional Economics, chapters 13 and 14 (Wilse-Samson, 2026). This chapter cites it rather than repeating it.
Between 2024 and 2050 Africa’s population aged 15 to 64 rises from 867 million to 1,559 million, about 27 million additional people of working age every year for twenty-six years, or something over two million a month. Over the decade to 2024, across the 53 countries whose employment can be estimated at all, the share of that working-age population actually at work fell in 31 of them. Those two sentences are the chapter, and the rest is an argument about how much the second can be trusted, what would have to be true for it to stop being true, and what it would mean if the world stopped needing the answer.
This is the chapter the book’s thesis lives in. Chapter 1 said its middle term would be read here country by country; Chapter 4 said that if the growth-without-jobs claim is false, this is the chapter where it fails. Chapter 1 also left a question here that no amount of careful measurement can answer, which is what employment is for in a world that no longer needs it for output. The chapter takes the three tasks in that order: measure, qualify, then ask what the measurement is worth under a different set of assumptions about the century.
The middle term, country by country
Recall the arithmetic. GDP growth is approximately the growth of output per worker, plus the growth of the employment-to-working-age ratio, plus the growth of the working-age population, and all three are growth rates. Term one is demographics, term two the employment ratio, term three productivity. Chapter 1 quoted term one across all 54 countries and declined to quote the other two, on the grounds that a decomposition whose middle term arrives without its survey coverage is false precision. The coverage is now attached, and this section quotes all three.
The adding-up series for term two is the growth of a modelled employment count for everyone aged 15 and over, divided by the United Nations’ working-age population aged 15 to 64. It sits on 53 of the 54 cards; the Seychelles has no such series and therefore no decomposition at all. Across the 53 the median is minus 0.15 percent a year and the mean minus 0.16, which is to say the typical African country spent the decade to 2024 with a very slightly shrinking share of its working-age population in work.
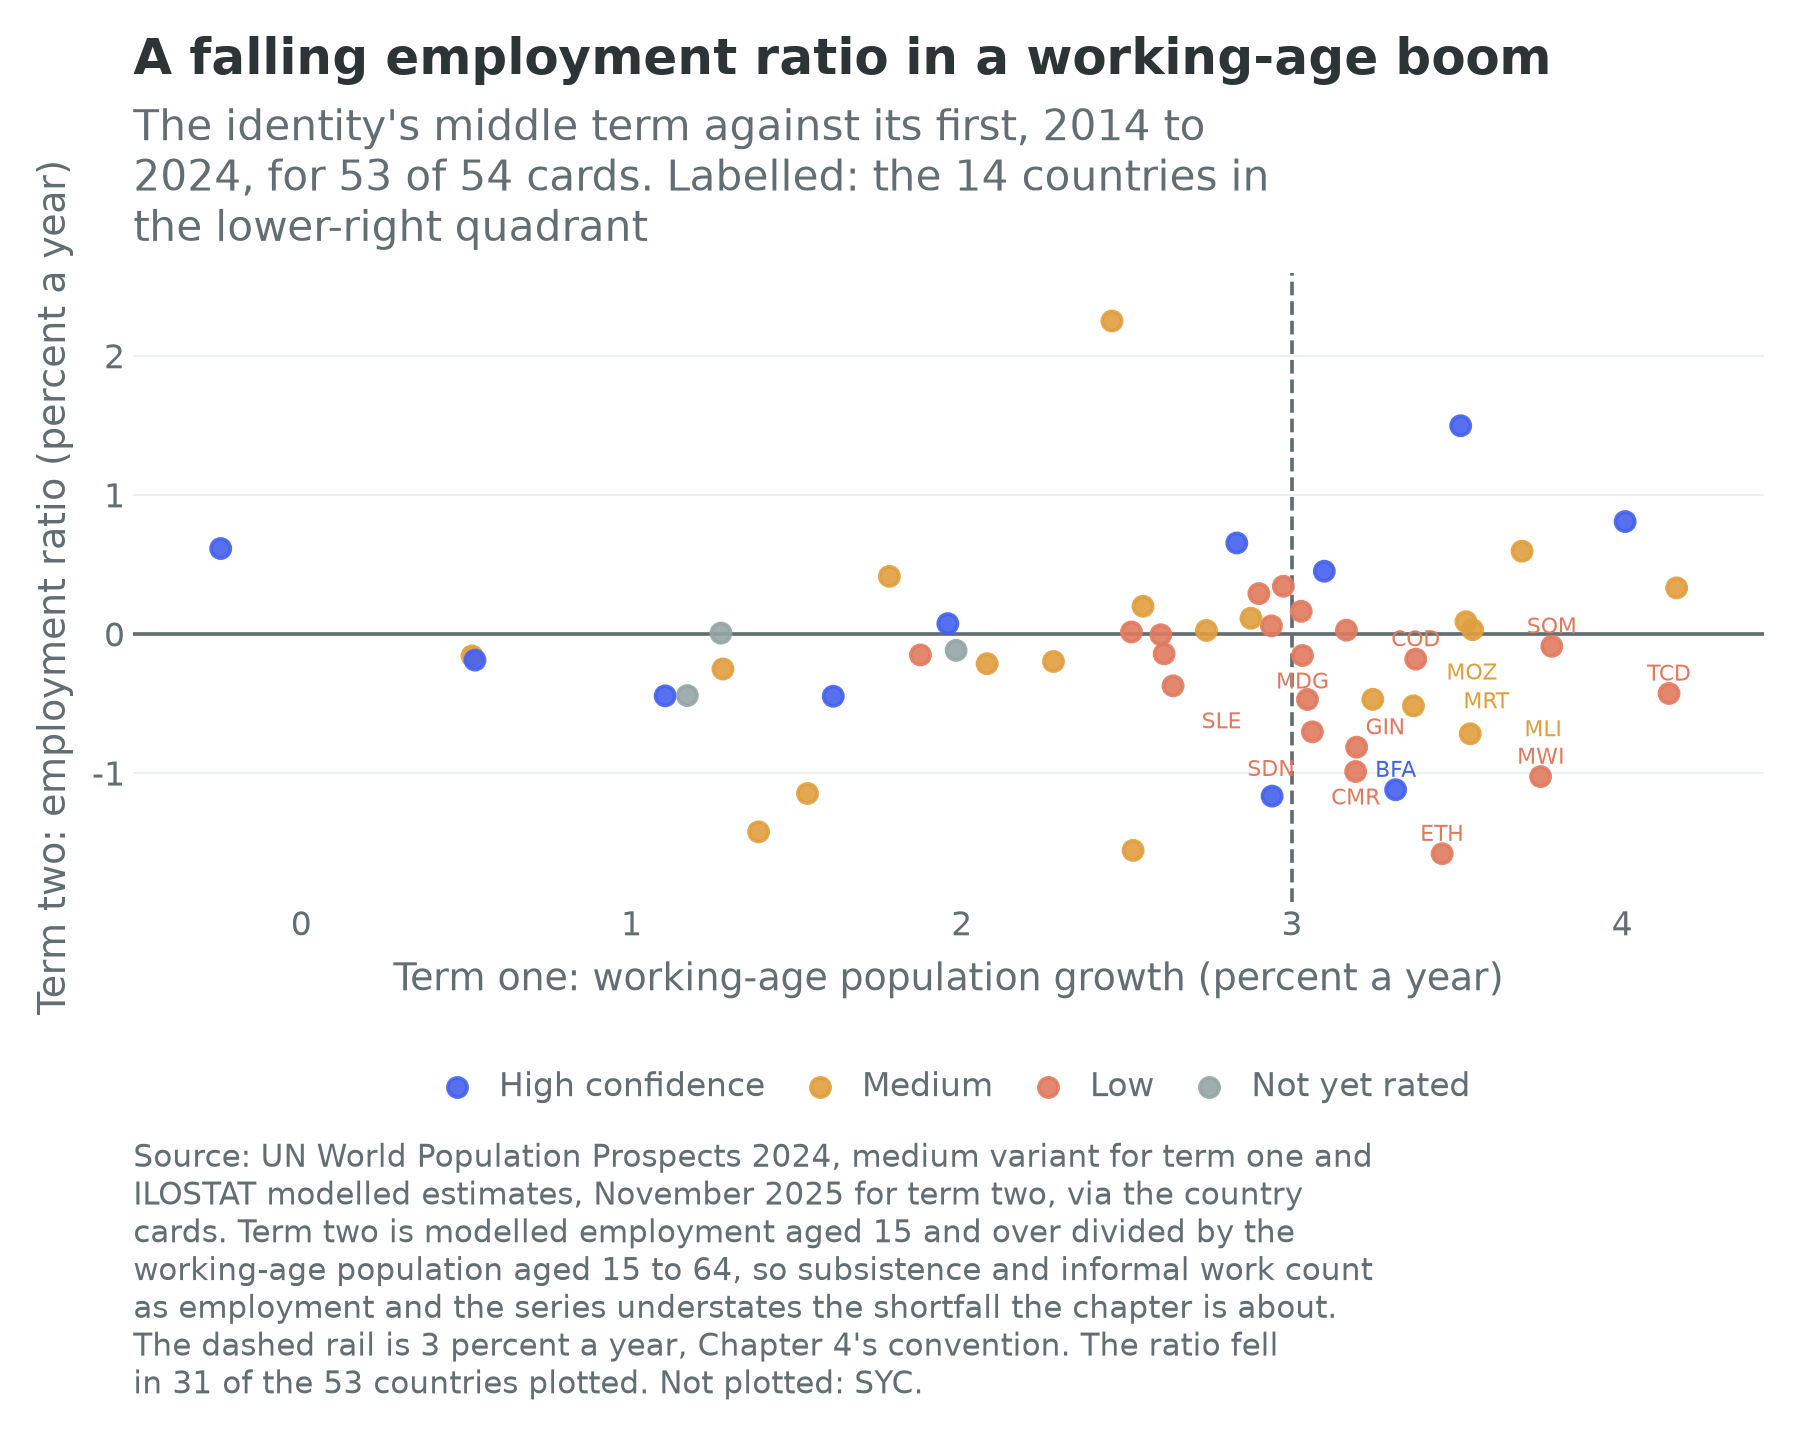
That is the first and most important fact about the middle term, and it is not the fact the phrase “growth without jobs” leads a reader to expect. The distribution is not catastrophic. It is inert. Thirty-five of the 53 sit within half a percentage point of zero in either direction, only two exceed 1 percent a year, Comoros at 2.25 and Senegal at 1.50, and only seven fall below minus 1: Ethiopia at minus 1.58, Ghana at minus 1.56, Eswatini at minus 1.42, Kenya at minus 1.17, Lesotho at minus 1.15, Burkina Faso at minus 1.12 and Malawi at minus 1.03.
Term two, in other words, has not been the disaster of African development. It has been the term that did nothing while the other two moved, and a term that does nothing while the working-age population grows at 3 percent a year is doing something after all: it is quietly declining to convert a demographic gift into a labour force.
The fourteen
Figure 10.1 sorts the continent into quadrants, and the one that matters is the lower right: countries whose working-age population grew faster than 3 percent a year while the share of it in work fell. There are fourteen of them, and they are Burkina Faso, Cameroon, Chad, the Democratic Republic of the Congo, Ethiopia, Guinea, Madagascar, Malawi, Mali, Mauritania, Mozambique, Sierra Leone, Somalia and Sudan.
Take the measure of that list before reading anything into it. The fourteen hold 525 million people, 34.7 percent of the continent’s population, produce 15.8 percent of its output, and hold 939 million by 2050 on the medium variant. A third of Africa, and more than a third of the Africa that is still growing, spent the last decade adding people of working age faster than it added work.
The list is also, and this is the uncomfortable part, mostly the list of places the book’s own thesis cares about most: the Democratic Republic of the Congo, the largest of the eight doublers; Ethiopia, the continent’s second most populous country and the case the recipe literature argues from; four Sahelian states whose political settlements Chapter 36 takes apart. It does not contain Nigeria, which is a separate problem and a worse one: Nigeria’s term two is a positive 0.29 percent a year while its output per worker fell at 1.94 percent, the configuration in which people work more and produce less.
The three-percent rail is a convention carried over from Chapter 4 and not a finding, and two of the sharpest declines on the continent sit just on the wrong side of it. Ghana’s employment ratio fell at 1.56 percent a year on a working-age population growing at 2.52, and Kenya’s at 1.17 on 2.94. Those are the East and West African hubs, with the best statistical systems in their neighbourhoods and the most confident growth stories, and their middle terms are among the worst on the continent. Move the rail down half a point and the story does not soften; it hardens.
What a falling employment ratio in a boom actually means
It is worth slowing down on the arithmetic, because the phrase is used loosely and its meaning is specific. The ratio falls when the number of people at work grows more slowly than the number of people of working age, and that requires nobody to lose a job. In a country whose working-age population is growing at 3.4 percent a year, as the Democratic Republic of the Congo’s was, employment can grow at 3.2 percent, adding well over a million workers a year, and the ratio still falls. The economy is creating work at a pace that would be a triumph anywhere in Europe, and it is still losing ground against its own demography.
That is the sense in which the demographic dividend is conditional rather than automatic, and why Chapter 2 distinguished a dividend from a bulge. A dividend requires the working-age share to rise and the additional workers to find productive employment; the first condition is being met across most of the continent, the second in about half of it, and missed in the half where the first is strongest.
Nor is a falling ratio the same thing as rising unemployment. Open unemployment is a luxury that requires somebody else’s income to live on, and where there is no unemployment insurance people do not become unemployed, they become underemployed. The ratio falls instead through routes that never appear in an unemployment rate: young people stay in school longer, which is good and which Chapter 20 counts; women leave the labour force or never enter it, which is sometimes a choice and often a constraint; and working-age adults sit in the category the statisticians call outside the labour force, which in practice means available for work of a kind that is not being offered.
The best and worst cases in the same country
Ethiopia is the sharpest single instance. Over the decade its output per worker grew at 5.91 percent a year, the highest term three of the 53, its working-age population at 3.46 percent, and its employment ratio fell at 1.58 percent, the largest decline on the continent; the three sum to an implied 7.79 percent against observed growth of 7.92. This is not a country that failed to grow. It is the fastest-growing large economy in Africa over the period, and it grew while employing a shrinking share of the people available to work, on a base where 15 percent of employment is waged and 77.7 percent informal.
Set beside it the country the identity flatters least. Chad’s working-age population grew at 4.14 percent a year, the second fastest on the continent, while its employment ratio fell at 0.43 percent and its output per worker at 1.31, giving observed growth of 2.47 percent on a population growing faster than that. Between Ethiopia and Chad lies the whole range of what a fast term one can be worth.
One reassurance before the qualifications. The identity is exact in levels and approximate in growth rates, and across the 52 countries where both sides can be computed, 50 agree within 1.5 percentage points; the exceptions are Sudan, whose employment series does not carry the collapse of 2023 and 2024, and Somalia. That checks the output series and the arithmetic. It cannot check the employment count, which cancels out of the sum, as Chapter 1 explains, and testing the count is what the overlays below are for.
Why the adding-up series understates the problem
Now the qualification, stated as plainly as it can be: the series just quoted understates the thing the chapter is about, and it understates it systematically rather than randomly. The reason is the definition of employment. On the international definition a person is employed if they did any work for pay or profit in a short reference period, and that is a low bar in an economy where most people work for themselves. A woman selling tomatoes at the roadside in Kaduna is employed, and so is a boy who spends three hours a week at his uncle’s kiosk, and so is a smallholder growing maize for the market. None of them is what a finance minister means by a job, and none of them has any of the things that make employment a channel from growth to household income: a wage that rises with productivity, a contract, a payslip that a bank will lend against, a payroll that a state can tax. On the international definition, almost everyone in the Sahel is employed, and Figure 10.1 says so.
Two further reasons to hold the numbers loosely, both stated rather than smoothed. The first is that the numerator counts everyone aged 15 and over while the denominator stops at 64. The mismatch inflates the level of the ratio, and its growth picks up changes in work by people past retirement age, which on a continent with almost no pension coverage is not a small category. This is the form in which the three terms add exactly, and the book prefers a series that adds with a stated flaw to one that does not add.
The second is that the employment series behind every one of these 53 numbers is a model rather than a count. Nobody knocked on a door in most of these countries in most of these years. The model is fitted to whatever national observations exist and interpolated where they do not, which means a country’s term two carries the authority of its last survey and no more. That is the subject of the next section, and the reason this chapter refuses to present its central overlay as a continental series.
Every one of these considerations pushes the same way, so the direction of the bias is knowable even when its size is not. When this chapter says the middle term did nothing, the honest gloss is that it did nothing on a definition generous enough that doing nothing is the flattering reading.
What a job is: the overlays
The jobs thesis is therefore carried by overlays, separate quantities that sit beside the identity rather than inside it, since adding them to the adding-up bar would break the arithmetic. There are four: the share of employment that is waged rather than own-account, the share outside agriculture, the informal share, and the share of young people not in employment, education or training.
The wage-employment share is the series the thesis is about, because it is the closest thing the international statistics have to the question everyone is actually asking. It is on 53 cards, and its range is wider than almost anything else in this book: from 8.5 percent in Chad to 82.7 percent in South Africa, with a median of 31.0, sixteen countries below 20 percent and twenty-five below 30.
Two things follow, and the second is the more interesting. The first is that wage employment is a minority activity in most of Africa: in half the countries on the continent, fewer than a third of people at work are paid a wage by somebody else. The second is that the wage share is almost purely a measure of income and almost not a measure of growth. Across the 53 it correlates with the logarithm of income per head at 0.75, very high for a cross-country relationship in this book, and with the decade’s growth of output per worker at minus 0.06, which is nothing. Rich African countries have wage economies and poor ones do not, and a decade of productivity growth told you nothing about which way the wage share moved. If the structural transformation were running, that second correlation would not be zero. It is the growth-without-jobs claim in its cleanest measurable form, and on this evidence it survives.
Thirty-four countries, and twenty asterisks
Here is the rule this chapter operates under. Thirty-four of the 54 countries have run a labour-force survey within five years. The other twenty have not, and two of them, the Central African Republic and South Sudan, have never run one at all. The wage-employment overlay is therefore presented as a 34-country series with the other 20 shown as modelled and visibly flagged, here and wherever else in this book it appears. That is a weaker claim than a continental average, and it is the claim the surveys support.
The twenty without a recent survey are Burundi, the Central African Republic, Chad, Côte d’Ivoire, the Democratic Republic of the Congo, Equatorial Guinea, Eritrea, The Gambia, Guinea, Liberia, Libya, Madagascar, Malawi, Namibia, the Republic of the Congo, São Tomé and Príncipe, Sierra Leone, Somalia, South Sudan and Sudan; the Democratic Republic of the Congo last surveyed in 2012, and Sudan and the Republic of the Congo in 2011.
The split is not neutral, and pretending it is would be the whole error this book is trying to avoid. The 34 surveyed countries hold 75.5 percent of the continent’s population and produce 85.6 percent of its output; the 20 hold 24.5 percent and 14.4 percent. So far so reassuring. But the median wage-employment share among the 34 is 35.0 percent against 25.9 among the 20, and the median informality rate 86.8 against 92.5. The countries nobody has surveyed recently are poorer, less waged and more informal than the countries somebody has, so any continental average of the overlay puts its least anchored numbers at exactly the end of the distribution where the book’s argument is sharpest. Eight of the fourteen countries in the lower-right quadrant of Figure 10.1 are in the unsurveyed twenty.
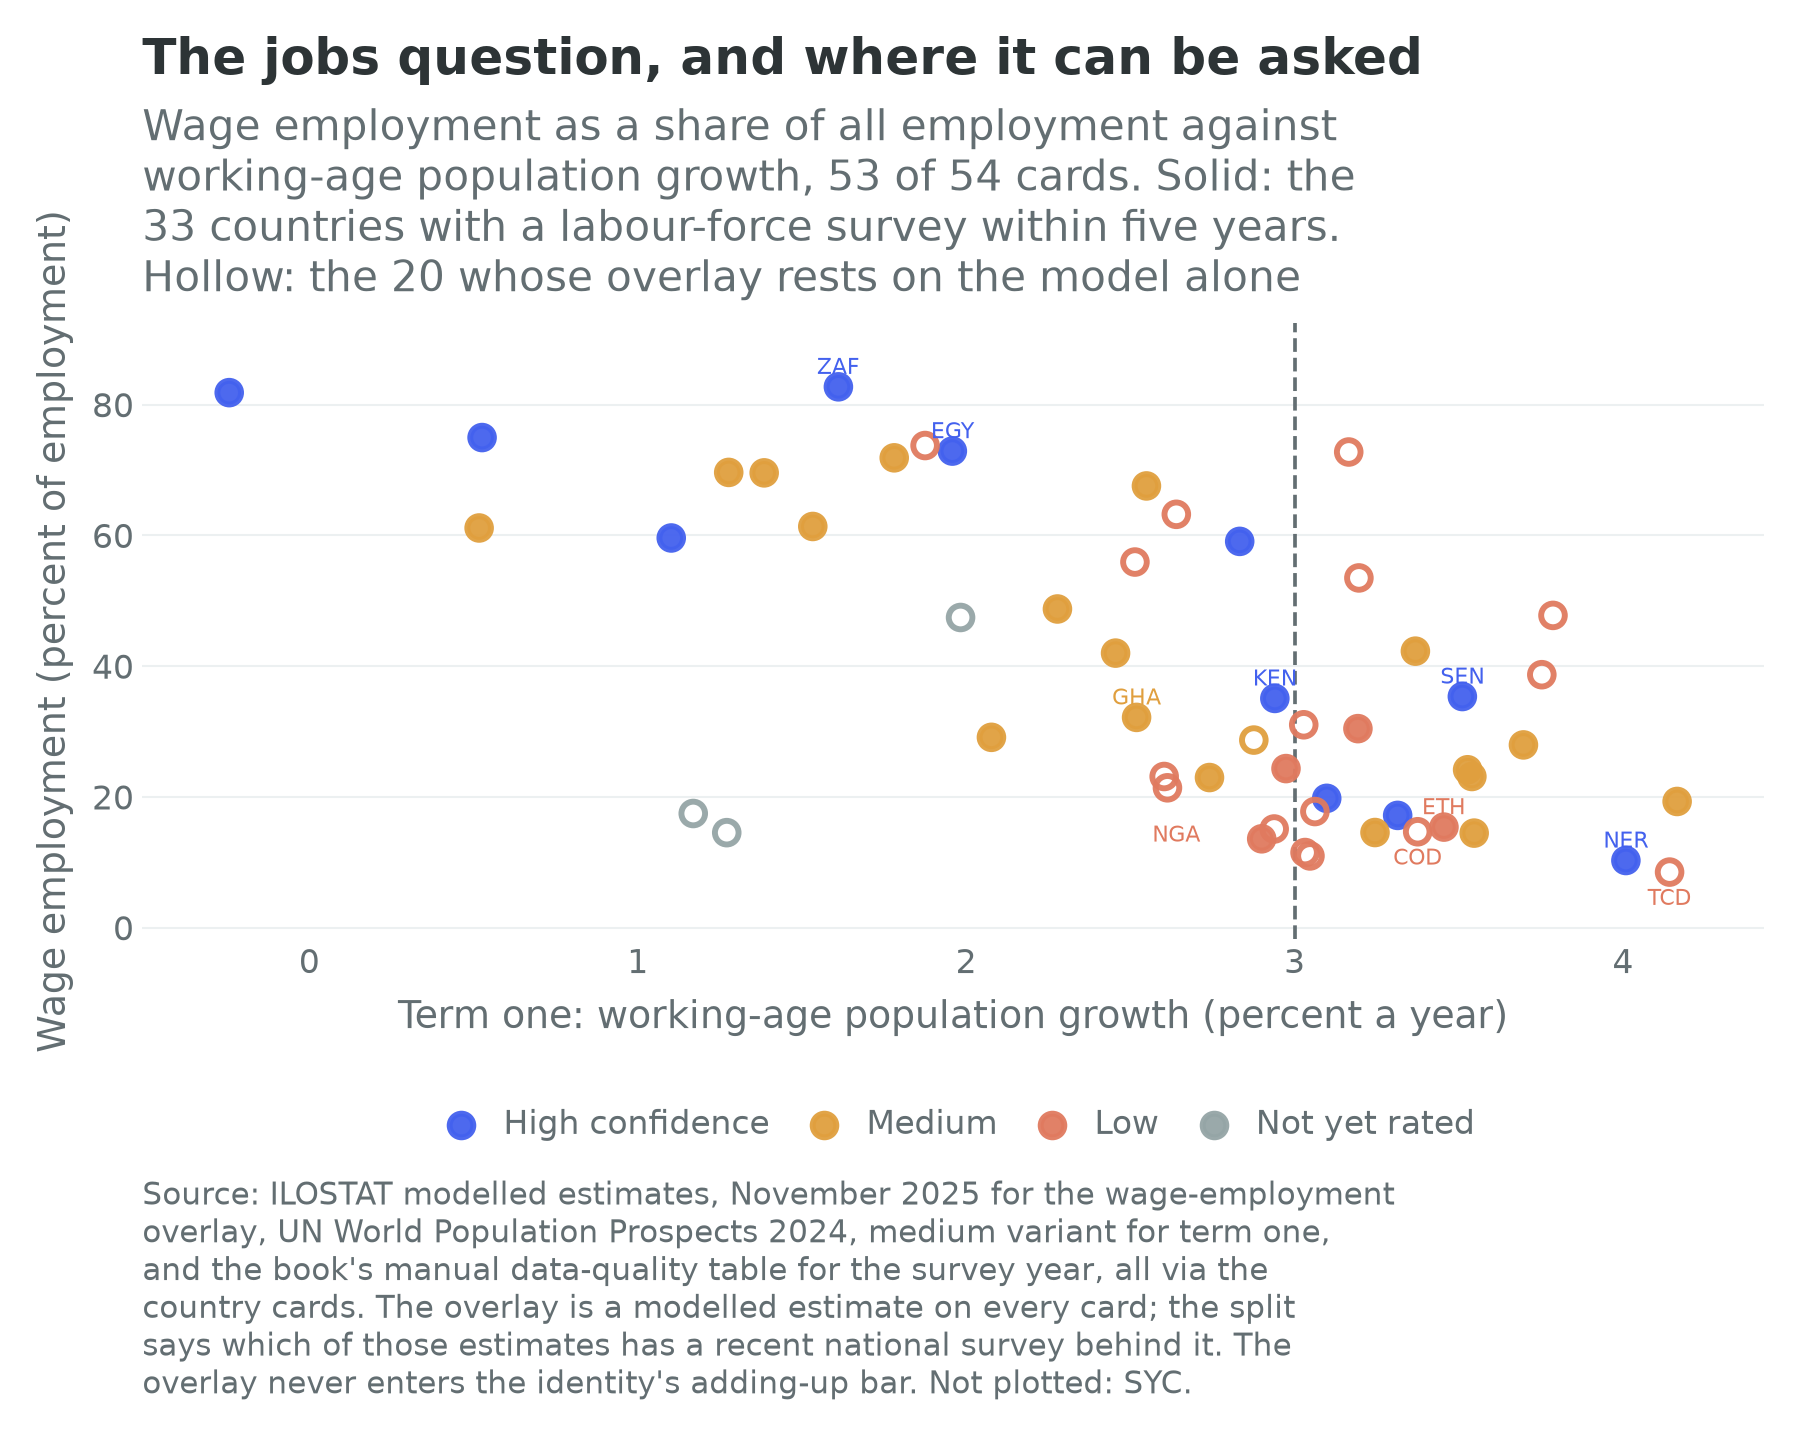
Figure 10.2 is the honest picture of the argument, and two patterns appear at once. The hollow markers are scattered across the whole vertical range, which is a warning rather than a reassurance: a modelled wage share of 73.7 percent for Libya or 63.2 for Namibia has nothing recent behind it, and neither does 8.5 for Chad. And the solid markers thin out sharply to the right of the three-percent rail: the countries where term one runs fastest are the countries where term two is least observable.
One further wrinkle. The statistical agency’s own record of when each country last measured these things is more generous than the survey table this book keeps, because its most recent non-modelled observation is sometimes a census or a household budget survey rather than a labour-force survey: on that record the surveyed 34 last measured youth idleness in a median year of 2024, and even the twenty without a recent survey were last observed in 2022. The two disagree in the direction of optimism, which is the direction statistical records usually disagree in, and the book uses the stricter.
Outside agriculture, and inside the informal economy
The non-agricultural employment share is the overlay that looks most like structural transformation and tells you least about it. The median across the 53 is 59.0 percent, running from 14.6 percent in Burundi to the upper seventies in North Africa. It says people have left the farm, not what they left it for, and the answer across most of the continent is petty trade and personal services.
Informality makes the point without ambiguity. It is on 45 cards, the median is 89.1 percent, and the top of the distribution is nearly complete: Niger at 98.5, Burundi at 98.0, Chad at 97.6 and the Democratic Republic of the Congo at 97.3, against Mauritius at 23.5 and South Africa at 34.8. It correlates with the logarithm of income per head at minus 0.75, the mirror image of the wage share, which is unsurprising since the two are nearly the same measurement from opposite ends.
The overlay that behaves differently is the one about women. The gap between men’s and women’s employment ratios has a median across the 53 of 11.8 percentage points and an extraordinary top: 51.7 points in Egypt, 49.2 in Algeria, 45.6 in Sudan and 44.7 in Morocco, while in Burundi women’s ratio is 2.6 points above men’s. North Africa’s middle term is, to a first approximation, a question about women’s participation, and a country with an Egyptian gender gap has an enormous unexploited term two sitting in plain view. That is one of the few genuinely encouraging arithmetic facts in this chapter, and Chapters 27 and 28 take it up where it lives.
Term three, and where the workers went
Chapter 6 owns the measurement of structural change and the dual-firm finding, and this chapter will not write Diao, Ellis, McMillan and Rodrik (2021) twice. What belongs here is the country-level split of term three, because it is the arithmetic of where migrating workers ended up. Output per worker rises within a sector, because firms in it get better, and between sectors, because workers move from lower-productivity activities to higher-productivity ones, which is the decomposition McMillan, Rodrik and Verduzco-Gallo (2014) made standard. The split is available for 21 African countries, and over the window it covers the between-sector component is positive in 17 of them and the within-sector component in 16, with medians of 0.69 and 1.2 percentage points a year.
Read carefully, that is a hopeful finding hedged by a small sample: reallocation added to productivity in four countries out of five where it can be measured, which is not what the structural-change pessimism of the 2010s predicted. The extremes are instructive in both directions. Burkina Faso’s between-sector component is 3.9 percentage points a year against a within-sector component of minus 0.67, an economy whose gains came almost entirely from moving people and whose employment ratio nevertheless fell at 1.12 percent a year. Ghana is the mirror image, with a within-sector component of 3.7 and a between-sector component of minus 0.71: its firms improved and the movement of workers between sectors subtracted from productivity. Kruse, Mensah, Sen and de Vries (2023) see the same ambiguity from the sector side, in manufacturing employment shares rising again across the developing world in the 2010s but concentrated in small and largely informal firms.
The point to carry forward is that the between-sector term is the migration term. Every point of it is a person who moved, from a farm to a town, from one town to a bigger one, or across a border.
Youth
Africa’s median ages run from 14.4 years in the Central African Republic to 37.4 in Mauritius, and its dependency ratios from 39.5 in Mauritius to 104.7 in the Central African Republic. Chapter 2 established what those numbers do to a country’s arithmetic; this section is about what they do to a cohort.
Ten to twelve million young Africans enter the labour market each year and the formal economy creates roughly three million jobs; the rest of the entrants land in low-productivity informal work (AfDB, 2016). That pair of numbers, put this way in the African Development Bank’s youth-jobs strategy of 2016, is repeated so often that it has acquired the status of a measurement, and it is not one: the entrant count is a projection off the population data and the formal-jobs count rests on establishment records with thin coverage. It is an order of magnitude, and as an order of magnitude it is almost certainly right.
The overlay that gets closest to it is the share of young people not in employment, education or training. It is on 48 cards with a median of 24.4 percent, and 19 countries are above 30 percent and six above 40, led by Djibouti and Somalia at 51.0 percent and Sudan at 46.5.
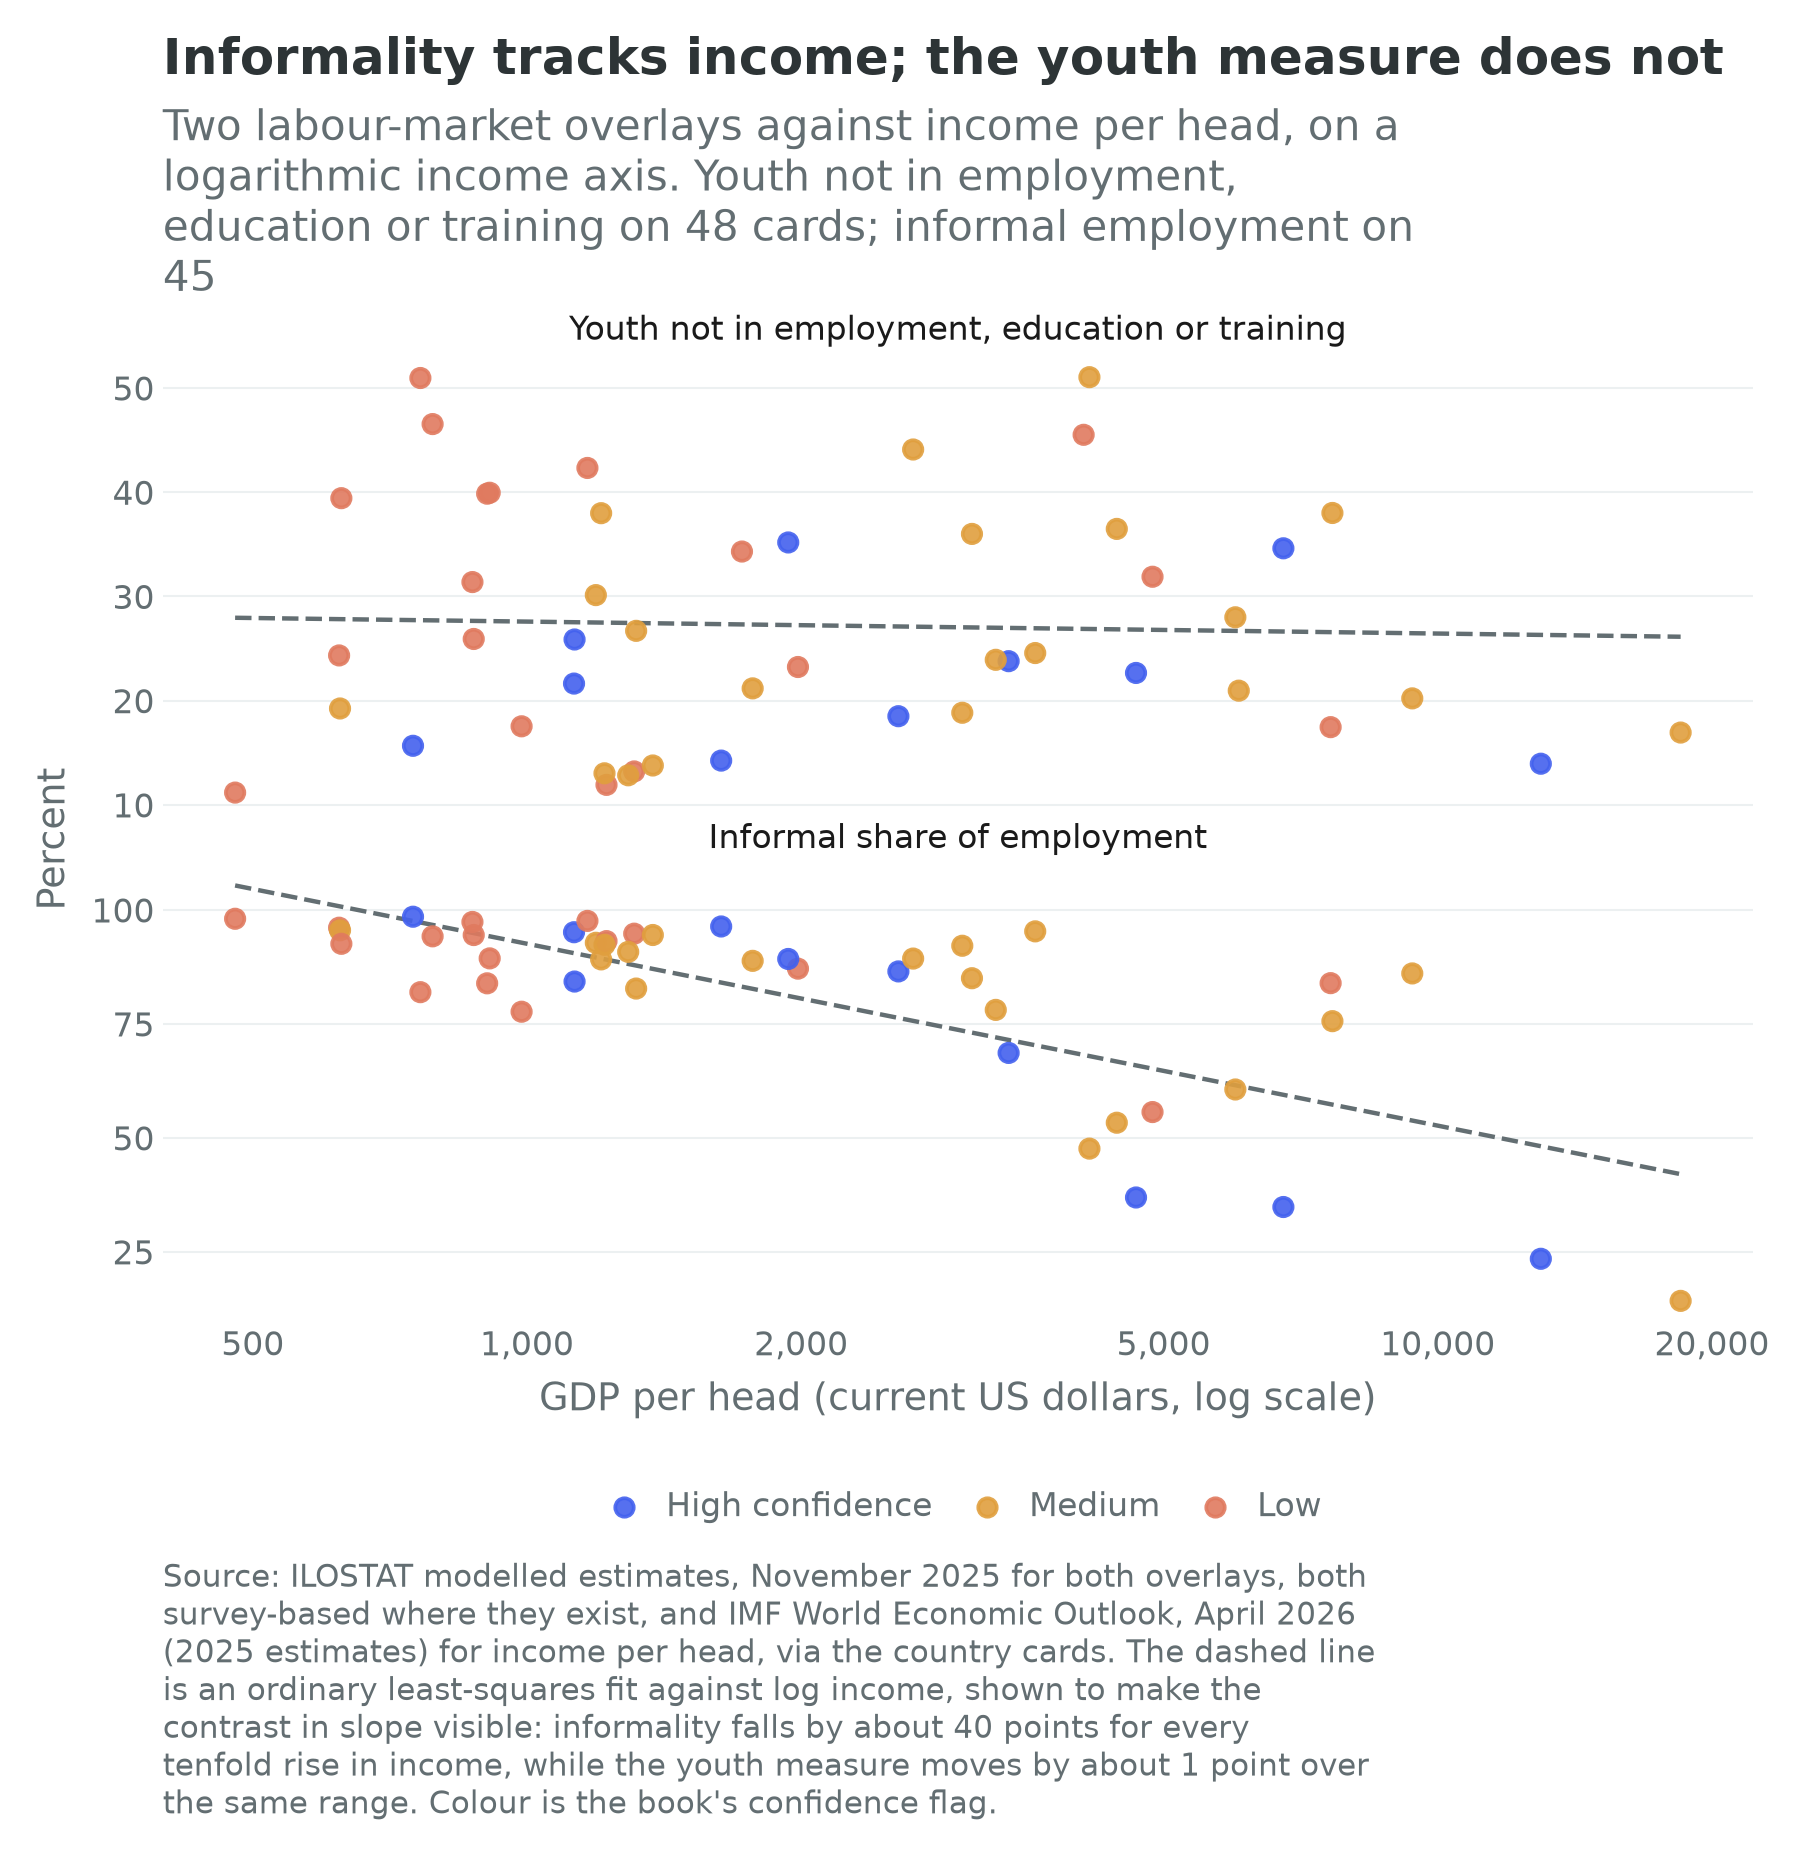
Figure 10.3 is the finding worth taking away. Informality is an income phenomenon: it falls by something like forty points for every tenfold rise in income per head, and a country that gets richer gets more formal almost mechanically. Youth idleness is not. Its correlation with the logarithm of income across the 48 is minus 0.04, which is none at all. Some of the poorest countries have the lowest measured youth idleness, because in a subsistence economy a young person without a job is not idle, they are on the farm: Burundi records 11.2 percent, Nigeria 11.9 and Tanzania 12.8.
That is not good news about Burundi and Nigeria, and it would be a serious misreading to take it as such. It is the same definitional generosity that flattens the middle term, arriving one measurement further down: the overlay says where young people are absent from both work and school, not whether the work they are present in is worth anything. Filmer and Fox (2014) put the point in the form that has held up. The African youth employment problem is not mainly one of joblessness but one of earnings, and the policy question is not how to occupy young people but how to raise the productivity of the work they already do.
What the experiments say
Four questions the randomized evidence can actually answer
The recurring evidence boxes in this book use experiments that answer systems questions rather than programme questions. Four bear on this chapter, each worth stating as the question it settled.
Blattman and Dercon (2018) asked what an industrial job is worth to the person who takes it. They randomized offers of factory work at Ethiopian firms against a cash grant and against a control, a design possible only because the jobs were scarce enough to ration. The question was whether entry-level manufacturing employment, the rung the East Asian recipe stands on, raises income and welfare for the worker who climbs onto it. The answer was not the one industrial policy assumes, and Chapter 15 carries it into the manufacturing argument.
Hardy and McCasland (2023) asked whether small African firms are held back by the price of labour or by their inability to find it. They offered small Ghanaian firms an apprentice at no cost, on the reasoning that a firm constrained by wages should gain little beyond the subsidy while a firm constrained by matching should gain a great deal. That is squarely a term-two question, and its answer determines whether the missing employment in Figure 10.1 is a productivity problem or a coordination problem.
Egger, Haushofer, Miguel, Niehaus and Walker (2022) asked what happens to a local economy, and not just to a recipient, when income arrives from outside it. They delivered transfers of about a thousand dollars to more than 10,500 households across 653 randomized villages in rural Kenya, a fiscal shock of over 15 percent of local output, and measured non-recipients and firms as well as recipients. The question is the one every remittance and every social-protection argument in this book depends on: whether the multiplier on transferred income in a labour-abundant, credit-constrained economy is large or small.
Baseler (2023) asked why people who would earn more in a city stay in a village. Two field experiments in Kenya tested whether the gap is explained by beliefs rather than by costs, by giving rural households accurate information about urban earnings and watching whether they moved. The mechanism the paper identifies, that migrants hide income from the relatives who would claim it and that their families therefore underestimate what migration pays, is a finding about the family as an institution as much as about migration. It is the African counterpart to Bryan, Chowdhury and Mobarak (2014), whose Bangladeshi seasonal-migration experiment remains the canonical demonstration that a very small subsidy can move a great many people; this book cites both because that result has never been replicated at scale on this continent.
Each takes a constraint the aggregate data can only name and turns it into something a state could act on. None of them, alone or together, moves a national employment ratio. That gap between what can be demonstrated and what would have to be delivered is the honest shape of the evidence base under this chapter.
Migration
Almost everything the general reader believes about African migration is wrong about its direction, and the error is not small. By the middle of 2024 about 45.8 million people born in Africa were living outside the country of their birth, and about 25 million of them, well over half, were living in another African country (UN DESA, 2025a). Africa itself hosted 29.2 million international migrants, of whom 86 percent had come from within the region. Of the African-born living outside the continent, roughly 11 million were in Europe, nearly 7 million in Asia, which is very largely the Gulf, and about 2.7 million in North America. More Africans have moved to another African country than to Europe by better than two to one, a fact the second edition of the continent’s own migration report puts at the front of its argument (IOM and African Union Commission, 2024).
Intra-African migration is also the part that is growing: up about 17 percent since 2020 and about 44 percent since 2010 (UN DESA, 2025a). Within the West African community most of the movement runs to Côte d’Ivoire and Nigeria; within the Southern African one it runs to South Africa. The two largest destinations on the continent are, in other words, two of the countries whose national arithmetic this book worries about most.
Now the scale correction that should stay with a reader. Twenty-five million people living in another African country, against a continental population of 1.513 billion, is about 1.7 percent. By the standards of a continent with a common trade area and eight regional communities, Africa is remarkably immobile, and the free-movement protocol the African Union adopted in 2018 requires fifteen ratifications to come into force and has four, all of them deposited by 2019 (African Union Commission, 2019; Deutsche Welle, 2025). The regional communities have done better, and the West African protocol is the one genuine free-movement regime on the continent, but the pattern is legislation running well ahead of implementation, which is the diagnosis the companion volume reaches for goods (Wilse-Samson, 2026).
The routes that get reported
Set the Mediterranean beside those numbers and the proportions become clear. About 67,000 people arrived in Europe on the central Mediterranean route in 2024, a fall of 59 percent on the year before, and 2,452 died in the Mediterranean over the same twelve months, part of a worldwide total of 8,938 migrant deaths that made 2024 the deadliest year on record (Frontex, 2025; IOM, 2025). Those crossings, which occupy a large share of the political attention Europe gives to Africa, are roughly a quarter of one percent of the number of Africans who have moved to another African country. The deaths are a moral emergency and the flow is a rounding error, and both statements are true at once.
The Gulf is the larger and quieter external corridor, and the one that is growing. Sub-Saharan nationals numbered about 715,000 in Saudi Arabia’s 2022 census, 5.3 percent of the foreign population there, and by 2025 something over 300,000 Kenyans were working in Saudi Arabia, Qatar and the United Arab Emirates (Gulf Labour Markets and Migration, 2024). The corridor runs through domestic work and construction, it is heavily female at the Ethiopian and Kenyan end, and it operates under sponsorship arrangements that give the worker very little standing. In identity terms it is an export of labour services by countries whose own term two is falling, which is a rational response to Figure 10.1 and a poor advertisement for the economies producing it.
What migration is worth
Remittances are the measurable return. Sub-Saharan Africa received about $54 billion in 2023, roughly flat on the year, with growth of about 1.5 percent projected for 2024, and across low- and middle-income countries remittances now exceed foreign direct investment (KNOMAD and World Bank, 2024). Nigeria alone received $20.93 billion in 2024 and Egypt $22.7 billion, which made Egypt the seventh-largest recipient in the world. Kenya received about $5 billion in 2024, equal to 3.7 percent of the output its card records.
Two observations. These are the largest, most stable and least conditional external flows the continent receives, and they arrive at households rather than at ministries, which is why Chapter 21’s balance-sheet lens treats them as a different kind of item from a Eurobond. They are also a claim on somebody else’s labour market: a remittance is the price of an African worker’s time paid by a European or Gulf employer, and the flow is contingent on those employers continuing to want the time. Hold that thought for the last section.
From a remittance to a claim
The African Union calls the diaspora its sixth region. That is a political fact, and it is not yet a capital-markets one. A remittance is a household transfer. A diaspora bond, a dedicated fund or a United States-domiciled feeder would be a security: a prospectus, a paying agent, a covenant, and a person who can sue. The two are adjacent on a diagram and different in law.
The African product list is short. Nigeria’s 2017 diaspora issue raised about $300 million, listed in London and registered with the United States securities regulator, which is why it cleared (Debt Management Office of Nigeria, 2017). Ethiopia’s earlier issues faced weak uptake, and a United States enforcement action over the marketing of those securities to American persons is the cautionary case (Securities and Exchange Commission, 2016). The African Diaspora Finance Corporation, sketched in an African Union framework as a vehicle for bonds, funds and a remittance-match endowment, remains a proposal rather than an operating firm (African Union, 2019). Rhetoric is well ahead of the shelf.
The serious comparators sit outside Africa, and they are comparators rather than models anyone on the continent has adopted. Israel has run a diaspora-bond programme for decades; India has from time to time raised from non-resident Indians through dedicated issues (Ketkar and Ratha, 2010). China’s overseas commercial networks are a different instrument, closer to the trading diaspora Chapter 33 already describes than to a sovereign bond. Field notes from a September 2026 roundtable in New York asked the same question the panel could not close: what does a diaspora person actually write a cheque into, and does an America-based person require a United States institution to handle the compliance? Chapter 19 and Chapter 33 take the infrastructure and American halves. The answer this chapter can stand on is narrower. The remittance bar is large and real. The structured claim is still, with one documented Nigerian exception, mostly a wish.
Internal migration, which is the big one
The migration that matters most for the identity is the one that crosses no border at all. Every point of a positive between-sector term is a person who moved from lower-productivity work to higher-productivity work, and in Africa that overwhelmingly means from a farm to a town.
Three things are worth saying about it. The first is that the movement is real and large: the non-agricultural employment share now has a median of 59.0 percent across the 53 countries with the overlay, unimaginable in 1990. The second is that where people arrive matters more than that they arrive, which is the consumption-city argument: a city that concentrates people around the distribution of a resource rent delivers neither the productivity gain nor the employment urbanization is supposed to deliver, and the companion volume works the case through for Lagos, Luanda and Libreville and against Nairobi (Wilse-Samson, 2026). Chapter 22 carries the land and housing half of it.
The third is that the flow is not simply a response to a wage gap, and Baseler (2023) is the reason to say so. If rural households underestimate what urban work pays, because the relatives who have gone hide their earnings from the claims of the family, then the urban-rural wage gap is partly a puzzle about information inside the household rather than about barriers to movement. That is a different policy problem, and a cheaper one.
One last flow, which Chapter 36 owns, is displacement. Climate-driven internal movement in Sub-Saharan Africa is projected in the tens of millions by mid-century under plausible scenarios (Clement et al., 2021), and conflict displacement in the Sahel, the Horn and the eastern Congo already runs into the millions. Displaced people move to survive rather than to earn, and they show up in the identity as population without employment: the same arithmetic with the sign of the welfare term reversed.
What employment is for
Chapter 1 sent one question here that no amount of survey coverage will answer. The identity’s assumption is that the marginal worker still matters, and everything above measures how well African economies convert workers into output under it. What if the assumption fails?
Employment in the labour-abundant world
In the world the book has been proceeding in, employment does three jobs at once, and they are worth separating because they come apart in the other world.
The first is mechanical. Employment is the channel through which output becomes household income, and a person with a wage has a claim on the economy’s product that requires no political decision, no transfer programme and no fiscal capacity. That is what makes the middle term the one that converts growth into welfare, and why a country can post Ethiopia’s term three and still have a household sector that does not feel it.
The second is developmental. Employment is the mechanism by which productivity is acquired: a worker learns the firm’s routines, the firm learns from having to pay her, and the accumulation of those two learnings is most of what the East Asian sequence consisted of. Blattman and Dercon (2018) and Hardy and McCasland (2023) are measurements of that mechanism at the level of one worker and one firm.
The third is political, and it is the one the book’s own vocabulary is built for. A development bargain, as Dercon (2022) frames it, is an elite’s decision to bet on growth rather than on dividing the existing pot, and employment is central to it because it is the least discretionary way of distributing the proceeds: an elite that grows the economy through wage employment cannot easily choose who benefits, and an elite that grows it through resource rents can choose precisely. Khan (2010) makes the same point from the other side, since institutions hold only where they are compatible with the distribution of organizational power and a broad wage-earning class is itself a redistribution of that power, while the deals framework of Pritchett, Sen and Werker (2018) supplies the dynamics. Employment, in all three vocabularies, is what makes a growth bargain self-enforcing.
That is why the fourteen countries of Figure 10.1 are a political finding as well as an economic one. A state whose economy grows without its employment ratio rising is a state whose growth can be captured, and the coups belt of Chapter 4’s fifth objection runs through six of them.
Employment in the labour-redundant world
Now suppose the frontier of production over the next few decades becomes a stock of machines that reason and machines that move, so that output is a function of installed compute, energy and capital, and labour enters as a complement at best (Acemoglu and Restrepo, 2019). Nobody knows how far or how fast that world arrives, and this book does not choose between the two; it says what its own evidence looks like under each. Under that assumption, all three functions of employment change character.
The mechanical function breaks first. If output no longer requires labour, wages stop being the channel from production to income, and income becomes whatever a society decides to transfer. Korinek and Stiglitz (2021) put the consequence bluntly: if intelligence becomes capital, income per head depends on who owns the capital and on the terms of trade for whatever else you have. The employment ratio then stops being a thing to measure and becomes a thing to choose, and the growth-without-jobs critique this chapter has spent twenty pages testing on Africa becomes a description of everywhere. It stops being Africa’s failure and becomes the global equilibrium.
The developmental function goes with it. If productivity at the frontier is bought rather than built, the apprenticeship, the factory job and the firm that learns from paying a worker stop being the route by which a country acquires capability, and whether a country can build productivity becomes a question about the terms on which it can rent it.
The political function is the one that becomes most dangerous. An elite that does not need its population in order to produce has no economic reason to strike a growth bargain with it. Every account of the resource curse in this book, and Chapter 13’s in particular, describes exactly that configuration in one sector; the labour-redundant world generalizes it to the whole economy. The distributional question would not be technical. It would be the central political question of the century, and it would arrive in the countries with the weakest fiscal instruments first.
What this chapter’s evidence looks like under the second assumption
Take the findings above one at a time and change the assumption.
Africa’s exposure to the first wave is genuinely low, and the reason is not comfortable. On the ILO’s earlier global index, occupations with automation potential accounted for about 0.4 percent of employment in low-income countries against 5.5 percent in high-income ones (Gmyrek, Berg and Bescond, 2023). The 2025 refined index puts about one in four workers worldwide in an occupation with some exposure, 3.3 percent of global employment in the highest exposure band, and a range across income groups running from about 11 percent of employment in low-income countries to about 34 percent in high-income ones, with clerical work most exposed and women’s employment more exposed than men’s (ILO, 2025). A continent whose median informality rate is 89.1 percent is, on these numbers, the least exposed place on earth. Informality protects, and the protection consists of being too poor to be worth automating. It is a decade of shelter and then a trap.
The services rungs go first, and they are the rungs Africa has most recently climbed. The business-process model that Nairobi, Accra and Lagos built over the last decade, in which a graduate answers a call or labels an image for a firm on another continent, is precisely the work that a machine which answers calls and labels images does first. Those jobs are a small share of African employment and a large share of the formal, tradable, graduate-absorbing employment the wage-employment overlay is trying to count, and Figure 10.2’s 34-country series is the first place a reader would see it happen.
The fourteen countries change meaning entirely. In the labour-abundant world they are a policy failure with a known remedy: a cohort arriving faster than the jobs, in states that could do more. In the labour-redundant world they are 525 million people, rising to 939 million, holding the asset the century has stopped paying for. Nothing in their demography changes; the sign of the coefficient the world puts on it changes.
Social protection stops being a residual and becomes the system. Chapter 23 prices what a transfer floor would cost, and the fiscal arithmetic here is what makes it hard: a continent whose median informality rate is 89.1 percent has almost no payroll to tax, so the base for any serious transfer system would have to be rents, which means minerals, energy and land, which means the balance-sheet questions of Chapters 13, 14 and 21 rather than the labour questions of this one. Egger, Haushofer, Miguel, Niehaus and Walker (2022) matter more in that world than in this one, because the size of the local multiplier is the difference between a transfer system that sustains an economy and one that merely sustains consumption.
And migration stops pulling. Every external migration flow above rests on a receiving economy that wants labour. A Europe with a shrinking working-age population and a Gulf with a construction pipeline are the demand side of a corridor that carries about 21 million Africans and returns tens of billions of dollars a year to African households. A Europe and a Gulf that no longer need labour do not merely close the corridor; they remove the argument that has been the best case for opening it, which is demographic complementarity. The remittance line, the most reliable external flow the continent has, would be the first casualty of the second world, and it would go before anyone in Africa had automated anything.
What follows
The honest position is the one Chapter 1 took. The identity holds in both worlds. In the first, this chapter’s fourteen countries are a problem with a solution and the survey coverage it has spent so long qualifying is the binding constraint on knowing whether policy works. In the second, the same fourteen are a distribution problem, and coverage matters less because the question has moved from how many people are employed to how the product is shared among people who are not.
A rule for holding both at once: everything here about the level of employment is fragile to the second world, and everything about its composition survives. The wage share, the informality rate, the gender gap and the youth measure are all statements about who has a claim on the product, and those questions get harder, not easier, if the machines arrive.
Connections to Other Chapters
- Chapter 1 (Africa in Numbers) states the identity and the data-quality layer this chapter operates under, and poses the question the last section answers; Chapter 2 (The Demographic Century) owns term one and hands this chapter the entering cohort.
- Chapter 4 (The Case and the Counter-Case) stages the growth-without-jobs argument that this chapter tests, and its sixth objection is the one the last section takes up.
- Chapter 5 (States, Political Settlements, and Development Bargains) supplies the vocabulary in which employment is a political and not only an economic quantity, and Chapter 6 (The Informal Economy) owns the dual-firm structure the wage-employment overlay is a symptom of.
- Chapter 15 (Manufacturing and the Auto Industry) carries the factory-job evidence into the industrial argument, and Chapter 20 (Human Capital) the education side of the youth measure.
- Chapter 21 (Capital and Sovereign Debt) places remittances on the balance sheet, Chapter 22 (Land) carries the urban destination of internal migration, and Chapter 23 (Inequality, Social Protection, and Health) prices the transfer systems the last section says become the system rather than the residual. Chapter 19 takes the next step: a remittance is not equity in a PIDA project. The UNGA Week 2026 field notes are the primary record behind that question.
- Chapters 24 to 31 (the growth poles) report the same terms and overlays pole by pole, and Chapters 35 and 36 (Scenarios; What Could Go Wrong) carry the labour-redundant world as a scenario axis, with the displacement and Sahel material this chapter points at.
Discussion Questions
A falling employment-to-working-age ratio during a working-age boom is compatible with employment growing quickly in absolute terms. Work the arithmetic through for a country whose working-age population grows at 3.4 percent a year and whose employment grows at 3.2 percent. Then say which of the two numbers a finance minister should put in a speech, which one a labour ministry should be judged on, and whether your answer changes if the country is Ethiopia rather than the Democratic Republic of the Congo.
The wage-employment overlay correlates with income per head at 0.75 and with the decade’s growth of output per worker at about zero. One reading is that the overlay is a proxy for income and tells us nothing new. Another is that the zero correlation is itself the finding, because the productivity gains of the decade did not arrive through wage employment. Argue for one reading, then say what a decade of data would have to look like for the other to win.
Eight of the fourteen countries with a falling employment ratio and a fast-growing working-age population have not run a labour-force survey in five years. A colleague proposes to spend a fixed budget either on running surveys in those eight or on an employment programme in one of them. Make the strongest case for each, then say what your answer implies about whether the constraint on African labour policy is knowledge or capacity.
Try It
Open the three cards side by side: Ethiopia, Ghana and Niger. Ethiopia has the continent’s fastest output-per-worker growth and its sharpest fall in the employment ratio; Ghana has a rising output per worker and the second-sharpest fall; Niger has a rising employment ratio and almost no productivity growth. For each, read the three identity terms, then the wage-employment share, the informality rate and the last labour-force survey year, and switch on the confidence toggle on the Growth Pole Map. Write one paragraph on a single question: which of the three decompositions would you put in front of a finance minister without a caveat, and what exactly is the caveat you would attach to the other two?
Data Exercise
Download all fifty-four cards from the country cards page on this site, as cards.csv or as cards.json if you want the release each number came from travelling beside it. Build a table with seven columns: identity.working_age_pop_growth, identity.employment_to_wa_growth, identity.output_per_worker_growth, overlays.wage_employment_share, scale.informal_employment_share, data_quality.last_lfs_year and scale.population. Then answer four questions. First, reproduce the chapter’s fourteen countries by selecting on a negative middle term and a first term above 3 percent, and check the population and output shares reported above. Second, split the 54 into those with a labour-force survey in 2021 or later and those without, compare the median wage-employment share, informality rate and income per head across the two groups, and say in two sentences what a continental average of the wage share is worth. Third, compute the correlation between the wage-employment share and the logarithm of income per head, and between the wage share and output-per-worker growth, and explain why the two answers differ so much. Fourth, recompute all of the above after dropping every country whose last labour-force survey predates 2021, and write two sentences on whether the chapter’s central claim survives. Note which fields are null rather than zero, and never impute a null as a zero.
Data Sources and Further Reading
Key data sources
- ILOSTAT modelled estimates (November 2025): the identity’s second and third terms on 53 of the 54 cards, and the wage-employment, non-agricultural, youth and informality overlays. Term two is modelled employment aged 15 and over divided by the UN’s working-age population aged 15 to 64, a mismatch of age bands the book states rather than smooths. The overlays never enter the adding-up bar.
- UN World Population Prospects 2024 (population.un.org): term one, the working-age totals, median ages and dependency ratios, medium variant, ages 15 to 64 unless stated. IMF World Economic Outlook, April 2026 for observed growth and income per head, 2025 estimates.
- GGDC Economic Transformation Database: the within-sector and between-sector split of term three, on the 21 African countries it covers. National labour-force surveys, whose vintages are the basis of this chapter’s 34-country rule, are recorded on every card.
- UN DESA, International Migrant Stock 2024 for the migrant stocks, origins and destinations; World Bank and KNOMAD, Migration and Development Brief for remittances; IOM Missing Migrants Project and Frontex for Mediterranean crossings and deaths; Gulf Labour Markets, Migration and Population for the Gulf corridor.
- Debt Management Office of Nigeria for the 2017 diaspora issue; the US Securities and Exchange Commission for the Ethiopian enforcement action; African Union (2019) for the ADFC framework, which is a proposal; Ketkar and Ratha (2010) for the Israel and India comparators.
Further reading
- Ken Ochieng’ Opalo, for the argument that another year of growth will still leave many countries short of reliable jobs (Opalo, 2026a), and Deon Filmer and Louise Fox, Youth Employment in Sub-Saharan Africa (2014), still the best statement of the earnings-rather-than-joblessness diagnosis.
- Xinshen Diao, Mia Ellis, Margaret McMillan and Dani Rodrik, “Africa’s Manufacturing Puzzle” (2021), for the dual-firm structure underneath the overlays, with Hagen Kruse, Emmanuel Mensah, Kunal Sen and Gaaitzen de Vries (2023) for the qualifier that cuts both ways.
- Marie-Laurence Flahaux and Hein de Haas, “African Migration: Trends, Patterns, Drivers” (2016), for why the standard account of African migration to Europe is wrong about direction and cause, and Travis Baseler (2023) for the household economics of internal migration.
- Paweł Gmyrek, Janine Berg and David Bescond, ILO Working Paper 96 (2023), and the 2025 refined index, for the exposure estimates the last section rests on, with Anton Korinek and Joseph E. Stiglitz (2021) for what happens to a development strategy when intelligence becomes capital.