35. Scenarios to 2050 and 2100
Take the three terms of the book’s identity as the last decade actually delivered them, compound them forward on the population the projections already contain, and Africa arrives at 2050 with an income per head of about $2,593 against about $2,072 today. That is a quarter more, over a quarter of a century, on a continent that adds 951 million people in the same period. Nothing in that path is a catastrophe. There is no default in it, no famine, no war; the aggregate economy roughly doubles, and every finance minister on the continent could stand up each year and say, truthfully, that the economy grew. It is the most likely single thing that happens, and it is not the growth century.
Learning Objectives
After reading this chapter, you should be able to:
- Distinguish a scenario from a forecast and both from an accounting projection, and say precisely which of the three this chapter’s central exhibit is.
- Build the identity forward for any country from its card: take term one from the population projections, choose paths for terms two and three, compound, and divide by the projected population.
- State the book’s scenario axis, the labour-abundant and labour-redundant worlds, in terms of what each does to the three terms, and place the compute-inputs case as the upside branch of the second rather than as a third world.
- Treat fertility, urbanization, commodity prices, climate and the political settlement as modifiers of that axis rather than as separate scenarios, and say which of them moves which term.
- Name the observables that would distinguish the two worlds before 2035, say where each is measured, and explain why the record of African growth forecasting argues for watching series rather than revising projections.
Prior work: the long-run climate-migration scenarios this chapter treats as a modifier are developed in the companion volume, The New Regional Economics, chapter 15 (Wilse-Samson, 2026), and reach this book through Chapters 34 and 36. This chapter cites them rather than repeating them.
What this chapter is, and what it is not
A book that has spent thirty-four chapters insisting that African statistics will not bear the weight usually placed on them should not, on turning to the future, suddenly acquire confidence. So begin with a taxonomy, because three things routinely confused here have different standing.
A forecast is a claim about what will happen, and it can be scored. The Fund publishes one for almost every country on this continent, and this chapter sets its own arithmetic beside it below.
A scenario is a claim about what would happen if something else were true. It cannot be scored, only checked for internal consistency, and its value is entirely in whether the “if” is the right one. The two worlds of Chapter 1 are scenarios in this sense.
An accounting projection is neither. It is a sum: take an identity that holds by construction, put numbers into it, and turn the handle. It cannot be wrong about the arithmetic and it has no opinion about the world. Every number in Table 35.1 is of this third kind, and the chapter’s honesty consists in saying which input was measured, which was projected by somebody else, and which was chosen here.
The division of labour is clean. Term one, the growth of the working-age population, is projected by the United Nations, sits on every card, and is very largely already determined, because most of the people who will be working in Africa in 2050 have already been born (WPP, 2024). Terms two and three are chosen. That is the entire content of the exercise: one term is given, two are the argument, and the distance between the paths below is the distance between the two terms that require a state, firms and a bargain.
Chapter 4 did a version of this on the back of an envelope and said so, calling it illustrative arithmetic and promising that this chapter would do it properly. Doing it properly means three things. It means doing it card by card rather than continentally, because a continent whose incomes run from $470 to $18,479 a head has no representative country. It means writing every assumption down as a number a reader can change. And it means saying, before the results, what the exercise cannot do: it has no feedback in it, no prices, no capital stock, no trade, no exchange rate and no politics. A country whose income per head falls for twenty-five years in Table 35.1 would, in the world, have had a currency crisis, an election and probably a coup somewhere in the middle of it. The table would not know.
The axis: two worlds, not four quadrants
Chapter 1 set out the assumption underneath the identity and the world in which it fails, and Chapter 4 staged that world as the sixth objection, the only one that defeats the case rather than delaying it. This chapter takes it as the axis and does not restate it. What belongs here is the reason it is an axis rather than a menu.
Scenario exercises usually proliferate: two uncertainties crossed, four quadrants named, a two-by-two no reader can hold in her head. This chapter has one axis because the book’s argument has one hinge. Everything else that could be varied, fertility, commodity prices, climate, urbanization, the settlement, changes the size of a term. Only the arrival of a labour-redundant frontier changes what the terms mean.
Take the three terms in turn, and note that the change is in the interpretation rather than in the arithmetic. In the labour-abundant world term one is the endowment: a working-age population growing at 2.19 percent a year at the continental median is 2.19 points of potential output before anybody does anything. In the labour-redundant world the same cohort is a cost, and the countries carrying most of it are the countries the century is hardest on. Term two stops being a measurement and becomes a choice: Chapter 10 spent its length establishing how badly the employment ratio is measured on this continent, and in the second world the interesting question is not what the ratio is but what a society decides it should be and pays for. Term three stops being built and starts being rented: the structural-transformation literature describes how a country raises output per worker by moving people and improving firms, and in the second world productivity arrives as a licence, a lease and a container (Korinek and Stiglitz, 2021).
The upside branch of the second world is the one Chapters 13 and 14 describe and this chapter parameterises. If the binding constraint on frontier compute turns out to be electricity and metal rather than chips, then sun, land, copper and cobalt are the collateral of the century, and a continent that holds them holds something the world must buy. Chapter 30 says why that branch is drawn with a dotted line: the region on top of the world’s cobalt has held that position for sixty years and has $871 a head to show for it. An asset is not an income, and the difference between the two is who owns the machine at the other end of the wire.
One asymmetry belongs on the page before the numbers. The labour-abundant world is the one in which policy has purchase, because in it the terms that carry growth are terms a state can move. In the labour-redundant world the decisions that matter are ownership decisions taken now, at today’s prices, by whoever has both the capital and the forecast; Chapter 33 makes that observation about the Gulf’s African purchases and calls it a correct forecast, executed. A reader who thinks the second world the more likely one should conclude that the urgent questions are not in Part III but in Chapters 21, 22 and 32, and that they are being settled while the argument is still about factories.
The arithmetic exhibit, and every assumption in it
Here is the whole construction, so a reader can rebuild it or reject it.
The base. Output in 2025 and population in 2024, from each country card. Fifty-three of the fifty-four cards carry the employment and productivity terms; the Seychelles carries neither and is not projected, which costs the exercise $2.3 billion of output and about a hundred thousand people. Income per head here is card output divided by card population, which differs by a little from the per-head field the cards carry, because the Fund’s own per-head figure uses its own population estimate. For most countries the gap is a percent or two. For Ethiopia it is nineteen percent, $987 on the card against $826 on the division, which is a data-quality finding rather than an arithmetic one and belongs to a country whose last census was in 2007.
Term one. Each card’s population in 2050 against its population today gives an annual rate; the continental median is 1.80 percent a year, running from minus 0.53 percent in Mauritius to 2.70 percent in the Democratic Republic of the Congo, with six cards above 2.5 percent. That is total population, not the working-age population the identity actually wants, because the cards carry the total in 2050 and not the 15 to 64 figure. The gap between them is the demographic dividend, and it is not small: continentally the population aged 15 to 64 grows at 2.28 percent a year to 2050 against 1.89 percent for the total, a wedge of 0.39 percentage points a year. This chapter adds that wedge to every card, uniformly, which takes the median to 2.19 percent, the range to minus 0.14 in Mauritius and 3.08 in the Democratic Republic of the Congo, and the count above 2.5 percent to fifteen. It is an assumption and a crude one: countries early in the transition will get more of it and Mauritius and Morocco will get none. Drop it and continental income per head in 2050 falls from $2,593 to $2,353 on the first path, which is the size of the thing being assumed.
Terms two and three. Three paths, each stated as a starting point, a target and a shape.
| Parameter | (a) the decade continues | (b) labour-abundant success | (c) labour-redundant |
|---|---|---|---|
| Term two, starting value | the card’s own 2014 to 2024 rate | the card’s own rate | the card’s own rate |
| Term two, target in 2050 | unchanged | +0.50 percent a year | -1.00 percent a year |
| Term three, starting value | the card’s own 2014 to 2024 rate | the card’s own rate | the card’s own rate |
| Term three, target in 2050 | unchanged | 1.92 percent a year, the continental top quartile | 0.74 percent a year, the continental median |
| Rent premium on term three | none | none | +1.00 percentage point on 17 cards |
| Shape | flat | linear to the target | linear to the target |
The starting values are each card’s own decade, the two continental reference values are the top quartile and the median of the 53 cards carrying the productivity term, and the targets and the premium are this chapter’s choices. Sources: ILOSTAT modelled estimates, November 2025, for the starting values, via the country cards.
Two of those rows need defending. The term-three target in the success case is the top quartile of what African economies actually managed over the decade to 2024, which is 1.92 percent a year. That is a great deal less than the 3.0 percent Chapter 4 used to describe what a serious industrialization delivers, and the gap is itself a finding: the top quartile of the observed African decade is well under the rate the recipe literature treats as the object. Set the target at Chapter 4’s 3.0 percent instead and hold it from the first year, and continental income per head in 2050 is $4,796 rather than $3,047. The optimistic case in this chapter is therefore considerably less optimistic than the optimistic case in Chapter 4, and the reason is that this one is anchored to a distribution rather than to an ambition.
The second row worth defending is the rent premium. The compute-inputs branch says that some African countries hold assets a machine economy has to buy, and should therefore earn more on the third term than the continental median even while the labour terms deteriorate. Seventeen cards are treated as holding those assets: the thirteen in Chapter 13’s critical-minerals table, and the four economies Chapter 14 names as able to contract firm, exportable power at hyperscale, which are Morocco, Egypt, Kenya and Ethiopia. Between them those seventeen hold 56.0 percent of continental output today and 52.9 percent of its projected population in 2050. The premium is one percentage point a year on the third term, worth about a quarter on the 2050 level. That number is chosen: nobody knows what a continent’s electrons and ore are worth to a machine economy, and a reader who would set the premium at three points can multiply.
From 2050 to 2100. Term one becomes each card’s population growth from 2050 to 2100, terms two and three are frozen at their 2050 values, and the working-age-share wedge is set to zero, because the transition that produces it has largely run by mid-century. Five cards have a shrinking population over that half-century: Cabo Verde, Eswatini, Mauritius, Morocco and Tunisia.
What the arithmetic says
Table 35.1: the continent in 2050 and 2100 under three paths
| Path | Continental GDP 2050 (\(bn) | GDP per head 2050 (\)) | Implied continental growth (percent a year) | GDP per head 2100 ($) | |
|---|---|---|---|---|
| 2025 base | 3,136 | 2,072 | ||
| (a) the decade continues | 6,389 | 2,593 | 2.89 | 6,673 |
| (b) labour-abundant success | 7,508 | 3,047 | 3.55 | 9,203 |
| (c) labour-redundant | 5,781 | 2,346 | 2.48 | 2,645 |
Fifty-three country cards; the Seychelles is not projected. Output is in current US dollars at the 2025 base, so the figures are real only in the sense that the growth rates applied to them are. Term one is the growth of each card’s projected population plus a uniform continental adjustment for the rising working-age share; terms two and three follow the paths in the parameter table. Sources: UN World Population Prospects 2024, medium variant, for population; IMF World Economic Outlook, April 2026, for the 2025 output base; ILOSTAT modelled estimates, November 2025, for the starting values of terms two and three; all via the country cards. Illustrative arithmetic, not a forecast.
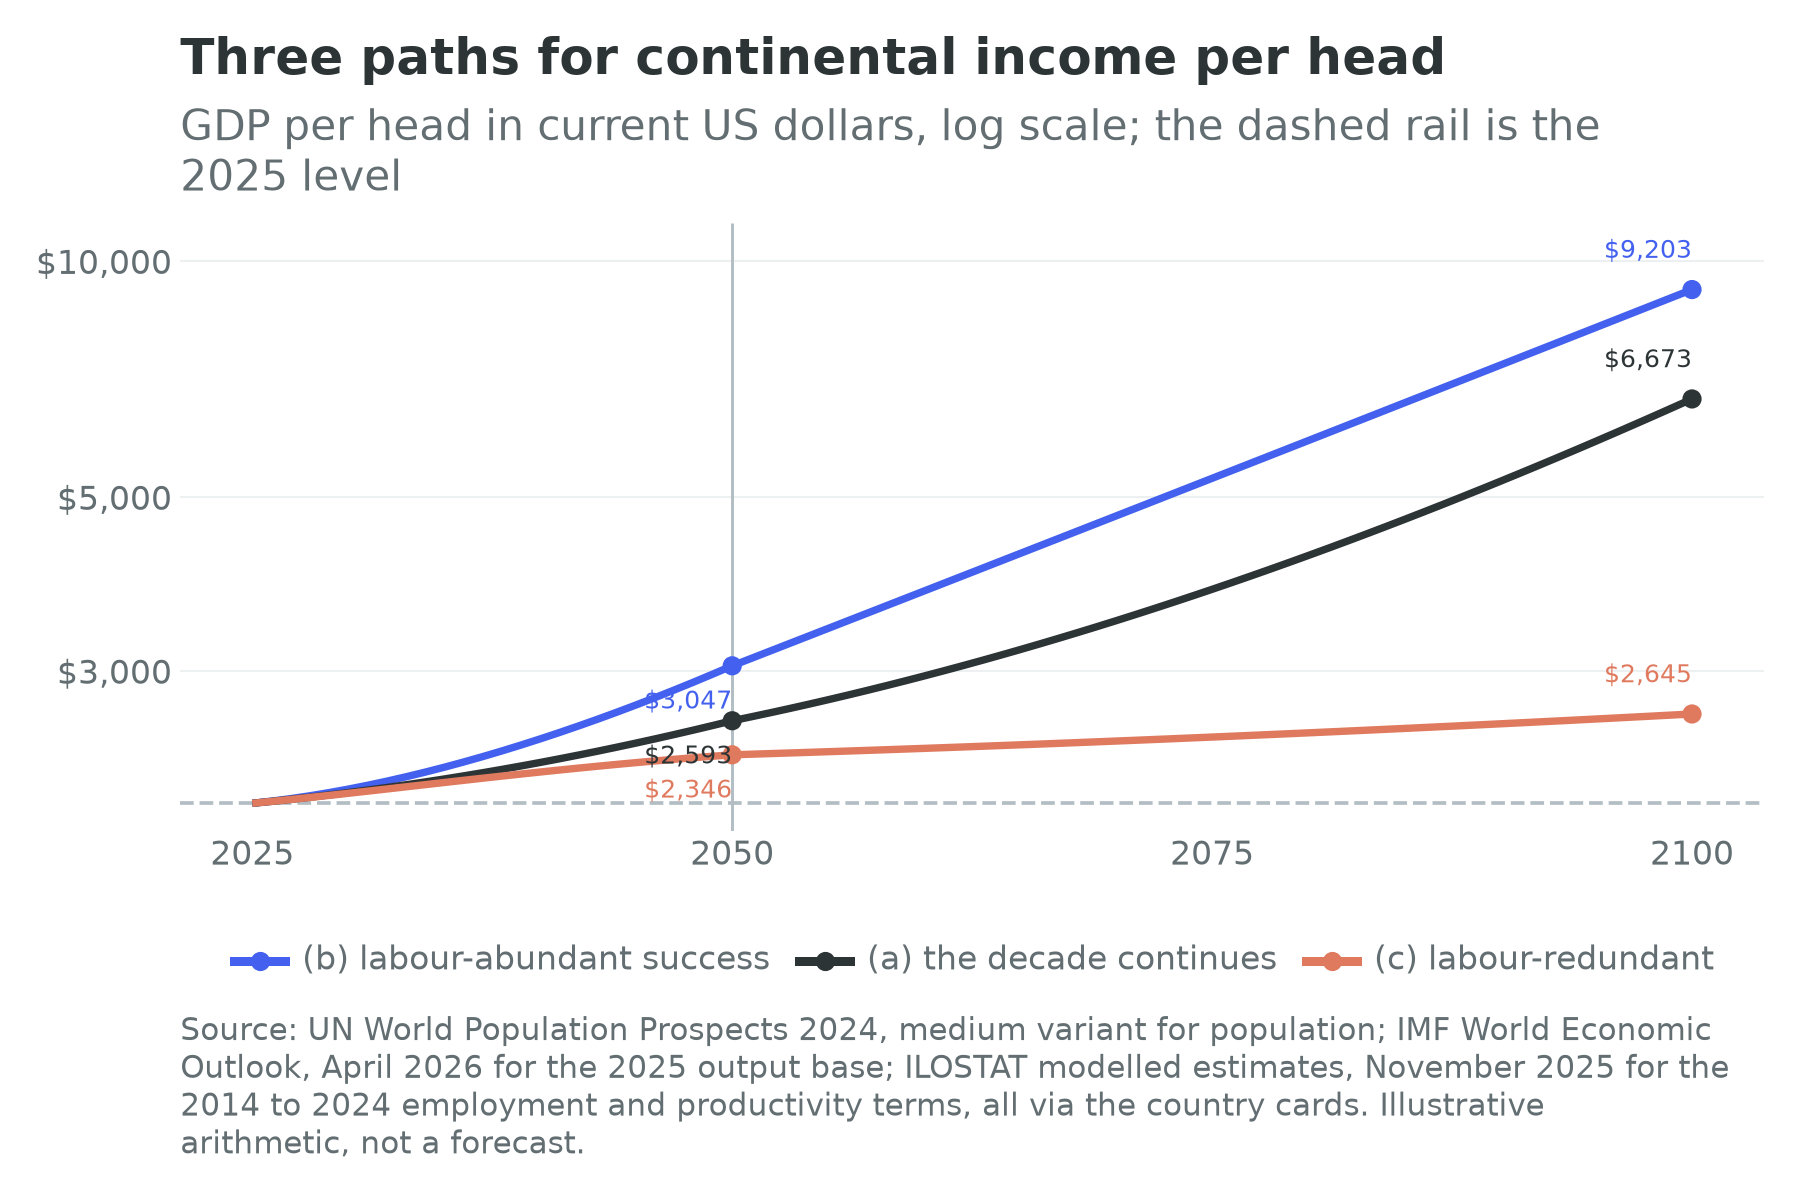
Read the table slowly, because its most important feature is how little separates the rows in 2050.
Start with the fact that all three paths grow. Continental output at least doubles under the worst of them, and the continent is between 1.84 and 2.39 times its present size in 2050 whatever happens to terms two and three, because term one is doing so much of the work. That is the structural fact about African growth and it is why the phrase “Africa is growing” carries so little information. An observer who wanted to know whether the century had gone well or badly, and who was allowed to see only continental GDP, would not be able to tell.
The second is that the per-head column is where the paths live, and even there the range is narrow at mid-century: $2,346 to $3,047, a spread of 30 percent on a quantity that will have been in dispute for twenty-five years. The reason is arithmetic. Continental income per head rises by a quarter under the first path and by not quite a half under the second, because term one adds to output and to the denominator at almost the same rate, and the demographic dividend, which is the wedge between them, is worth less than four tenths of a point a year. Chapter 2 said the whole of the first demographic dividend was six percentage points of working-age share over twenty-six years. Here is what six points of share is worth when it is compounded rather than admired.
The third is the shape of the divergence. The paths are close in 2050 and far apart in 2100, which is what compounding does, and it is the reason to treat the last column with the suspicion it deserves. Under the first path continental income per head reaches $6,673 in 2100; under the third, $2,645, which is a quarter more than today after seventy-five years. The gap between those two numbers is not knowledge. It is the mechanical consequence of running a fixed growth rate for three quarters of a century, and it is what a growth model produces when it is asked a question about a period longer than the one any of its inputs were measured over.
The paths against the Fund’s forecasts
The one place where this arithmetic can be scored against something is the near term, because the cards carry the Fund’s growth projection five years out for 52 of the 54 countries. Path (a) generates its own implied growth rate for each card over the first five years, and the two can be set side by side.
They disagree, and they disagree in one direction. On 49 of the 52 cards, continuing the last decade’s terms gives a lower growth rate than the Fund’s projection. Weighted by output, path (a) gives 2.43 percent a year against the Fund’s 4.23 percent, a gap of 1.80 percentage points; unweighted, 2.45 against 4.47; the median gap across cards is 1.43 points. The largest gaps are Sudan at 8.39 points, South Sudan at 6.77, Equatorial Guinea at 4.98, the Republic of the Congo at 4.89, Liberia at 4.41 and Uganda at 4.10, and every one of those is a recovery or a hydrocarbon start-up, which is to say a projection of a specific event rather than of a trend. Only three cards run the other way, and Senegal is the sharpest of them at 1.15 points, a country whose decade was strong and whose forecast was cut after the restatement of its public debt that Chapters 21 and 24 describe.
Two readings are available and the chapter does not choose between them. The generous one is that the Fund knows things the identity does not: a project pipeline, a stabilisation programme, a field coming on stream. The unkind one is that a two-point gap sustained across almost every country on a continent is not a set of country judgements but a prior. The box below is about which of those has historically been right.
Note what the gap is not. It is not a gap in term one, which is the same in both. Either the Fund expects the employment ratio and output per worker to do something over the next five years that they did not do over the last ten, or it expects growth without saying which term carries it. A forecast that does not decompose cannot be argued with, which is one reason this book decomposes.
The 2050 distribution, card by card
A continental average conceals the argument, so here is the same arithmetic as a distribution.
Table 35.2: GDP per head in 2050, the ten highest and the ten lowest under each path
| Rank | (a) the decade continues | (b) labour-abundant success | (c) labour-redundant |
|---|---|---|---|
| 1 | Mauritius 26,972 | Mauritius 26,243 | Mauritius 18,616 |
| 2 | Cabo Verde 11,896 | Botswana 11,872 | Gabon 9,440 |
| 3 | Botswana 9,081 | Cabo Verde 11,781 | Botswana 8,450 |
| 4 | Djibouti 8,723 | Gabon 11,665 | Cabo Verde 8,379 |
| 5 | Algeria 8,085 | Algeria 9,938 | South Africa 7,178 |
| 6 | Gabon 7,978 | South Africa 8,891 | Algeria 7,071 |
| 7 | Morocco 7,468 | Libya 8,587 | Morocco 6,842 |
| 8 | Côte d’Ivoire 6,871 | Morocco 8,467 | Libya 6,101 |
| 9 | Egypt 5,991 | Djibouti 7,985 | Djibouti 5,697 |
| 10 | Libya 5,990 | Tunisia 7,272 | Tunisia 5,159 |
| … | … | … | … |
| 44 | Central African Republic 833 | Liberia 1,195 | Liberia 851 |
| 45 | Chad 762 | Somalia 1,105 | Somalia 790 |
| 46 | Liberia 761 | Central African Republic 983 | Mozambique 770 |
| 47 | Mozambique 710 | Mozambique 950 | Madagascar 707 |
| 48 | Madagascar 627 | Malawi 927 | Central African Republic 704 |
| 49 | Malawi 619 | Madagascar 873 | Malawi 661 |
| 50 | Eritrea 345 | Sudan 746 | Sudan 530 |
| 51 | Sudan 340 | Eritrea 643 | Eritrea 458 |
| 52 | Burundi 339 | Burundi 582 | Burundi 414 |
| 53 | South Sudan 142 | South Sudan 383 | South Sudan 271 |
GDP per head in 2050 in current US dollars at the 2025 base, from the projection described above, ranked within each path. Fifty-three cards; the Seychelles is not projected. Sources as Table 35.1. Illustrative arithmetic, not a forecast.
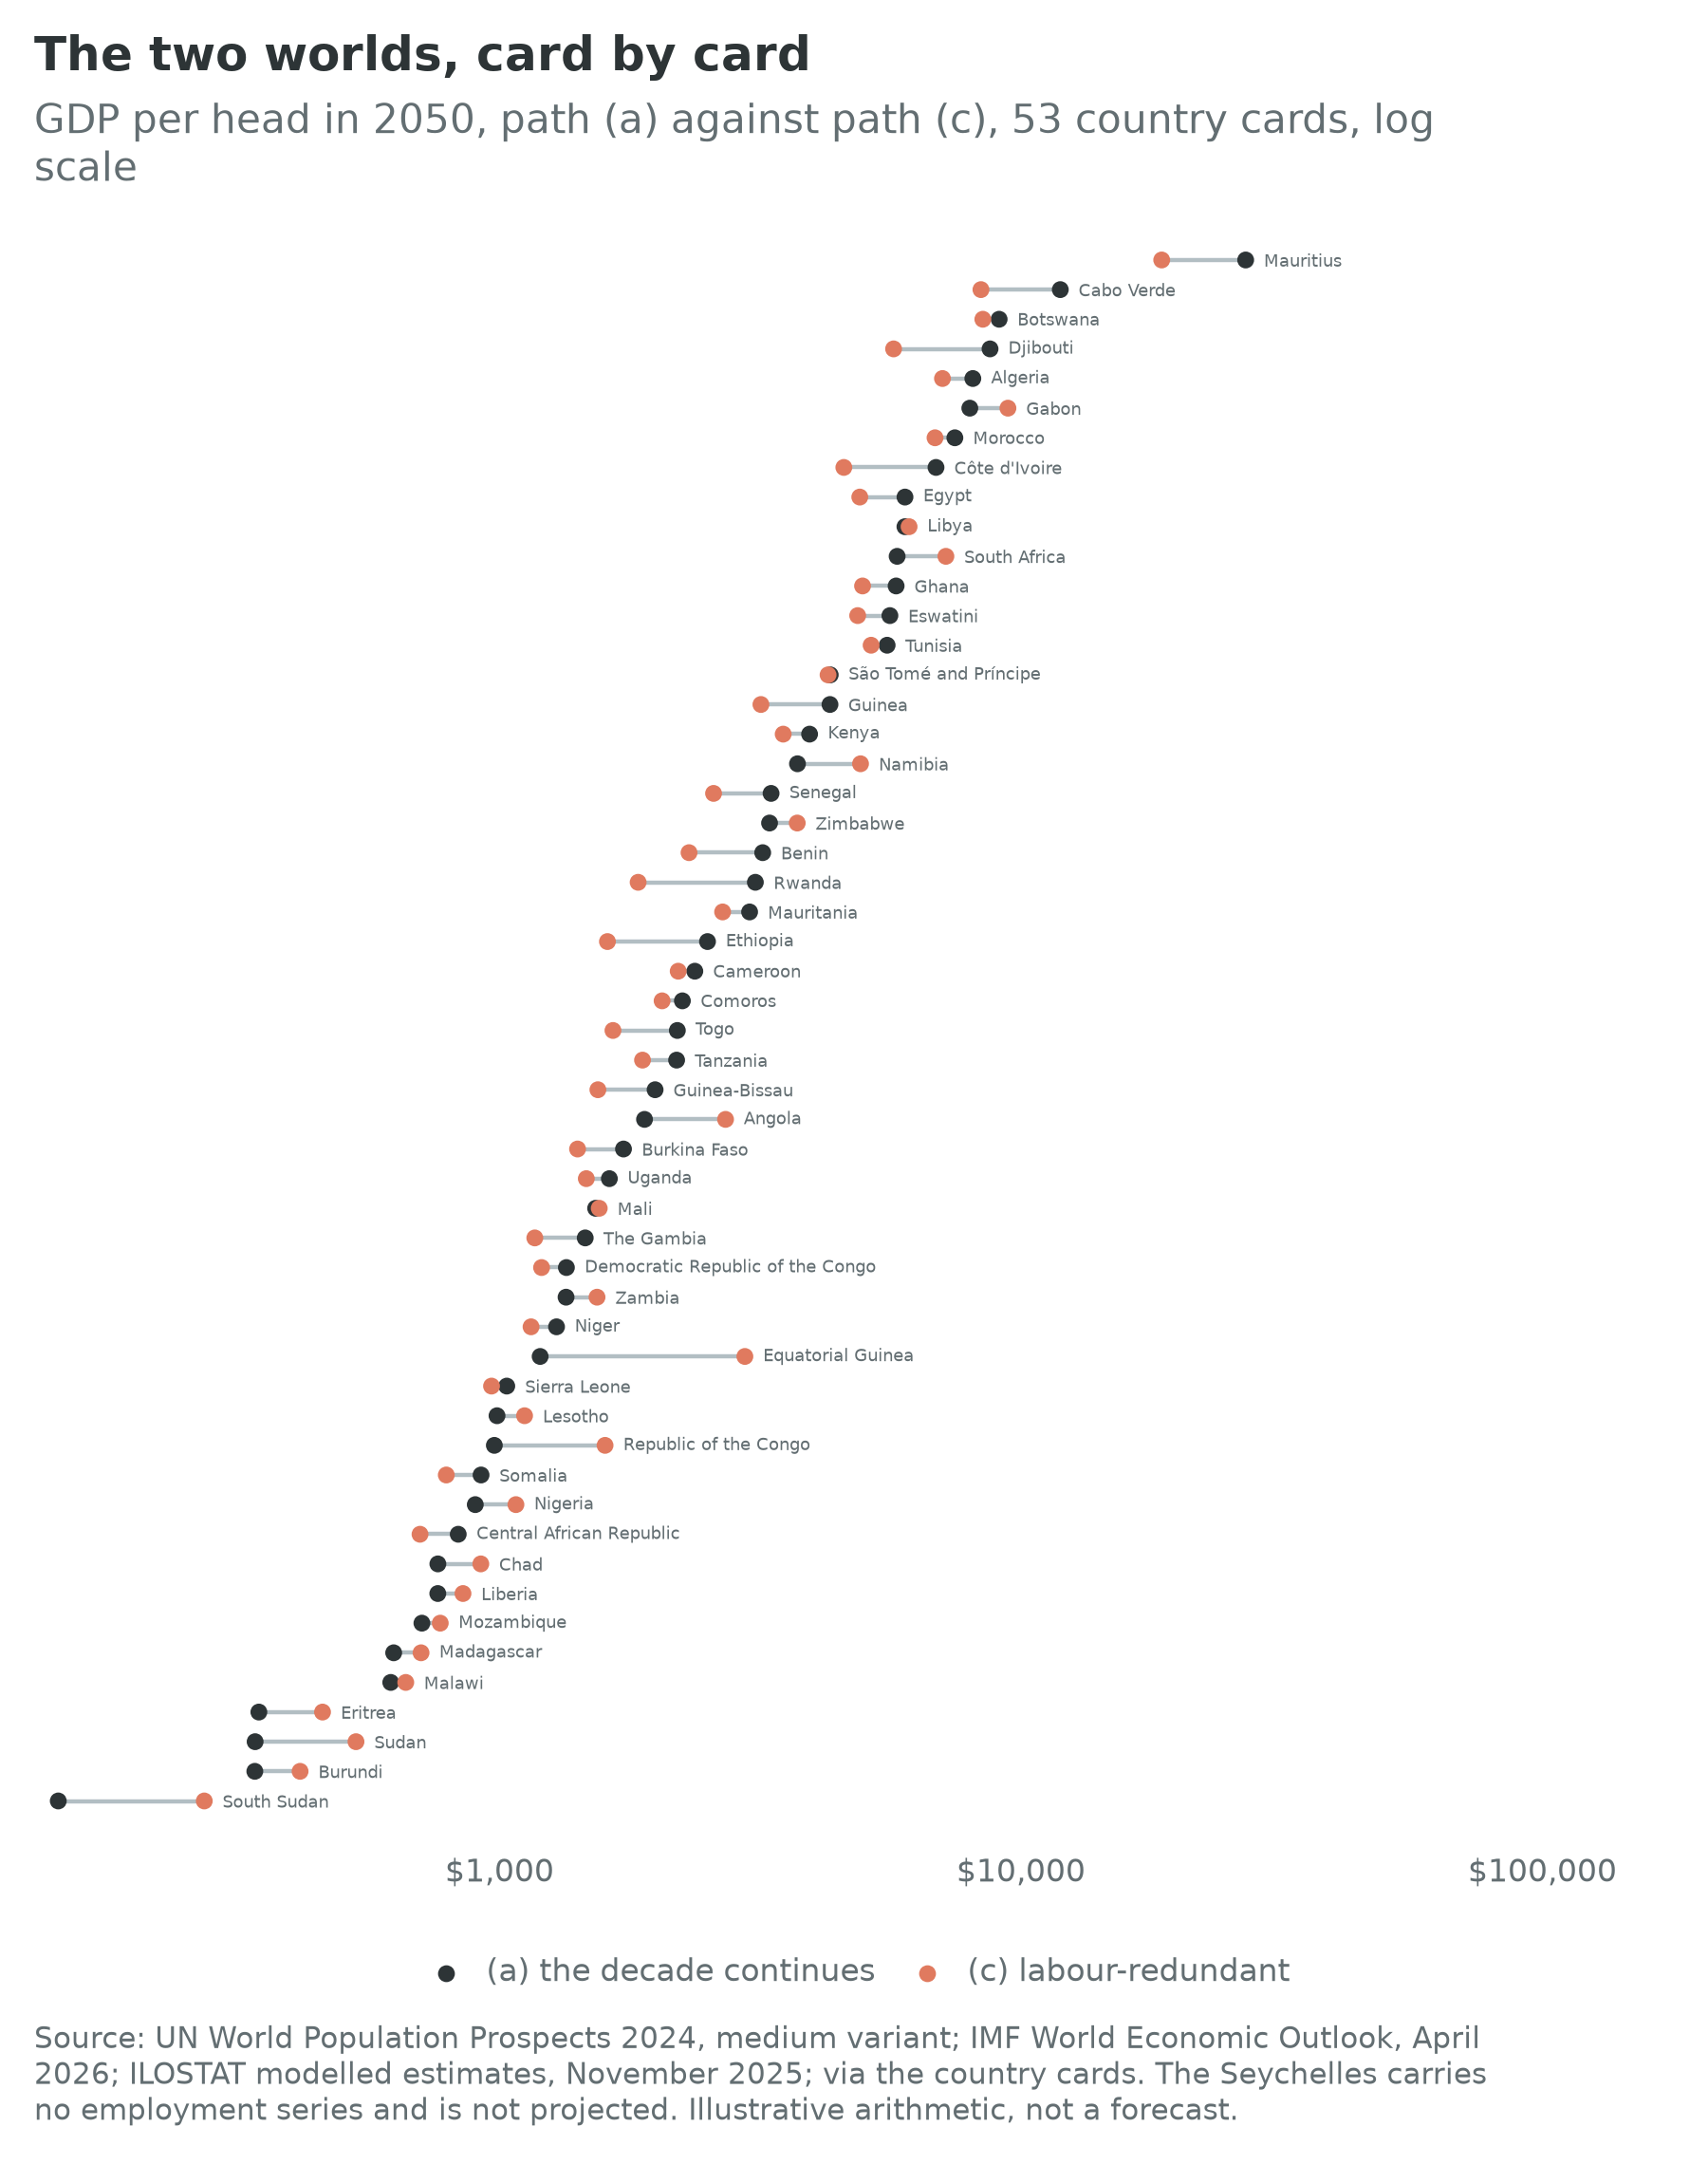
Four things fall out of the distribution, and the fourth is a criticism of the exercise.
The ordering barely moves. Between the first path and the third, the mean absolute change in a country’s rank is 2.9 places out of 53. Nigeria goes from 43rd to 41st, Ethiopia from 24th to 30th, Morocco stays 7th. A reader who wanted a map of Africa in 2050 could draw one and it would look much the same under either world; what changes is the number written on each country, not where the country sits. The exceptions are instructive and they are all rent economies: Equatorial Guinea rises 18 places, the Republic of the Congo 10 and Angola 9, because a world that pays for what is in the ground is a world these economies are already built for. Chapter 12 makes the same point at sector length, and Chapter 23 makes it about distribution: the hydrocarbon exporters are a preview of the second world rather than an exception to it.
The bottom of the table is the same bottom in all three columns. South Sudan, Burundi, Eritrea, Sudan, Malawi and Madagascar are in the last ten under every path. Nothing this chapter varies decides their position: it is decided by a starting level so low that no plausible rate closes the gap in twenty-five years, and in half the cases by a conflict the arithmetic cannot see. Chapter 36 owns them.
Dispersion falls in both constructed paths and rises in neither. The ratio between the highest and lowest card is 189 to 1 under the first path and 69 to 1 under both of the others. That is not a finding about the world but a mechanical consequence of assuming convergence to a common target, worth naming because convergence assumptions are the standard way long-run projections smuggle in optimism. Under the first path, which assumes no convergence at all, twenty-five of the fifty-three cards are still below $2,000 a head in 2050 and seventeen have a lower income per head than they have today.
Twenty-one cards are better off in the labour-redundant world than in the continuation of their own decade, and twenty of those twenty-one had a productivity term below the continental median. Nigeria is one of them, at $1,075 a head under the third path against $898 under the first. This is the exercise’s most obvious defect and it should be stated plainly rather than buried: path (c) sets term three to the continental median, so for the twenty-six cards whose own decade was worse than the median it is an improvement wearing a pessimistic label. The right way to read those rows is not that the machines would be good for Nigeria. It is that Nigeria’s last decade was bad enough that a scenario designed to be gloomy has to raise its productivity term to run it. A projection cannot make a country worse than its own record without an assumption saying so, and this chapter declined to write that assumption because it would have been unfalsifiable.
The same defect runs the other way in the success case. Thirteen cards already have a productivity term above the continental top quartile, so path (b) converges them downward: Ethiopia, Kenya, Ghana, Côte d’Ivoire, Rwanda, Egypt and Guinea among them. Under the success path Ethiopia’s income per head in 2050 is $1,983, lower than the $2,505 that continuing its own decade would give. That is not a mistake in the table. It is the table asking whether a country can hold 5.91 percent output-per-worker growth for a quarter of a century, and answering, by construction, that the top quartile of a continent is a more defensible target than the record of one decade in one country.
What the map and the scoreboard would show
Three concrete images, since a projection that cannot be pictured is not much use.
Under the first path the map of 2050 is today’s map with larger numbers on it and the same colours: North Africa and the small island and mineral economies at the top, a middle band across West and East Africa, the Sahel and the Horn at the bottom. Chapter 4’s figure showed the engine and the base as different countries; in 2050 they are still different countries.
Under the third path the map keeps its shape and gains an overlay, the compute-inputs group, whose median card reaches $3,171 a head in 2050 against $1,747 for the cards outside it. That is the compute-inputs case doing what it does: it does not make Africa rich, it sorts Africa, by what is under the ground and how much firm power a country can put on a wire. Three of the ten highest cards in that column hold the compute inputs, so the group’s advantage shows up in the middle of the distribution rather than at the top.
The identity scoreboard, the one-page table of all 54 countries and their three terms that opens Part III, is the exhibit that would change most. Today its middle column is a row of small negative numbers, a median of minus 0.15 percent a year, and Chapter 10’s reading of it is that term two has been inert rather than catastrophic. Under the labour-abundant success path that column would be a row of small positive numbers by the 2040s, which is the whole of what the book is hoping for and looks like almost nothing on a page. Under the labour-redundant path the same column would be a row of numbers around minus 1, and it would be accompanied by an overlay column that does not yet exist: the share of national income accruing to labour. That column is the one worth building, and its absence is the sharpest gap in this book’s data layer.
Three cards, in both worlds
Take three countries the book has already spent chapters on, and read the arithmetic off their cards.
Nigeria is the case where the demography is enormous and the productivity term is negative. Its population goes from 232.7 million today to 359.2 million in 2050 and 476.7 million in 2100. Its term one to 2050, on the adjustment above, is 2.07 percent a year. Its employment ratio grew at 0.29 percent a year over the decade and its output per worker fell at 1.94 percent, which is the configuration in which people work more and produce less. Continue that and Nigerian output reaches $323 billion in 2050 against $290 billion today, on 359 million people, which is $898 a head against $1,248. Under the success path it is $1,511 a head; under the labour-redundant path, $1,075. Every one of those numbers is below the continental average, and the most populous country in Africa is poorer per head in 2050 than it is now under the single most likely path in this chapter. That is the arithmetic behind Chapter 24’s diagnosis, and it is why a chapter about a demographic engine spent its length on a port and a grid.
Ethiopia is the case where the arithmetic breaks down first, and it is worth watching it break. Its population goes from 132.1 million to 225.0 million in 2050 and 367.3 million in 2100. Its output per worker grew at 5.91 percent a year over the decade, the highest of the 53, while its employment ratio fell at 1.58 percent, the sharpest fall on the continent. Continue that decade and Ethiopia reaches $2,505 a head in 2050 and $20,440 a head in 2100. The second of those numbers is absurd, and its absurdity is the argument of this section: it is what happens when a decade of catch-up growth from a very low base is treated as a permanent rate and compounded for seventy-five years. Nobody believes it, and yet it is the arithmetically consistent extension of a series the cards carry. The right conclusion is not to pick a different number. It is that a growth rate is a statement about a period, that 5.91 percent is the highest rate any of the 53 cards recorded over even the one decade they carry, and that the 2100 column of any projection is a device for showing what an assumption implies rather than a claim about the twenty-second century.
Morocco is the case where the demography has already gone. Its population goes from 38.1 million to 43.4 million in 2050 and then back to 37.9 million in 2100, fewer people at the end of the century than today. Its term one to 2050 is 0.90 percent a year and from 2050 to 2100 it is minus 0.27 percent. Continue the decade and Morocco reaches $7,468 a head in 2050, seventh on the continent; under the success path $8,467; under the labour-redundant path $6,842. Morocco’s three paths differ by less than a quarter, because its term one contributes almost nothing in either world and its outcome is therefore almost entirely a productivity question. Chapter 28 said Morocco holds a better hand in the second world than in the first, having sun, phosphate, an interconnector and a hydrogen programme. The arithmetic agrees only mildly, and the reason is that the rent premium raises a term-three number that was already respectable. A country that is not in the demographic century is a country for which the scenario axis matters less, which is a general point about the whole of North Africa.
The other axes, and why they are modifiers
Five things a reader might reasonably want as separate scenarios are treated here as modifiers of the axis. Each moves a term. None changes what the terms mean.
Fertility. The population figures above are the medium variant, which is the median of a probability distribution rather than a central plan (Raftery, Alkema and Gerland, 2014). The low and high variants shift assumed fertility by half a child per woman in each direction, a convention rather than a confidence interval, and Chapter 2 sets out how much of the distance between them is assumption rather than measurement. The effect on this chapter’s arithmetic is second-order before 2050 and first-order after it, for the reason Chapter 2 gave: almost everybody who will be of working age in 2050 has been born, and almost nobody who will be alive in 2100 is bound by that. The best available estimate of what the difference is worth is not large. Ashraf, Weil and Wilde (2013) priced the move from the medium to the low variant for Nigeria at 5.6 percent of output per head after twenty years and 11.9 percent after fifty, which is a real gain, a slow one, and considerably smaller than the rhetoric around the demographic dividend implies. Chapter 36 carries the risk that runs the other way, a fertility transition that stalls, which the record of Kenyan and Ghanaian stalls says is not hypothetical.
Urbanization. Where the cohort of term one goes decides how much of term three it gets, and the companion volume owns the argument: a city that concentrates people around the distribution of a rent delivers neither the productivity gain nor the employment that urbanization is supposed to deliver (Wilse-Samson, 2026). This chapter’s arithmetic has no urban dimension at all, and that is the largest thing missing from it. A version of the first path in which African urbanization delivered the productivity gains that Asian urbanization delivered would sit well above the second path; a version in which it delivers the consumption city would sit below the third. Chapter 22 carries the seventeen megacities and the land question underneath them.
Commodity prices. Terms of trade move term three and nothing else, which is why they are a modifier rather than a world. The 2000s boom is the standing illustration: Chapter 4 showed a decade of growth in which term three was lifted substantially by prices and term two did very little, and when the cycle turned the borrowed part of the growth went with it. Chapters 12 and 13 own the mechanism. The arithmetic version is simple and unsettling: a commodity cycle is worth several points a year on term three for a decade and zero over twenty-five, so any projection that starts at the top of one is wrong in a knowable direction.
Climate. Chapter 34 prices what arrives as finance and Chapter 36 carries the tail. Neither belongs in the table above, because the effects that matter are neither smooth nor symmetric: a drought is a fiscal event in a hydro-dependent system, a flood is a capital loss, and displacement shows up in the identity as population without employment. The one climate parameter with a defensible place in a long-run projection is the trend in agricultural yields, and Chapter 11’s finding that roughly ninety-five percent of Sub-Saharan cropland is rain-fed (FAO, 2024) is why that trend is a distribution rather than a line.
The settlement. Chapter 5’s is the modifier that decides the others, and it is the one this chapter’s arithmetic is least able to represent. The two constructed paths assume that every card moves towards the same target at the same speed, and that assumption is exactly what Chapter 5 says is false: institutions hold where they fit the distribution of organizational power, and a target that is reached in Kigali is not reached in Kinshasa because the same policy is not the same policy in the two places. The honest version of paths (b) and (c) would have a different target for each card, and the reason this chapter does not write one is that a per-country target chosen by the author is a per-country forecast pretending to be a scenario. The convergence assumption is visible, crude and arguable. That is better than an invisible one.
What the forecasters got wrong
This book does not run a “what the experiments say” box in this chapter, because there is no randomized study of the twenty-second century. The relevant evidence is a record: what happened the last time people projected this continent forward, and what kind of error they made.
The Economist ran “The hopeless continent” in May 2000 and “Africa rising” in December 2011, and Time ran a cover under the same two words a year later (The Economist, 2000; The Economist, 2011; Time, 2012). Chapter 4 uses the covers as bookends. The useful point about them is not that enthusiasm was punished but that the arithmetic underneath it was half right. Sub-Saharan output did rise at roughly 5 percent a year between 2000 and 2014, fast enough to double the region’s economy inside fifteen years, and the decade after 2014 delivered about half that rate and almost nothing per head once population growth was netted out (International Monetary Fund, 2026f; World Bank, 2026a). The Africa Rising literature was not wrong about the growth. It was wrong about which term the growth was in, and therefore about whether it would compound.
The institutional record points the same way. Timmermann (2007), evaluating the Fund’s own World Economic Outlook forecasts, found a systematic tendency to over-predict growth, strongest at longer horizons and for developing countries. An, Jalles and Loungani (2018) put the sharper version: forecasters, official and private alike, almost never call a downturn in advance, so a projection made in a good year embeds the good year. This chapter’s own comparison with the Fund’s projections is a small instance of the same pattern, with the Fund’s five-year projections sitting 1.80 output-weighted points above what the last decade’s terms would deliver.
Underneath all of it sits the warning this book took from Jerven (2013). The forecast errors above are computed against outturns that are themselves manufactured under severe constraints, on a continent where a rebasing has moved measured output by a third in a single announcement and where consumption surveys and national accounts disagree about the 1990s and 2000s by a factor of nearly four (Young, 2012). A forecast miss of two points a year, on a series whose own error bar is of that order, is not evidence about forecasting. It is evidence about how confidently the argument is being conducted.
The practical lesson this chapter takes is the reason for its last section. Do not revise the projection. Watch the series that would distinguish the worlds, and name them in advance so that nobody gets to choose them afterwards.
What would settle it
A scenario axis is useful only if it can be resolved, and it can be resolved only by observations named before they arrive. The pole and sector chapters named theirs, each attached to a claim that could be wrong.
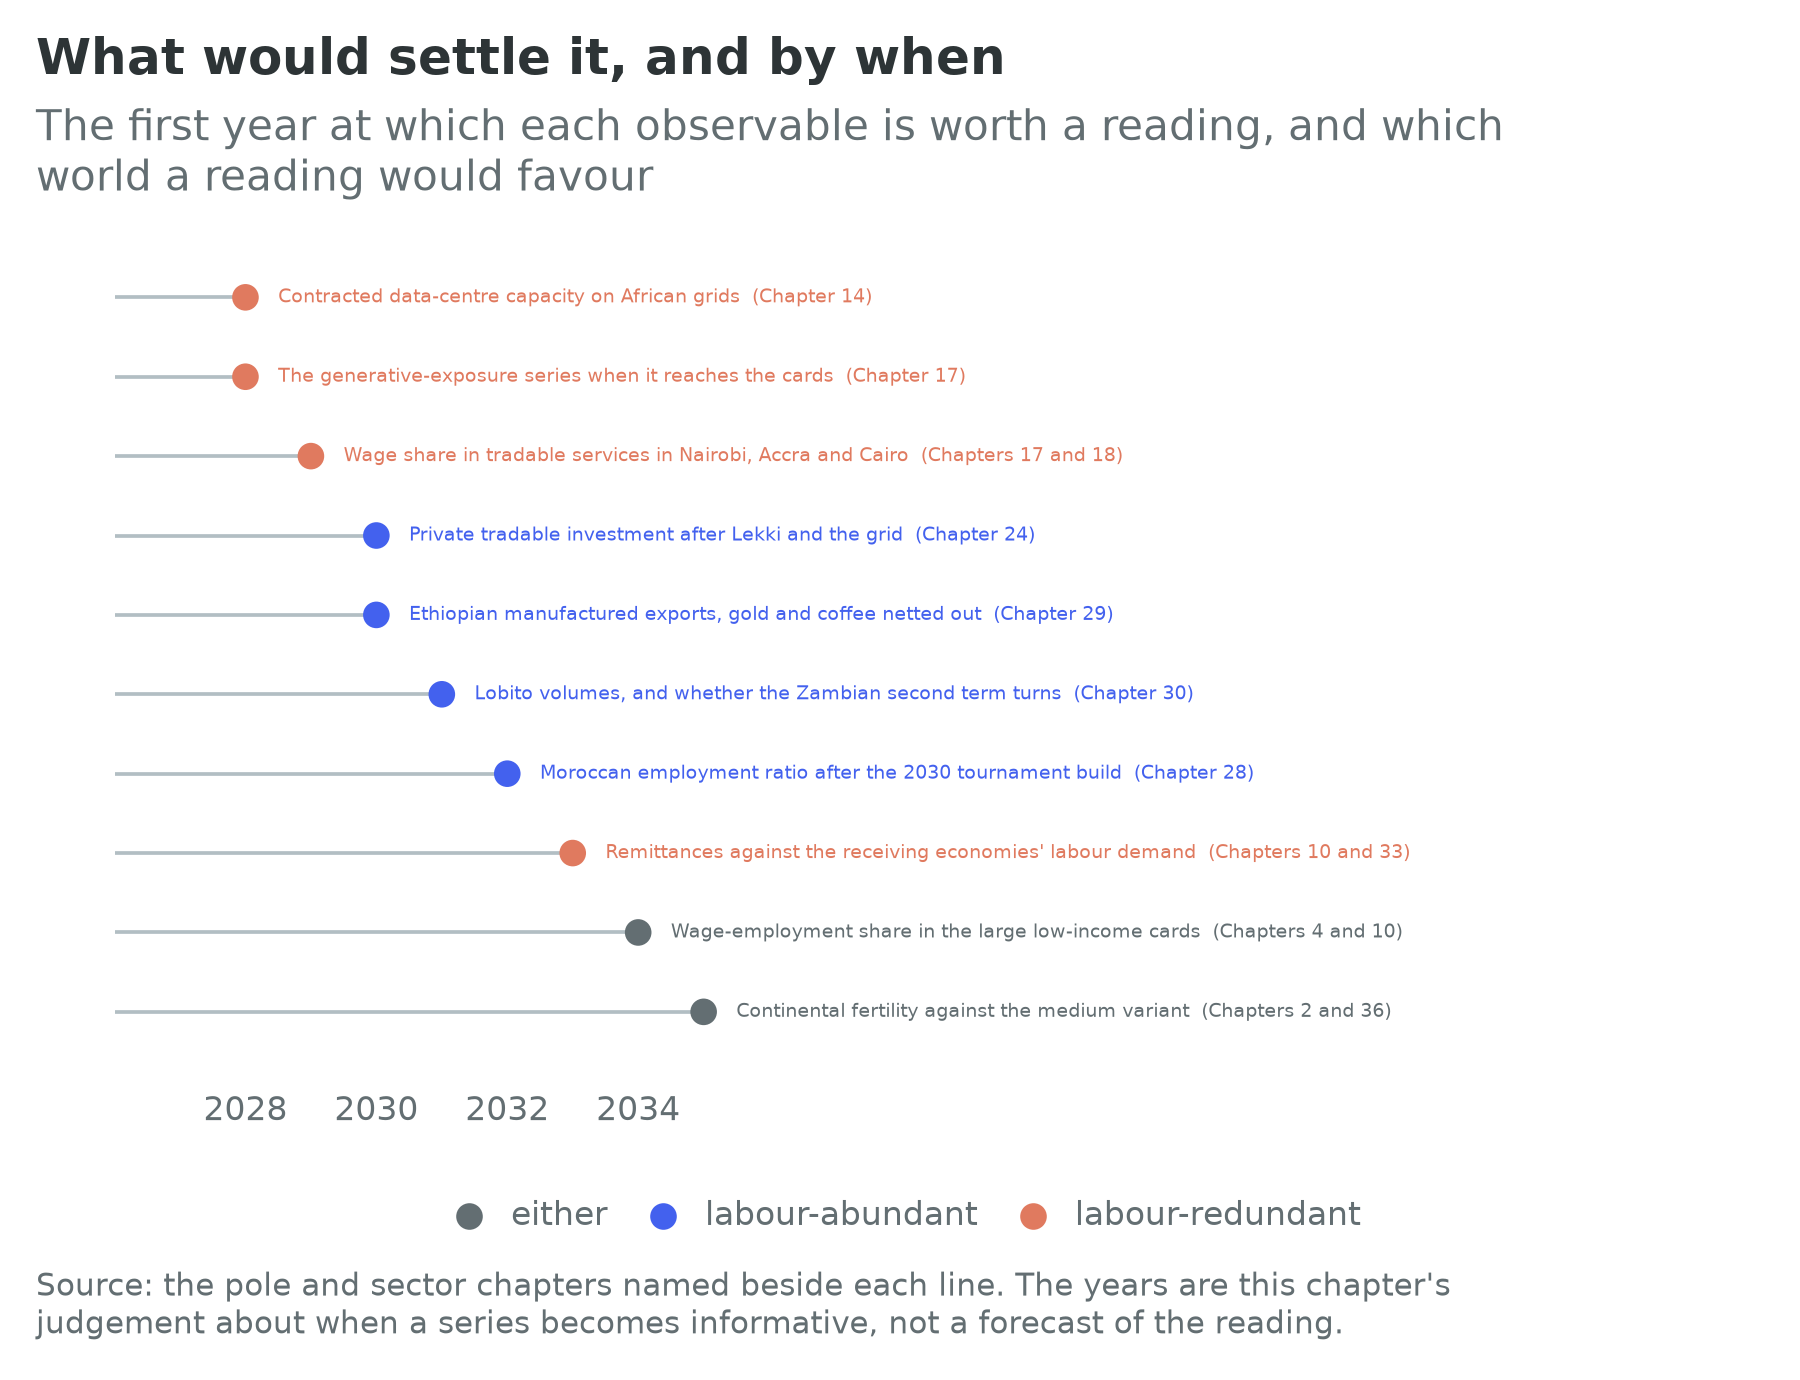
Four of them come from Part VI and all four are labour-abundant-world tests. Chapter 24 argued that the binding constraint on the Lagos to Abidjan pole is infrastructure, and said that if it is right, the refinery, the deep-water port and the corridor highway should be followed by private investment in tradable production rather than in construction and property. Chapter 28 argued that Morocco’s constraint is appropriability rather than infrastructure, and offered the reverse test: if the Moroccan employment ratio turns after the 2030 tournament build-out, the chapter is wrong and the infrastructure branch was binding after all. Chapter 29 said that a reader who wants to know whether it is right should watch the Ethiopian manufactured-export line for the rest of the decade and nothing else, with gold and coffee netted out. Chapter 30 said that if transport binds the Copperbelt, the Atlantic railway’s reopening should show first in cost per tonne and second in volume, and that a decade of rising volumes on a working corridor leaving the Zambian second term flat would confirm that what binds the income is appropriability rather than capacity.
Three come from the second world and they are the ones the data layer is least ready for. Chapter 14’s is contracted data-centre capacity on African grids, which is the cleanest single indicator that the compute-inputs case is happening rather than being announced, and the Kenyan episode it describes, a hyperscale campus stalling because one facility wanted a third of the country’s peak demand, is the shape the constraint takes. Chapter 17’s is the generative-exposure series, the share of employment in the occupations the international index places in the automation band; no such series sits on the cards yet, which is why that chapter had to reason from published regional and income-group estimates instead. Chapter 18’s and Chapter 17’s shared observable is the wage share in tradable services in Nairobi, Accra and Cairo, which is where the first casualty would appear if it appears anywhere.
Two more cut across both worlds. The first is remittances read against the receiving economies’ demand for labour: every external migration corridor rests on somebody wanting workers, and Chapter 10’s point is that the corridor closes before anyone in Africa has automated anything (Chapter 33 carries the partners’ side). The second is the one Chapter 4 named as the thing that would change its author’s mind: a decade in which the wage-employment share rises in the large low-income countries rather than in the small well-governed ones. That is the signature of a term-two improvement that is not a composition effect, and it is the single reading that would move this chapter’s arithmetic from the third path towards the second.
None of these is a forecast, and the list is deliberately short enough to be checked. That is the discipline Chapter 1 asked for: a projection whose assumptions are visible, whose outputs are labelled arithmetic, and whose author has said in advance what would make him change it.
Connections to Other Chapters
- Chapter 1 (Africa in Numbers) states the identity, the assumption underneath it and the two worlds this chapter uses as its axis; Chapter 4 (The Case and the Counter-Case) stages the axis as the sixth objection and does the back-of-envelope version of the arithmetic this chapter builds out.
- Chapter 2 (The Demographic Century) owns term one, the variants and the fertility-stall risk, and is where the projections’ census foundations are read.
- Chapter 5 (States, Political Settlements, and Development Bargains) owns the modifier that decides the others, and explains why a common convergence target is the exercise’s least defensible assumption.
- Chapter 10 (Labor, Youth, and Migration) carries terms two and three by country and answers what employment is for in the second world; the wage-employment overlay is where the third path would first become visible.
- Chapters 13 and 14 (Critical Minerals; Energy) own the compute-inputs branch and supply the seventeen cards that carry the rent premium here.
- Chapters 17 and 18 (Digital; Tourism and the Creative Economy) own the exposure side, and between them hold the tradable-services observables in Figure 35.3.
- Chapters 21, 22 and 32 (Capital and Sovereign Debt; Land; China in Africa) carry the ownership questions that decide whether the compute-inputs branch is a growth century or a rent.
- Chapter 23 (Inequality, Social Protection, and Health) prices the transfer systems the second world would need, and shows why the rent economies are a preview rather than an exception.
- Chapter 36 (What Could Go Wrong) takes the tail this chapter’s smooth paths cannot represent: conflict, the debt wall, the fertility stall, climate and the Sahel.
- Chapter 37 (The Playbook) takes what follows for an investor and a policymaker from a chapter whose central finding is that the ordering barely moves and the levels do.
Discussion Questions
Under the first path in Table 35.1 continental output roughly doubles by 2050 while income per head rises by a quarter, and seventeen of the fifty-three cards are poorer per head in 2050 than they are today. A minister presents the first of those numbers and an opposition economist presents the second. Both are computed from the same arithmetic. Set out what would have to be true for each to be the more honest summary, then say which one belongs in a national development plan and why.
Twenty-one cards are better off under this chapter’s labour-redundant path than under a continuation of their own decade, because the path assumes convergence to the continental median. Design a version of that path that does not have this property, state the assumption it would require, and then say why this chapter judged that assumption unfalsifiable. Is an exercise with a visible defect better or worse than one whose defects are hidden inside a calibrated model?
Path (a) sits 1.80 output-weighted points below the Fund’s five-year projections, and the largest gaps are all recoveries or hydrocarbon start-ups. Take one of those countries and set out the two readings offered above: that the Fund knows something the identity does not, and that a systematic two-point gap is a prior rather than a judgement. What evidence, available before 2032, would distinguish them, and is an accounting projection a useful complement to a forecast or merely a slower one?
Try It
Open the Convergence Calculator and use its second mode, the one that builds a growth rate out of the identity’s three terms rather than asking you to guess it. Run three countries in this order: Nigeria, Ethiopia and Morocco. For each, the boxes arrive prefilled from the card with the decade’s own three terms. First read off the year each crosses the next income threshold on those terms, which is this chapter’s first path for a single country. Then replace the employment term with plus 0.5 and the productivity term with 1.92, the two targets in this chapter’s success path, and read the crossing years again. Then set the employment term to minus 1 and the productivity term to 0.74, the labour-redundant path, and read them a third time. Write one paragraph on a single question: for which of the three countries did the three runs give the most similar answers, and what does that tell you about which countries the scenario axis is really about? Then open the Century Slider, switch the scaling to the working-age population aged 15 to 64, and run it to 2100 with those crossing years in mind.
Data Exercise
Download all fifty-four cards from the country cards page on this site, as cards.csv or as cards.json. Build a table with six columns: scale.gdp_usd, scale.population, scale.population_2050, identity.employment_to_wa_growth, identity.output_per_worker_growth and identity.gdp_growth_forecast_5y. Then do four things. First, reproduce this chapter’s first path: compute each card’s annual population growth from scale.population to scale.population_2050, add 0.39 percentage points for the working-age-share adjustment, add the two identity terms, compound scale.gdp_usd for twenty-five years, divide by scale.population_2050, and rank the fifty-three cards that carry all the inputs; check your top ten and bottom ten against Table 35.2. Second, set identity.employment_to_wa_growth to zero on every card and rank again: report how many places each card moves, which cards move most, and what that tells you about how much of the 2050 ranking the employment term is carrying. Third, compare your first-path growth rate over the first five years with identity.gdp_growth_forecast_5y and reproduce the counts this chapter reports against the Fund’s projections. Fourth, drop every card whose data_quality.confidence_flag is low or unset and recompute the continental total, then write two sentences on how much of the projection rests on countries whose numbers will not bear it. Note which fields are null rather than zero, and never impute a null as a zero.
Data Sources and Further Reading
Key data sources
- UN World Population Prospects 2024 (population.un.org): every population figure here, medium variant, with the working-age band at 15 to 64 where it is stated. The country projections for 2050 and 2100 are on the cards; the continental working-age totals used for this chapter’s share adjustment are the medium-variant benchmarks for 2024 and 2050.
- IMF World Economic Outlook, April 2026: the 2025 output base, income per head, and the five-year growth projection this chapter’s first path is compared against.
- ILOSTAT modelled estimates (November 2025): the starting values of terms two and three on 53 of the 54 cards. The Seychelles carries neither and is not projected here.
- The country cards: every input to Tables 35.1 and 35.2. The three paths’ targets, the working-age-share adjustment, the compute-input group and the rent premium are this chapter’s own choices and are written out in the parameter table above rather than buried.
- This chapter’s site file,
_figures/ch35/ch35_sites.csv, which is the compute-inputs branch drawn as the facilities that would have to carry it, and which feeds the data-centre and AI-power layer of the Growth Pole Map. The rule for a row is narrow and deliberate: a hyperscale or AI campus, a hyperscaler cloud region, or a colocation campus whose operator publishes a critical IT load in megawatts, and in every case a facility this chapter names through Chapters 14 and 17 or that a named operator’s own announcement places. A site without a source is not a row, and a capacity no operator publishes is left empty rather than guessed. Nine facilities meet that rule today, four of them with a published megawatt figure and six of the nine in South Africa, which is a finding about where frontier compute sits on this continent rather than a gap in the file.
Further reading
- Anton Korinek and Joseph E. Stiglitz, “Artificial Intelligence, Globalization, and Strategies for Economic Development” (2021), for what a development strategy becomes when intelligence is capital, and Daron Acemoglu, “The Simple Macroeconomics of AI” (2025), for the sober near-term counterweight.
- Adrian Raftery, Leontine Alkema and Patrick Gerland, “Bayesian Population Projections for the United Nations” (2014), for what is actually inside the projections this chapter compounds.
- Quamrul Ashraf, David Weil and Joshua Wilde, “The Effect of Fertility Reduction on Economic Growth” (2013), for a priced estimate of the fertility modifier.
- Allan Timmermann, “An Evaluation of the World Economic Outlook Forecasts” (2007), and Zidong An, João Tovar Jalles and Prakash Loungani, “How Well Do Economists Forecast Recessions?” (2018), for the record of the institution whose forecasts sit on every card.
- Morten Jerven, Poor Numbers (2013) and Africa: Why Economists Get It Wrong (2015), for why the outturns against which forecasts are scored are themselves estimates.
- Daniel Hoornweg and Kevin Pope, “Population Predictions for the World’s Largest Cities in the 21st Century” (2017), for the urban version of a century-length projection, and the Institute for Security Studies’ African Futures programme, for the continent’s own long-run modelling effort and a useful contrast with an exercise that deliberately has no model in it.