30. The Copperbelt and the Lobito/TAZARA Corridors
Pole type: resource corridor.
The arc of ore that runs from Kolwezi through Lubumbashi, across the Kasumbalesa border post and on to Ndola and Kitwe produced about 4.3 million tonnes of copper in 2025, more than any country in the world except Chile, and, on its Congolese side, about 73 percent of the world’s mined cobalt. It sits roughly 2,000 kilometres from the Atlantic and roughly 2,000 kilometres from the Indian Ocean, and until 2024 almost none of it left by rail.
Learning Objectives
After reading this chapter, you should be able to:
- Read the identity for the four countries of the Copperbelt pole and explain the pattern that defines a resource corridor: a fast first term, a second term flat or negative, and a third term set by a sector that employs almost nobody.
- Set out the pole’s balance sheet in the book’s terms, and say what Zambia’s default and Angola’s oil-collateralised borrowing each did to the sovereign’s room for manoeuvre.
- Run a growth diagnostic on a corridor and defend the claim that two constraints bind here: one on how much ore reaches a ship, and a separate one on how much of the proceeds stays in the region.
- Describe the political settlements of Zambia, the Democratic Republic of the Congo and Angola in the vocabulary of Chapter 5, and say what would distinguish a bargain on growth from a change in which rent the elite collects.
- State what the numbers here can and cannot bear, given a Congolese census taken in 1984 and an Angolan census taken in 2024 whose result does not match the population series this book runs on.
Prior work: the Kasumbalesa border research, the four-corridor comparison and the hegemon-and-hinterland framing used here are set out in the companion volume, The New Regional Economics, chapter 14 (Wilse-Samson, 2026). This chapter cites them rather than repeating them, and adds what that volume does not have: the identity, the balance sheet and the diagnostic.
Chapter 1 set out two worlds. In the labour-abundant one, growth is made of workers. In the labour-redundant one, the frontier of production is a stock of machines and a country’s income depends less on how many hands it has than on what it owns that the machines need, and Chapter 1 listed four African holdings for that world: people, land, sun, and the minerals the machines are made of. This is the chapter about the minerals, and it is deliberately narrow. Chapter 13 owns the mineral economics; this chapter owns the corridor and the pole, and its question is the sharper one for a book about growth. The ore is here, the world wants it, and the region on top of it has spent sixty years failing to convert that into income.
The pole is four countries and two oceans. The Copperbelt proper straddles one border, Lualaba and Haut-Katanga on the Congolese side, Zambia’s Copperbelt and North-Western provinces on the other. Its Atlantic outlet runs west across Angola on the old Benguela line to Lobito, with Luanda at the far end; Chapter 12 carries Luanda’s oil, this chapter its west end. Its Indian Ocean outlet runs east across Tanzania on the TAZARA line to Dar es Salaam, and Tanzania’s own pole is Chapter 26, so here it is the eastern gate.
1. The pole in the identity
Chapter 1 set out the identity the book runs on: in growth rates, GDP growth is approximately the sum of output-per-worker growth, growth in the employment-to-working-age ratio and growth in the working-age population. The four countries hold 237.0 million people, 15.7 percent of the continent’s, and produce $350.8 billion, 11.2 percent of its output; by 2050 they are projected to hold 460.2 million.
| Country | Term one: working-age population | Term two: employment ratio | Term three: output per worker | Implied growth | Observed growth | Gap | Wage employment (percent) | Non-agricultural employment (percent) | Confidence |
|---|---|---|---|---|---|---|---|---|---|
| Angola | 3.53 | 0.09 | -3.12 | 0.49 | 0.64 | -0.14 | 24.1 | 47.9 | medium |
| Democratic Republic of the Congo | 3.38 | -0.18 | 1.81 | 5.00 | 4.83 | 0.17 | 14.7 | 41.1 | low |
| Zambia | 3.70 | 0.59 | -0.93 | 3.36 | 3.32 | 0.04 | 27.9 | 44.7 | medium |
| Tanzania | 3.55 | 0.03 | 1.92 | 5.50 | 5.83 | -0.33 | 14.5 | 34.9 | medium |
Table 30.1. Annual growth rates in percentage points over 2014 to 2024, except the last three columns, which are shares of employment and a flag. The gap is implied growth less observed. Term one is the working-age population aged 15 to 64; term two is modelled employment aged 15 and over divided by that population; term three is the residual output-per-worker series. Sources: UN World Population Prospects 2024, ILOSTAT modelled estimates (November 2025), and the IMF World Economic Outlook (April 2026), via the country cards.
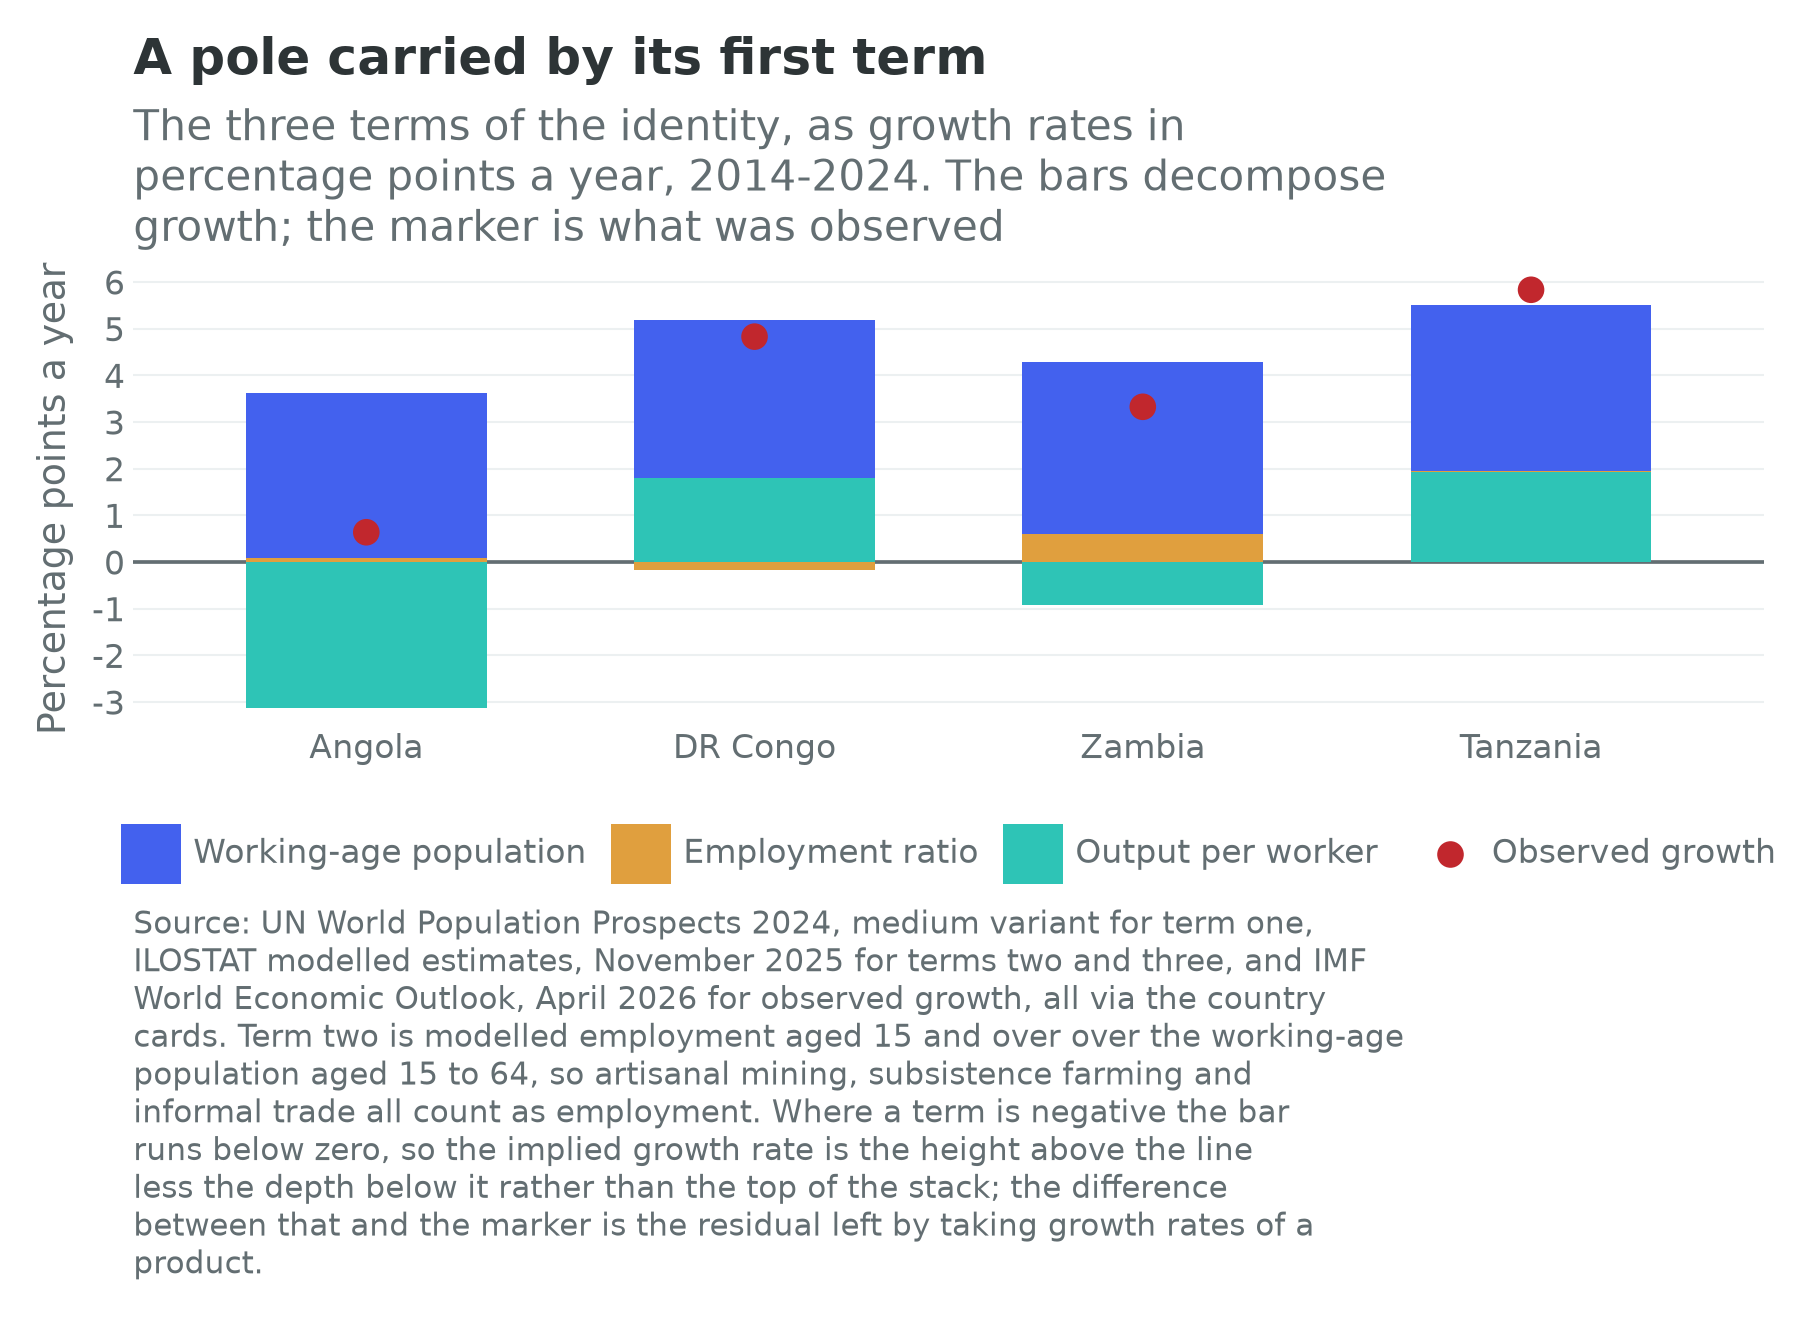
Term one is the fastest of any pole in this book. All four sit between 3.38 and 3.70 percent a year, every one above the continental median of 2.89 percent across the 54 cards, and the Congolese card carries the doubler note, running from 109.3 million people today to 218.2 million in 2050 on a median age of 15.8 years. This is the endowment, and it arrives whatever anybody does.
Term two is flat, and in one case negative. Tanzania’s employment ratio grew at 0.03 percent a year and Angola’s at 0.09, and the Congolese ratio fell at 0.18 percent. Zambia is the exception at 0.59 percent, and it is instructive rather than encouraging, because it sits beside output per worker of minus 0.93 percent: more Zambians of working age were at work at the end of the decade, and the average one produced less. The overlays say what that term is made of. Wage employment is 14.5 percent of Tanzanian employment and 14.7 percent of Congolese, among the lowest on the continent, against 24.1 percent in Angola and 27.9 percent in Zambia, and informal employment runs from 82.7 percent in Zambia to 97.3 percent in the Democratic Republic of the Congo. The modelled series counts an artisanal digger in a Kolwezi pit as employed, and so it should, since he works longer hours than most people reading this. What it cannot do is tell a payroll from a hole in the ground.
Term three splits the pole in two, and neither half is the mining. The Democratic Republic of the Congo and Tanzania post output-per-worker growth of 1.81 and 1.92 percent a year; Zambia posts minus 0.93 and Angola minus 3.12, the fourth worst of the 53 cards carrying the series. Angola’s decade shows what a commodity price does to a measured productivity series: the whole distance between a first term of 3.53 percent and observed growth of 0.64 percent is output per worker falling for ten years. Nothing about the Angolan worker changed. The price of what the country sells did.
Where the transformation database reaches, over 2008 to 2018, term three splits into the part from firms getting better within a sector and the part from workers moving between sectors, and it reaches two of these four. Zambia records within-sector growth of minus 1.79 percent a year against between-sector growth of plus 2.87. That is the chapter’s central fact in one line: Zambian workers moved on net into sectors with higher measured output per head, and the sectors themselves got worse, by more than the move was worth. Tanzania is the healthier mirror image, at 2.79 within and 1.67 between. For Angola and the Democratic Republic of the Congo the split is not on the cards, because the database does not cover them, and this chapter will not guess at it: two of the pole’s four rows in the structural-change story are blank, and one is the country holding the world’s cobalt. The gap column is the honesty check, and implied and observed growth differ by at most a third of a point across the four. The decomposition holds. What it decomposes is a set of modelled series resting, in one case, on a census taken in 1984.
Why a resource corridor produces this shape, and what it is worth in two worlds
The pattern is a mechanism, not an accident of the decade. A large modern mine is a capital stock with a small crew attached: its output per worker is enormous, so a boom lifts the national average of term three without lifting anybody’s employment, and it is bounded by the ore body and the price, so the same average falls when the price does, again without anybody being hired or fired. Term two is untouched in both directions, because the mine was never going to absorb a cohort growing at 3.5 percent a year, and the sectors that could absorb it are the ones whose productivity the Zambian within-sector figure says has been falling. This is the dual-firm economy of Diao, Ellis, McMillan and Rodrik (2021) in its purest form, and here the productive half is a fenced compound with its own power, water, road and, increasingly, railway.
In the labour-abundant world that is a problem with a known shape: the ore pays for a state, the state builds the schools and the grid, and the cohort finds work in the towns the corridor makes possible. In the labour-redundant world this is the one pole in Part VI whose position improves rather than deteriorates, because if the frontier becomes a stock of machines whose binding inputs are electricity and metal, the Copperbelt holds an asset the century needs in a concentration nobody else can match. The counter-case is the whole of this chapter: holding the chokepoint on a battery metal has not made anyone in Kolwezi rich, and nothing converts an endowment into an income without institutions doing the converting. Chapter 35 takes the compute-inputs case as the upside branch of its labour-redundant scenario, and this chapter is why that branch is drawn with a dotted line.
2. The pole on the balance sheet
The second lens is the balance sheet: what comes in, what goes out, and who owns the assets.
| Country | External debt stock (\(bn) | Multilateral (\)bn) | Official bilateral (\(bn) | Bonds (\)bn) | Other private (\(bn) | Chinese loan commitments, 2000 to 2024 (\)bn) | |||
|---|---|---|---|---|---|---|
| Angola | 58.7 | 6.2 | 4.1 | 11.0 | 35.8 | 49.2 |
| Democratic Republic of the Congo | 12.5 | 4.1 | 3.8 | none recorded | 0.1 | 3.4 |
| Zambia | 28.1 | 4.5 | 4.8 | 2.7 | 6.1 | 9.5 |
| Tanzania | 36.3 | 16.4 | 3.6 | none recorded | 4.3 | 2.4 |
Table 30.2. Sources: World Bank International Debt Statistics (2025 release) for the stock and the creditor lines; the Boston University Chinese Loans to Africa database (2000 to 2024 release) for the commitment column, which is a cumulative flow and not a stock. The creditor columns are publicly guaranteed long-term debt and do not add to the stock, which also carries short-term debt, IMF credit and private non-guaranteed borrowing.
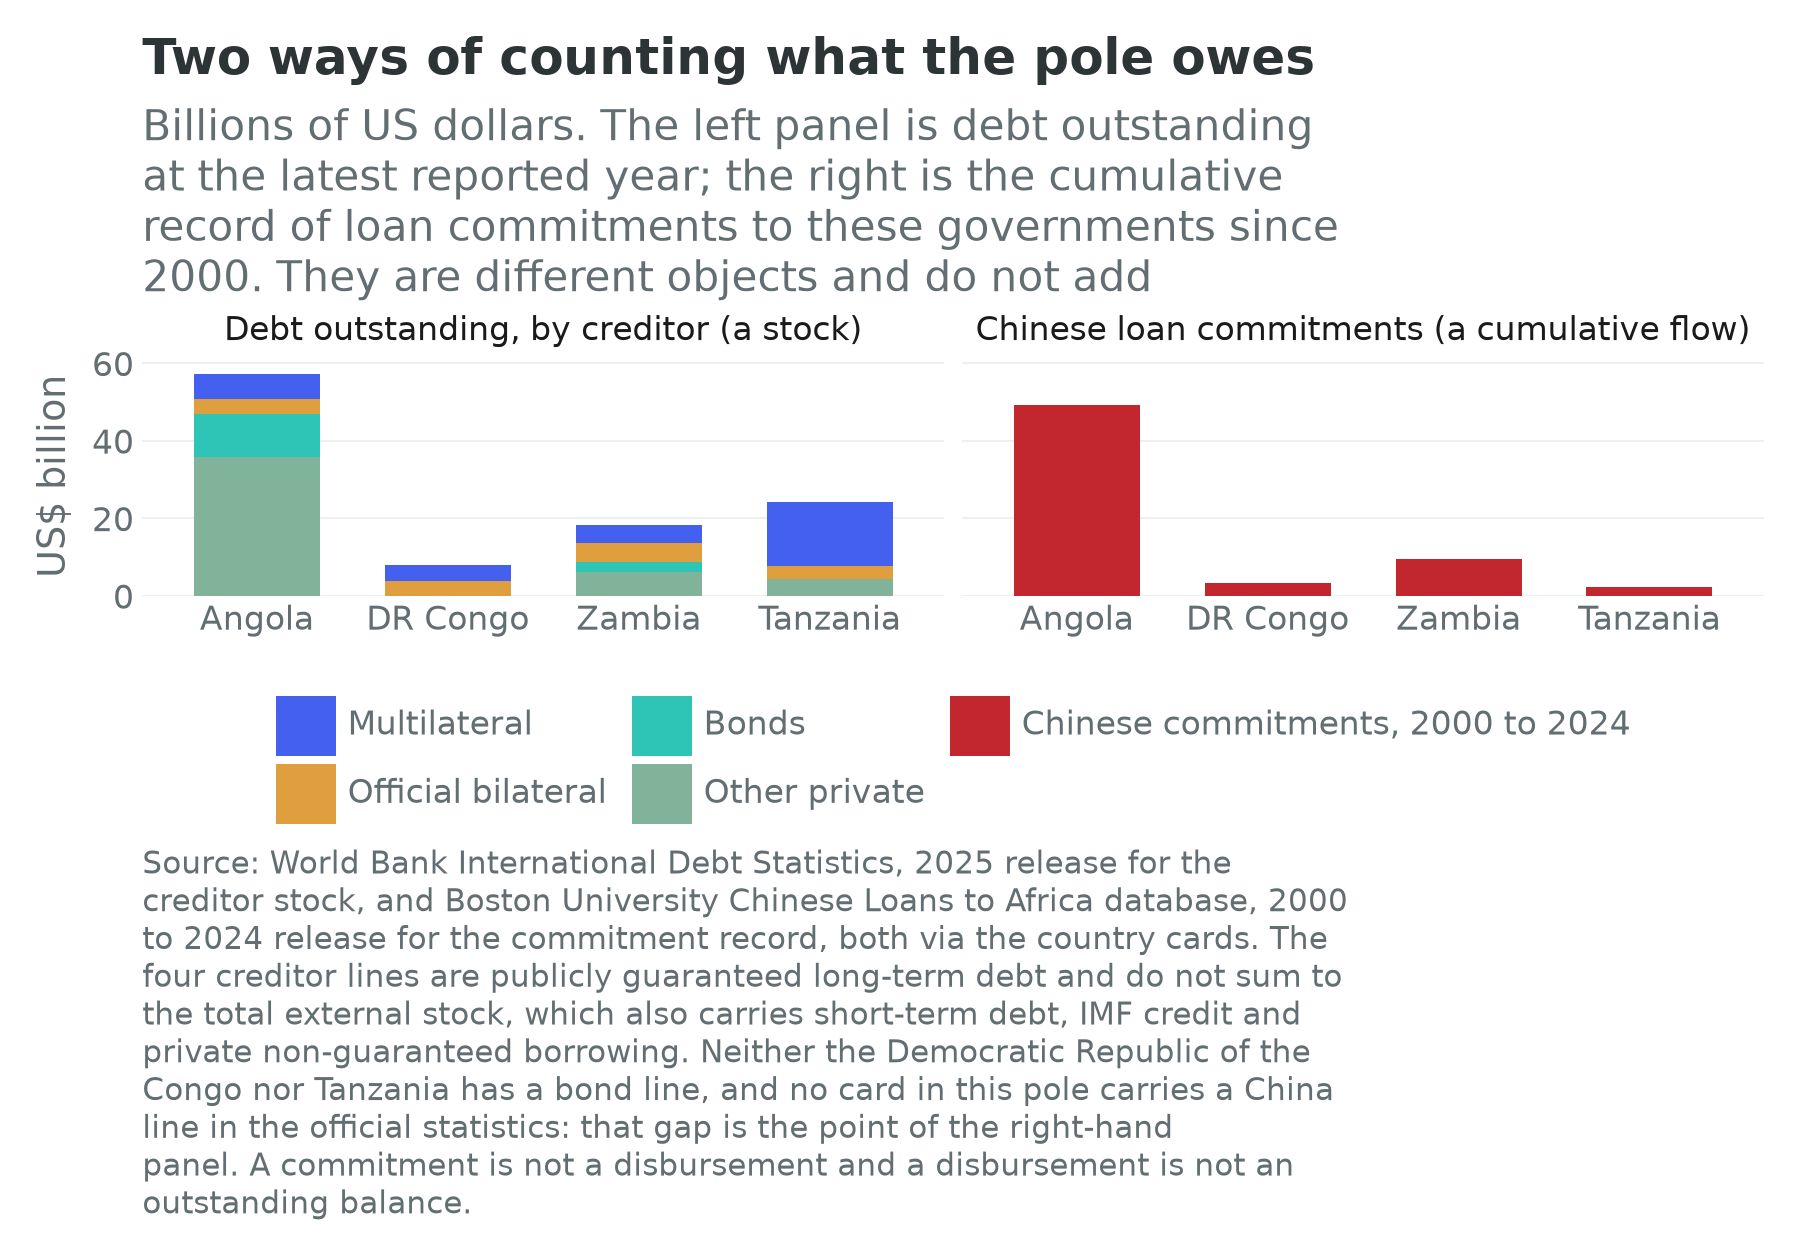
Four things stand out, and each is a different way of owing money.
Angola has the largest external debt in the pole and by far the largest recorded Chinese lending relationship on the continent: $49.2 billion of cumulative commitments between 2000 and 2024, more than a quarter of the $176.3 billion the database records for the 49 African governments that appear on the cards at all. The official statistics put $14.4 billion of that still outstanding, the largest Chinese claim on any African card and 31 percent of Angola’s publicly guaranteed external debt. Set that beside the columns around it and the structure of the relationship is visible in a single row: the entire official bilateral column is $4.1 billion and $35.8 billion sits under private credit, because much of the borrowing was contracted through the state oil company and secured on oil deliveries rather than through the ministry of finance. The China line is three and a half times the whole bilateral column, which would be impossible if the two were slices of one pie; they are not, and Chapter 21 sets out why. Angola also owes the twenty-two members of the Paris Club $11.5 billion, the second-largest such claim on the continent, so this is a balance sheet with two large official creditors rather than one. And $41.4 billion of principal and interest falls due across 2026 to 2030, 29.2 percent of a year’s output and the third-largest five-year bill on the continent, which is the number that decides how much room the pole’s diversification plans actually have. Chapter 32 works the reconciliation between the two ledgers; the point here is that the outstanding balance and the twenty-five-year signing record are different objects, and the debt tracker on this site draws both.
Oil-collateralised borrowing is the sharpest illustration in this book of what a resource-backed loan does. Repayment is made in barrels rather than in kwanza, so the loan is senior to everything else the state wants to do and immune to the exchange rate, and a price fall cuts the government’s revenue and raises the number of barrels the creditor takes at the same moment. The stock has been coming down: oil-backed loans to China stood at $10.1 billion at the end of 2024 and $8.9 billion at the end of June 2025, and the government projected $7.5 billion to $8.0 billion by the end of that year, having stopped contracting new oil-backed facilities in 2017.
The Democratic Republic of the Congo carries a debt stock of $12.5 billion against output of $92.8 billion, a ratio of 13.4 percent. On its face that is the healthiest sovereign balance sheet in the pole; it is better read as a symptom. A country that exports 3.4 million tonnes of copper a year and has borrowed almost nothing against it is a country whose state was not the counterparty to the mining boom: the mines were financed on Canadian, Chinese, Swiss and Kazakh balance sheets and the returns accrue there, while the state’s participation is a free-carried equity stake and a royalty. The exception is Sicomines. The 2008 agreement paired a joint venture valued at about $6.2 billion with a promise of $3 billion of infrastructure to be built out of the mine’s proceeds; in February 2023 the state auditor reported that $822 million had been delivered in fourteen years (IGF, 2023); and a revision in March 2024 raised the commitment to up to $7 billion, at $324 million a year through 2040, conditional on the copper price staying above $8,000 a tonne. That last clause is the minerals-for-infrastructure model in one sentence: the country’s roads are an option on the copper price, and the option is written by the counterparty.
Zambia is the pole’s completed sovereign-debt cycle. It stopped paying a Eurobond coupon on 13 November 2020, the first African sovereign to default in the pandemic, and the restructuring took three and a half years. The bondholder agreement of March 2024 restructured about $3 billion of bonds into two amortising instruments, one paying more if the country’s capacity to pay improves, with a nominal haircut of about 21.6 percent including past-due interest, roughly $840 million of claims forgone and about $2.5 billion of cash-flow relief inside the programme period. It was the first sovereign to take a Eurobond restructuring through the Group of Twenty’s Common Framework alongside its official creditors, the largest of them China. The card’s stock of $28.1 billion against output of $28.9 billion, a ratio of 97.4 percent, is the post-restructuring position, and it is why a five-year growth forecast of 4.93 percent a year can be written at all. Chapter 21 works the mechanics; what belongs here is the timing, since Zambia’s identity terms were posted through the default and the adjustment.
Tanzania is the counterexample: nearly half its recorded stock is multilateral, at $16.4 billion of $36.3 billion, it has no bond line, and its cumulative Chinese commitments of $2.4 billion are the smallest in the pole by a wide margin. Concessional borrowing and slower headlines are what the least distressed balance sheet in the pole looks like.
What the pole owns is the question the rest of the chapter turns on. The mines are held by Ivanhoe and Zijin at Kamoa, China Molybdenum at Tenke Fungurume and Kisanfu, Glencore at Mutanda and Kamoto, First Quantum at Kansanshi and Sentinel, an Abu Dhabi holding company at Mopani and Vedanta at Konkola; the Atlantic railway by a Swiss commodity trader, a Portuguese contractor and a Belgian rail operator; the Indian Ocean railway, for the next thirty years, by a Chinese state contractor. Gécamines and ZCCM Investments Holdings hold minority stakes in most of the mines. That list is not a complaint. It is the balance sheet, and section 3 argues that it is also half the diagnosis.
3. The binding constraint
The growth-diagnostics method of Hausmann, Rodrik and Velasco (2005) asks one disciplined question: of all the things wrong with an economy, which one, fixed first, would raise private investment most? It proceeds by elimination down a tree, and its virtue is that it forbids the list-of-everything that development strategies usually become.
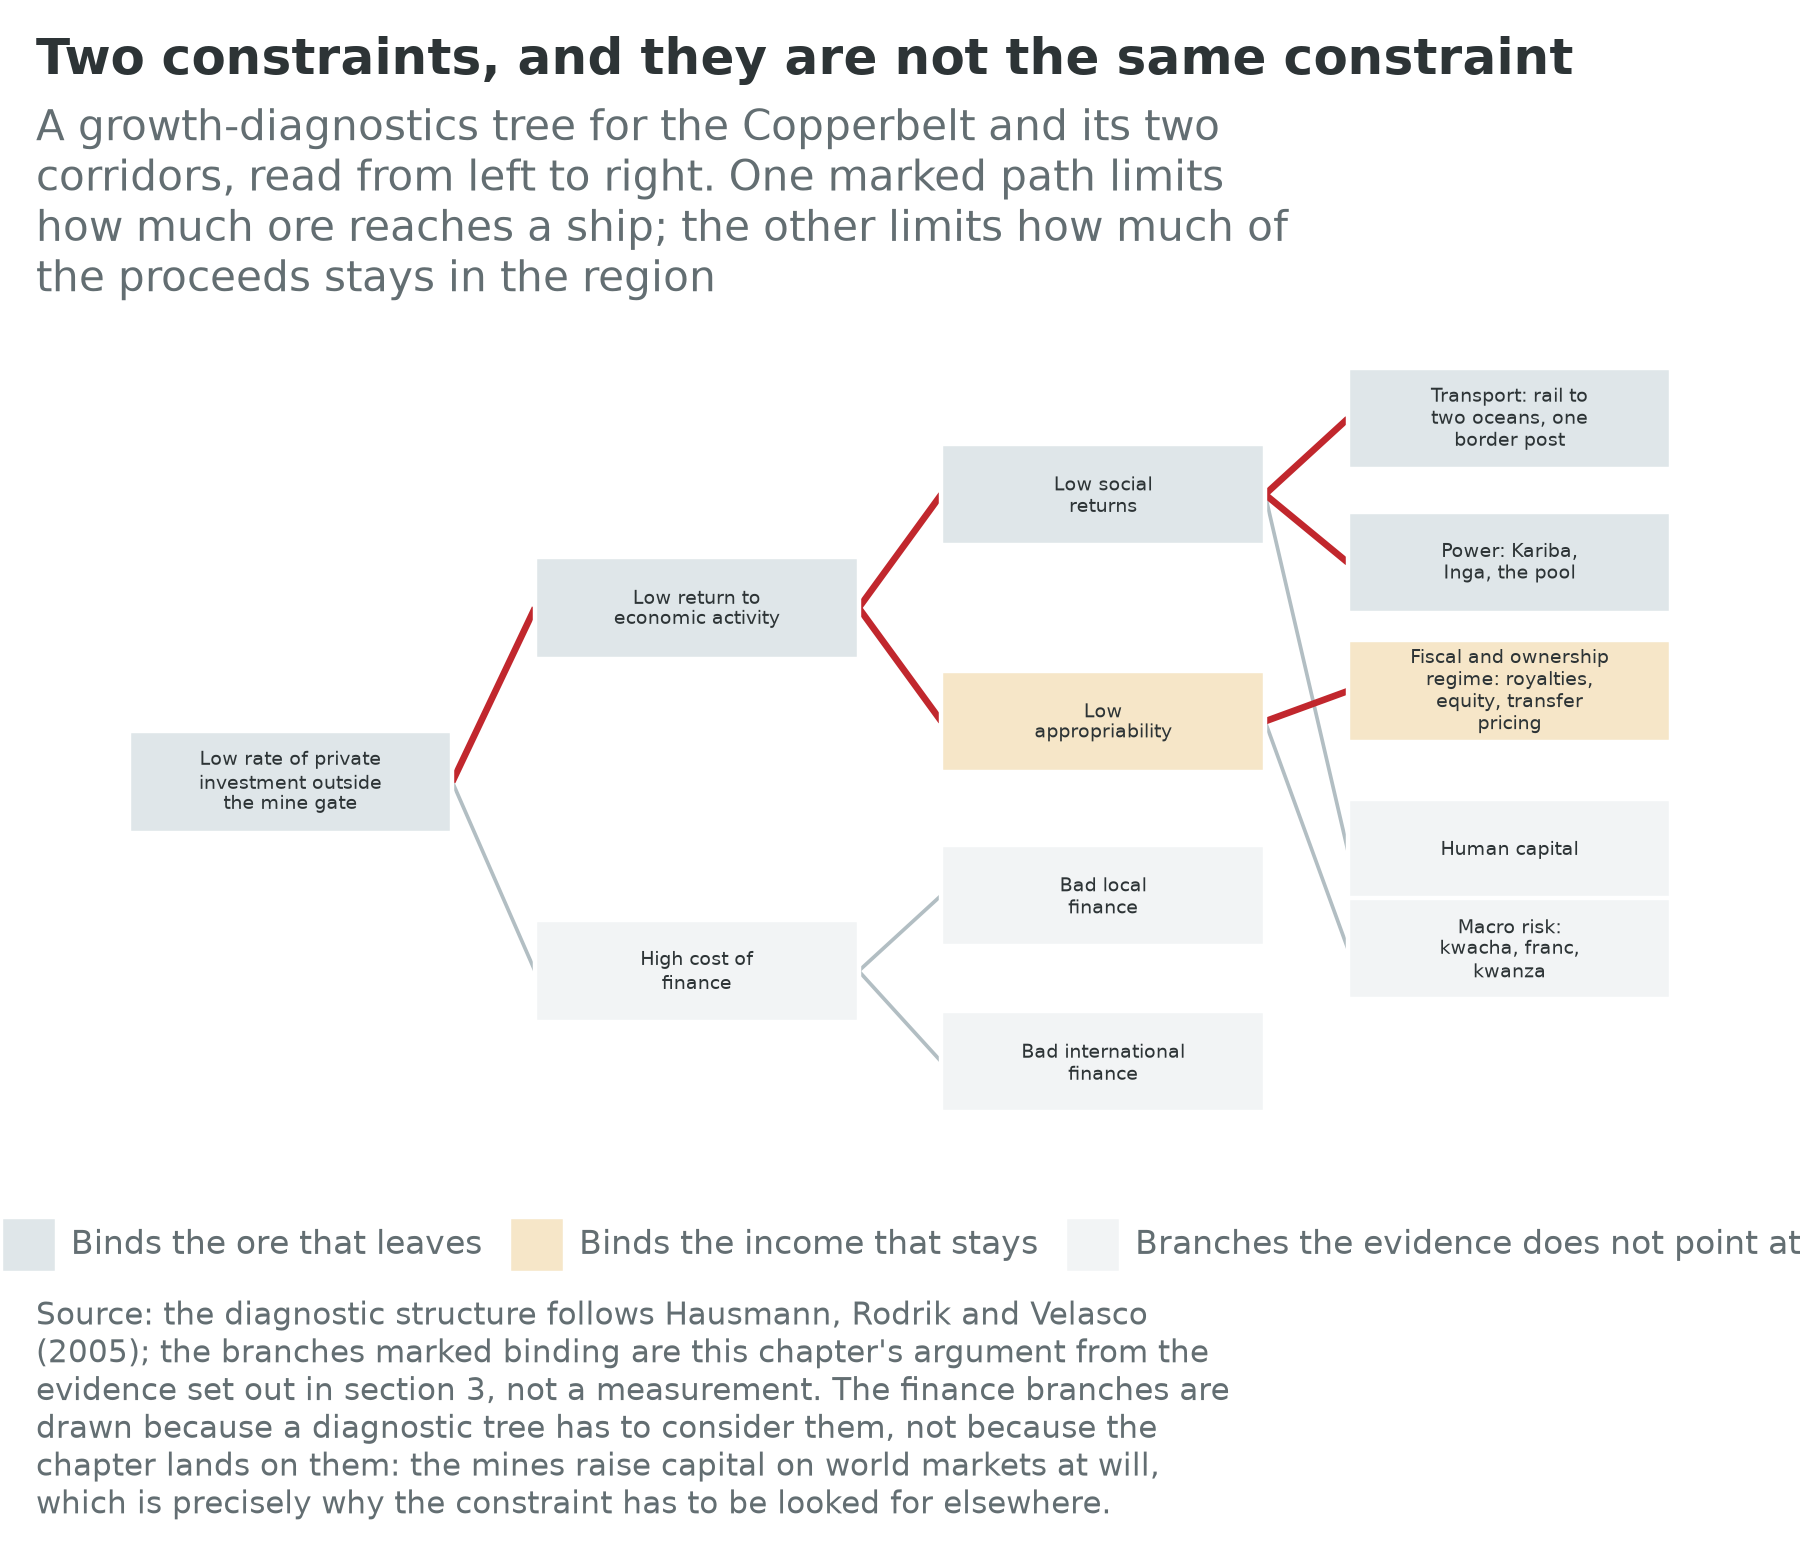
Start with the cost of finance, which here can be eliminated with unusual confidence. The mining industry raises capital on world markets at will: a single expansion at one Zambian mine cost $1.25 billion of private money, and the largest new copper mine opened anywhere this century was financed by a Canadian listed company and a Chinese one without a cent of concessional support. If the price of capital were binding, the region would be full of high-return projects that cannot raise money; it is full of high-return projects that can raise money and cannot move their output. Human capital binds later rather than first: youth not in employment, education or training runs at 31.4 percent in the Democratic Republic of the Congo and 26.7 percent in Zambia against 12.8 percent in Tanzania, and Chapter 20 takes that seriously, but the diagnostic test is whether returns to skill are being bid up, and the observable pattern is an industry that imports the few specialists it cannot find locally and fills everything else without difficulty.
Transport is the first thing that does. Until 2024 essentially all Copperbelt copper left by road, south through Zambia and Zimbabwe to Durban or east to Dar es Salaam, over 2,000 kilometres and more, at unit costs several times what a railway charges. Two railways existed and neither carried the traffic: TAZARA was moving about 500,000 tonnes a year against a design capacity of 5 million, and the Benguela line had been out of service for a generation. The single land border in the middle of the ore body, at Kasumbalesa, produced queues in January 2025 that ran to 56 kilometres and stranded more than 1,500 trucks (Wilse-Samson, 2026). A mine that pays a multiple of the rail tariff to truck its concentrate, then waits days at a post twenty kilometres from the pit, is paying a shadow price on transport that no accounting can hide.
Power is the second. Zambia generates most of its electricity from hydropower, and in 2024 the worst drought in four decades emptied Lake Kariba: usable live storage stood at 8.7 percent on 26 August 2024 against 26 percent a year earlier, generation at the 1,080 MW Kariba North station fell to about 215 MW, and the plant was shut on 14 September 2024. Mines run three shifts or they do not run. What the industry did next is the evidence: it bought imported power well above the regulated tariff, contracted for new thermal capacity, and, in the most striking case, paid to refurbish somebody else’s hydroelectric turbine.
Those two are one constraint with two faces, and they explain the physical half of the problem. They do not explain why sixty years of mining have produced no income, and here the chapter parts company with the standard infrastructure diagnosis.
The second constraint is appropriability, and it is about who keeps the return. The tree’s right-hand branch asks whether investors expect to keep what they earn. Here the answer is yes, emphatically, and the problem is the mirror image: those who keep what is earned are not resident. The Congolese state’s participation in Kamoa Copper is a 20 percent stake it did not pay for, alongside a royalty that the mining code signed on 9 March 2018 raised from 2 percent to 10 percent on cobalt and other strategic minerals, against 3.5 percent for ordinary metals, a real fiscal gain that remains a small share of the gross. Zambia’s royalty and tax regime has been changed repeatedly in twenty years, in both directions, which is a rational response to a bad bargain and also the most reliable way to depress investment in a business with a thirty-year payback. Transfer pricing in an industry where the miner, the smelter, the trader and sometimes the railway are the same corporate group is not an accusation but a description of the structure, and Chapter 13 gives it the treatment it deserves.
A diagnostic that names two constraints owes an ordering. This one is: transport and power bind the quantity, the fiscal and ownership regime binds the share, and fixing either alone disappoints predictably. Fix transport and not the regime, and the region exports more ore at a lower cost per tonne, raising the profits of the mine and the trader and leaving term two where Table 30.1 found it. Fix the regime and not transport, and the state takes a larger share of a volume that cannot grow. That is testable: if transport binds, the Atlantic railway’s reopening should show up first in the mines’ cost per tonne and only second in volume; if appropriability binds the income, a decade of rising volumes on a working corridor should still leave a flat second term and flat non-mining productivity, and if it does not, this chapter is wrong. The next ten years on this corridor are the experiment the last sixty did not run.
4. The political settlement
Chapter 5 supplies the vocabulary. Khan (2010) argues that institutions work only when they fit the underlying distribution of organizational power. Pritchett, Sen and Werker (2018) sort economies by whether deals are open or closed to newcomers and ordered or disordered in enforcement. Dercon (2022) asks whether the elite has bet on growth or on dividing what exists. A resource corridor is the hardest case for that question, because the rent arrives whether or not anybody bets on anything, and a settlement financed by a rent looks like a development bargain for as long as the price holds.
Zambia has the pole’s most competitive politics and its least stable policy. Power has changed hands at the ballot box three times since 1991, most recently in August 2021, when the opposition candidate won at his sixth attempt and the incumbent conceded. That is a real achievement and it is also, in Khan’s terms, competitive clientelism: two broad coalitions, each with a patronage network to pay, in a country where the thing available to pay it with is copper. The consequence shows in a mining tax regime rewritten by successive administrations and in two decades of dispute over the ownership of Mopani and Konkola. Dercon’s test gives a mixed answer. For the bargain: the government took the political cost of a default and a long restructuring rather than defending an unpayable position, settled the two ownership disputes that had frozen half the Copperbelt, and published a mining strategy whose central number is a production target. Against: that target, 3 million tonnes of copper a year by 2031 from 890,346 tonnes in 2025, is an aspiration rather than a plan, and a government reaching for it is betting once again on the rent. The incumbent was returned in the general election of August 2026 on that record, which extends the experiment without settling it.
The Democratic Republic of the Congo is where Khan’s framework earns its keep. The formal settlement is a presidential system with a mining code, a state mining company and a regulator. The effective distribution of organizational power is something else: a capital 2,000 kilometres from the ore, provincial authorities with their own revenue interests, armed groups in the east whose relationship to minerals is section 8’s subject, and an artisanal sector employing very large numbers of people whose output enters the same supply chain as the industrial mines’ without entering the same tax system. In Pritchett, Sen and Werker’s terms this is a deals environment, and the deals are closed and disordered. Two moves nonetheless deserve to be taken seriously as exercises of state power over the rent. The mining code of March 2018 raised royalties, designated cobalt strategic, and passed over the objections of every major operator in the country. The cobalt export suspension of 22 February 2025, extended twice and replaced from 16 October 2025 by a quota system allowing 18,125 tonnes for the remainder of 2025 and 96,600 tonnes a year for 2026 and 2027, was an attempt to use a chokepoint the way an oil exporter uses a quota, and it moved the world price, which is the test of whether a chokepoint is real. Whether it moves Congolese income turns on who owns the tonnes inside the quota, which is mostly the same groups as before. This is a state that has discovered it holds a lever and has not decided what the lever is for.
Angola is the clearest case of a settlement changing its mind about which rent to live on. The dos Santos period ran for 38 years on an oil economy financed by oil-collateralised Chinese lending, with the presidential family occupying the commanding heights of the private sector. The succession of September 2017 was followed by a real reallocation: the former president’s daughter was removed from the state oil company, the Supreme Court ordered her assets seized in December 2022, prosecutors charged her in January 2024, and the ruling party’s vote share fell sharply in the election of August 2022. Meanwhile production fell to about 1.03 million barrels a day in 2024, roughly half the 2008 peak of 1.9 million, and Angola left OPEC with effect from 1 January 2024 in a dispute over a quota it could no longer fill. The Lobito corridor is what the settlement has decided to become instead, and this book should be careful how much credit it gives that. A transit corridor is a rent: the country earns a fee for letting somebody else’s copper cross it, much as it earned a fee for letting somebody else’s drilling company extract its oil. It is a better rent, because it is denominated in a commodity the century will probably want more of rather than less, and because it requires a functioning railway and therefore a functioning administration. It is still a rent, and betting on a better rent is not the same as betting on growth, though it is not nothing.
Tanzania appears only at the eastern gate, and Chapter 26 carries its settlement. The point that belongs here is that its resource nationalism of the late 2010s was conducted by a state with a far stronger central administration than either Copperbelt neighbour, and ended in a settlement with the largest miner rather than a collapse in investment. The same instrument, in a different settlement, gives a different result.
5. Geography and infrastructure
The ore lies almost exactly in the centre of the southern half of the continent, roughly 2,000 kilometres from tidewater in every direction, on a plateau with no navigable river to the sea. Every other pole in Part VI is a coast, or a corridor to a coast its own government controls. This one is a landlocked ore body whose exports must cross at least one and usually two international borders to reach a ship.
The Lobito corridor is the Atlantic route and the reason this chapter exists now rather than a decade ago. The Benguela railway runs about 1,300 kilometres from the port of Lobito to Luau on the Congolese border and thence into Katanga. It was built by the Portuguese, destroyed by the Angolan civil war, rebuilt with Chinese finance in the 2010s, and then sat largely idle for want of an operator and traffic. In November 2022 Angola awarded a 30-year concession to the Lobito Atlantic Railway consortium, held by Trafigura and Mota-Engil at 49.5 percent each and the Belgian operator Vecturis at 1 percent, and debt financing of $753 million was raised from the United States development finance corporation and the Development Bank of Southern Africa. The first international copper train from the Democratic Republic of the Congo ran in June 2026, and volumes in the first full year exceeded 200,000 tonnes against a target of 4.6 million tonnes at full capacity. On the Congolese side the corresponding link is the old line from Kolwezi to Dilolo on the Angolan frontier, whose rehabilitation the Congolese government approved as a partnership with the same Portuguese contractor; until that section works, the Atlantic route is a railway with a road at one end. Two features matter more than the tonnage. The financing is new in this book, an American development finance institution and a European connectivity programme lending against an African railway concession in explicit competition with Chinese infrastructure lending, which Chapter 33 takes up. And the concessionaire’s largest shareholder is a commodity trader that also buys and ships the cargo, which raises the third-party access question Chapter 25 asked about South African freight rail from the opposite direction.
The Angolan line reaches the Congolese Copperbelt but not the Zambian one. Closing that gap is the Zambia-Lobito greenfield project: about 800 kilometres of new railway from Luacano in eastern Angola to Chingola in Zambia’s Copperbelt, with the Africa Finance Corporation as lead developer under concession agreements signed with both governments in 2024 and a $2 million grant from the United States Trade and Development Agency for the environmental and social studies (Smith, 2024). The corporation now targets financial close at the end of 2027 and completion in 2030, has not disclosed a cost, and has signed cargo agreements for 1 million tonnes a year, half the minimum it says the line needs (Engineering News, 2026). Treat that as the plan, not the outcome: it is the least advanced project in this chapter.
The TAZARA corridor is the Indian Ocean route and the oldest piece of Chinese infrastructure diplomacy on the continent. The line runs 1,860 kilometres from Kapiri Mposhi to Dar es Salaam, was built between 1970 and 1975 with a $401 million Chinese interest-free loan, and was designed to carry 5 million tonnes a year and free landlocked Zambia from dependence on Rhodesian and South African routes. It has never approached that: freight peaked at 1.2 million tonnes in 1986, fell through the 1990s as the southern routes reopened, bottomed at 88,000 tonnes in 2014/15, and now runs at about 500,000 tonnes. In September 2025, a year after a memorandum signed by the three heads of state, Zambia, Tanzania and China concluded an agreement under which China Civil Engineering Construction Corporation will invest $1.4 billion, $1.0 billion in track and $0.4 billion in 32 locomotives and 762 wagons, and operate the freight business for 30 years, three of rehabilitation then 27 of commercial operation, with the passenger service left to the two states and a target of 2.4 million tonnes a year (TAZARA and China Civil Engineering Construction Corporation, 2025).
The symmetry with Lobito is almost too neat. Two railways to two oceans, one rebuilt with American and European money under a European trading consortium, one with Chinese money under a Chinese state contractor, both concessioned for thirty years, both carrying the same ore. This is not a new scramble in the nineteenth-century sense, because nobody is claiming sovereignty and both deals were competitively sought by the governments concerned. It is a competition to own the logistics of the compute inputs, and the Copperbelt is the party being competed for. A landlocked region with two outlets bargains from a better position than one with none, and that restored outside option is the best single argument for the corridor revival.
The border is the third piece of infrastructure and the cheapest to fix. Kasumbalesa is the only major crossing between the two halves of one ore body, and the congestion of January 2025 was triggered by a change in the electronic clearance system on the Congolese side, then eased by extending opening hours and agreeing a clearance rate. Nothing in that sentence required capital. The companion volume’s four-corridor table shows what the reformed Northern Corridor achieved with one-stop border posts, electronic cargo tracking and a single customs territory (Wilse-Samson, 2026), and the reason it belongs beside two railway megaprojects is arithmetical: a day saved at a border post is worth more per dollar spent than anything else in this section.
Power is the last network and it constrains the mines directly. Kariba, on the Zambezi, is shared with Zimbabwe and is the swing factor in Zambian supply. Inga, on the Congo river below Kinshasa, is the largest unexploited hydroelectric site in the world and the most persistently disappointing: the existing stations run far below nameplate, Inga III has been discussed for two decades without a financing close, and what has actually happened lately is the refurbishment of a single 178 MW turbine at Inga II, paid for by a mining company that needed the power. Above both sits the Southern African Power Pool, which lets both Copperbelt countries import when the water is low and which, as Chapter 25 noted, transmits a shortage as efficiently as it transmits electricity. The Copperbelt’s electricity comes from rivers, in a region where the rivers are becoming less reliable, to serve a load growing at the rate the mine expansions imply.
6. Megaprojects and cities
A caution first, the same one Chapter 24 gave. The cards carry a largest agglomeration and not a corridor city, so the figures they hold here are Kinshasa at 11.9 million, Luanda at 10.1, Dar es Salaam at 6.9 and Lusaka at 3.2, and not Lubumbashi, Kolwezi, Kitwe or Ndola, which are the towns this chapter is actually about. Every population figure in this chapter is therefore national and from the UN projections unless labelled otherwise.
The Copperbelt’s urban system is unlike any other in this book. It is not a primate-city region but a string of mining towns laid out by the companies between the 1920s and the 1950s, each built around a shaft or a smelter with a company grid, water supply, housing and hospital, and each now several times the size the company planned for. Kolwezi is the cobalt capital and where the industrial and artisanal economies sit most visibly on top of one another; Lubumbashi is the Congolese Copperbelt’s commercial centre, an agglomeration usually put at around 3 million people; on the Zambian side, Kitwe and Ndola were enumerated at 661,901 and 627,503 at the 2022 census (Zambia Statistics Agency, 2023). A corridor that connects these places to a port also connects them to each other, and the cross-border urban region they would form is a more interesting economic object than any of them alone. Luanda, at the western end, is a different creature: about 8.7 million people in Luanda province at the 2024 census, in an oil economy, several hundred kilometres north of the corridor’s port, so that Angola’s growth pole and its political centre are not the same place.
The megaprojects, in order of how much has actually been built. The Kamoa-Kakula smelter, a 500,000 tonne-a-year direct-to-blister copper plant in Lualaba commissioned through 2025, is the value-addition step decades of Congolese policy has demanded and not obtained: blister copper is a product rather than an ore and a fraction of the shipping weight of concentrate, so smelting locally converts a transport problem into an electricity problem. Kansanshi S3, a $1.25 billion expansion at First Quantum’s mine in Solwezi opened on 19 August 2025, adds a 25 million tonne-a-year processing plant intended to lift the mine toward an average of about 250,000 tonnes of copper a year to 2044, from 171,000 tonnes in 2024 (Hill and Clowes, 2025; Mining Indaba, 2025). The two ownership settlements are less photogenic and matter as much: in March 2024 a 51 percent stake in Mopani Copper Mines was sold to Delta Mining, a vehicle of International Resources Holding of Abu Dhabi, for a commitment of up to $1.1 billion, with the state holding company retaining 49 percent (Baker McKenzie, 2024), and later in 2024 control of Konkola Copper Mines returned to Vedanta after a five-year legal battle, with the state holding company at about 20 percent and an announced revival plan of $1.3 billion (Ryan, 2024; Saha, 2025). Two mines that had been in dispute or care and maintenance for years went back into production. The two railways of section 5 and the Lobito port works behind them complete what is being built.
One item is on the list because it is not being built. The Democratic Republic of the Congo and Zambia have agreed to develop a joint special economic zone for electric-battery precursors, with support from the African Export-Import Bank and the UN Economic Commission for Africa, and almost nothing has happened; the companion volume’s account of the Zambian cobalt import tariff episode shows how easily two neighbours can tax each other out of a shared value chain (Wilse-Samson, 2026). Underneath all of it is the housing and services deficit of the mining towns, which Chapter 22 carries: a town built by a company for its own workforce, now holding many times that number, with a water system never properly municipalised, is the physical form of the appropriability problem in section 3.
7. Firm profiles
Kamoa Copper, Lualaba
Kamoa-Kakula is the most important new mine opened anywhere in the world this century and the clearest single illustration of this chapter. It is held 39.6 percent by Ivanhoe Mines, 39.6 percent by Zijin Mining, 20 percent by the Congolese state and 0.8 percent by Crystal River, the state’s share being free-carried, and it produced 388,838 tonnes of copper in 2025 against 437,061 tonnes in 2024, after seismic activity and water inflow forced guidance down from an original 520,000 to 580,000 tonnes (Ivanhoe Mines, 2026).
Three things make it the pole’s defining firm. The ownership structure is section 2 in miniature: a Canadian listed company, a Chinese one, and a state whose fifth of the equity it did not pay for and cannot sell. The smelter is the value-addition step the country has wanted for fifty years, built privately because it made commercial sense once the power was available. And the power is the third: faced with an unreliable grid, the company financed the refurbishment of the 178 MW turbine five at Inga II, completed in late 2025, in exchange for an initial additional 71 MW of hydroelectric supply rising toward the full unit as grid improvements allow. A private mining company rebuilding a national power station to supply itself is a binding infrastructure constraint written as a capital expenditure rather than as a complaint. It is also, quietly, a transfer: the turbine is a national asset, and copper paid for it.
Lobito Atlantic Railway
The concessionaire of the Benguela line is a joint venture of Trafigura, one of the world’s largest metals traders, Mota-Engil, a Portuguese construction group with a long history in Angola, and Vecturis, a small Belgian company that operates railways for other people. It is here because it is the pole’s most consequential firm that does not dig anything up, and because its structure poses the question the next decade will answer. A corridor is a natural monopoly: whoever runs it sets the price at which everybody else’s ore reaches the sea, and here the operator’s largest shareholder is also one of the largest buyers of that ore. The concession is the instrument meant to manage that conflict, through tariff regulation and open-access obligations, and the public record on both is thin. Chapter 25 argued that ownership rather than nationality determines whether infrastructure works; this is the case that will test whether it is the whole of the variable.
Zambeef Products, Lusaka
The third profile is a counterweight, because a chapter that profiles only mines and railways will mislead a reader about where Zambians work. Zambeef is the country’s largest vertically integrated agribusiness, from cropping and feed through poultry, beef, dairy and milling to retail. It reported revenue of about K8.1 billion, roughly $302.6 million, for the year to 30 September 2025, and employs around 7,000 people, plus outgrowers and a distribution network (Zambeef Products, 2025). The copper industry, producing many times that value, employs a workforce of a similar order of magnitude across the whole country. This is not an argument that copper is bad or that agriculture is the answer, and Chapter 11 is more careful than that. It is the arithmetic of a resource corridor: the sector that carries term three cannot carry term two, and the sectors that could carry term two are the ones whose within-sector productivity the Zambian split says has been falling.
8. What the experiments say
The corridor is thin on experiments, and the ones it has are about liquidity and about the state
This box is shorter than its equivalents in Chapters 24 and 25, and the reason is worth stating. The randomized literature is concentrated where survey infrastructure and research partnerships are strongest, which in Africa means Kenya, Ghana, Ethiopia, South Africa and Uganda. Zambia has a modest experimental literature, the Democratic Republic of the Congo a small one, Angola almost none that speaks to this chapter. Nobody has randomized anything about industrial mining employment, because you cannot randomize a mine.
Seasonal liquidity, not land or labour, limits smallholder output, and relieving it moves the local labour market. Fink, Jack and Masiye (2020) randomly offered small seasonal loans, in maize or in cash, to smallholder households in eastern Zambia. Treated households sold less of their own labour off-farm during the hungry season, worked more on their own plots and harvested more; where the treatment was randomized at village level and enough households received loans, the local agricultural wage rose. That is a general-equilibrium result of the kind Chapter 10 asks for, and it says that a large part of the region’s low-productivity labour is misallocated not by preference but by cash-flow timing.
Fertility decisions are a bargaining problem, and who holds the information changes the outcome. Ashraf, Field and Lee (2014) gave married women in Lusaka vouchers for family-planning services, randomizing whether the voucher was given to the woman alone or with her husband present. Women who received it alone were significantly more likely to use concealable contraception and less likely to give birth over the following two years, and also reported lower subjective wellbeing. In a pole whose first term is the fastest in the book, the demographic path in Table 30.1 is not a parameter but the aggregate of household bargains.
What a mineral is like determines what kind of state grows around it. The best-identified Congolese evidence is a natural experiment rather than a trial. Sánchez de la Sierra (2020) used world price movements for coltan and gold in eastern Congo and found that armed groups behaved differently depending on the mineral: where the valuable commodity was bulky and hard to hide they established stationary control, taxed production and supplied rudimentary governance, and where it was compact and easy to conceal they established stationary control and taxation in the villages where miners’ incomes were spent. The physical characteristics of the ore shape the institutions that form around it, which is a mechanism rather than a curse, and mechanisms can be changed.
Two honest caveats. None of the three is about the industrial mining economy, and the first two are about the rural economy that sits beside it rather than inside it. And a region studied this little is a region where policy is made on priors, which is itself a finding about the pole.
9. Climate exposure
The Copperbelt’s climate exposure is not about sea level or heat. It is about water, in two directions: too little in the reservoirs, and too much of the wrong kind in the rivers.
Hydropower. Zambia generates the great majority of its electricity from hydropower, most of it at Kariba on the Zambezi, and the Democratic Republic of the Congo generates almost all of its from the Congo river system, which makes the pole’s industrial base a direct function of rainfall in two catchments. The drought of 2023 and 2024, the worst in four decades in southern Africa, made the consequence explicit: usable live storage at Kariba fell to 8.7 percent by 26 August 2024 against 26 percent a year earlier, generation at Zambia’s 1,080 MW Kariba North station fell to about 215 MW, the plant was shut on 14 September 2024, and Zambian households went to load shedding of up to 20 hours a day. Chapter 36 treats drought as a shock propagating through a system; this pole is the book’s clearest case of a shock arriving through the grid rather than through the farm. The forward-looking problem is worse, because both of the pole’s expansion plans, the mining one and the smelting one, add electrical load. A region proposing to triple copper output and process more of it at home, on a grid supplied by rivers whose flows are becoming more variable, has made a bet on hydrology nobody has priced.
Water quality and tailings. The second exposure is not climatic in origin but is amplified by climate, and it is the cost the mining economy imposes on the agricultural one. On 18 February 2025 a tailings dam at the Sino-Metals Leach operation at Chambishi failed, releasing more than 50 million litres of acidic effluent into the Mwambashi river and thence into the Kafue, the basin on which about 12 million Zambians depend for water, fishing and irrigation, and cutting the water supply of half a million people. Copper and cobalt processing is water-intensive and produces acidic, metal-bearing waste in enormous volumes, held behind embankments designed against a rainfall distribution that is changing, and the Copperbelt has been mined for a century behind facilities that predate any modern standard. The connection to the identity is direct: the Kafue basin is where a large share of Zambia’s non-mining employment is, and a mining sector that damages it subtracts from term two in order to add to term three.
10. Data quality
Data quality in this book is a layer rather than a caveat, so it gets its own section and its own table.
| Country | Last census | Last GDP rebasing | Last labour-force survey | Statistical performance score | Confidence flag |
|---|---|---|---|---|---|
| Angola | 2024 | none recorded | 2024 | 58.2 | medium |
| Democratic Republic of the Congo | 1984 | none recorded | 2012 | 46.3 | low |
| Zambia | 2022 | 2014 | 2022 | 64.2 | medium |
| Tanzania | 2022 | 2021 | 2024 | 68.2 | medium |
Table 30.3. Sources: national statistical offices for census, rebasing and survey years; World Bank Statistical Performance Indicators for the score; the confidence flag is this book’s own rule, described on the About the data page.
Two anchors carry the weight, and they fail in opposite directions.
The Congolese census of 1984 is the only scientific enumeration the country has held and the second oldest recorded on any of the 54 cards, after Somalia’s of 1975. Everything else follows from it: the sampling frame for household surveys has not been rebuilt since, so the last labour-force survey, run in 2012, drew from projections off a forty-year-old enumeration; the statistical performance score of 46.3 is among the lowest on the continent; no rebasing year is recorded at all; and the card carries the low confidence flag. So the Congolese working-age growth rate, the projection of 218.2 million people in 2050, the employment ratio and every per-head figure in this chapter rest on demographic projections carried forward from before most of the country’s present population was born, through a war that killed and displaced millions and through the largest urbanization in African history. The direction of the resulting error is not known. Its magnitude could be very large.
The Angolan census of 2024 is instructive precisely because it went right. Angola enumerated its population in 2024 and published definitive results in November 2025: 36,604,681 residents, about 42 percent more than the 2014 count, with Luanda province at about 8.67 million. The card, following the UN’s 2024 projections, puts Angola at 37.9 million. The two differ by about 1.3 million people, roughly 3.4 percent, and neither party is in error: the projection was prepared before the enumeration, and a de jure resident count and a projected mid-year population are not the same object. This book uses the projections throughout, because they are the only series on a common basis for all 54 countries. A reader who wants the Angolan number rather than the comparable one should take the census.
Zambia and Tanzania are the pole’s usable cards: recent censuses, recent labour-force surveys, scores in the middle of the distribution, medium confidence flags. Zambia’s last completed rebasing was in 2014, now old enough to matter for the reason Chapter 1 gave for Nigeria: a stale base year understates the fastest-growing parts of an economy, usually services and usually informal.
What the numbers here can bear, then, is the shape of the identity across the four countries, the Zambian and Tanzanian decompositions, and a creditor composition that is good for bonds and poor for bilateral lending. What they cannot bear is any precise Congolese level of anything, a per-head comparison quoted to a decimal place, a metropolitan population for any city in this pole, or a within-and-between split for the two countries that do not have one.
11. Data sources
- UN World Population Prospects 2024, medium variant: every population figure here, national rather than metropolitan, and the working-age series behind term one. Ages 15 to 64 throughout.
- ILOSTAT modelled estimates, November 2025: terms two and three and the wage-employment, non-agricultural, informality and youth-inactivity overlays. Modelled rather than surveyed, which is why section 10 lists the survey years beside them.
- Groningen Growth and Development Centre, Economic Transformation Database: the within-and-between split of term three, for the two of the four cards it covers, over 2008 to 2018.
- IMF World Economic Outlook, April 2026: output levels, output per head, observed growth and the five-year forecast.
- World Bank International Debt Statistics, 2025 release: the debt stock and its creditor composition, in which bilateral lending is not split by creditor country.
- Boston University Global Development Policy Center, Chinese Loans to Africa database, 2000 to 2024 release: the Chinese column, a cumulative flow of commitments rather than a stock.
- World Bank Statistical Performance Indicators and the four national statistical offices, including the Angolan 2024 census: the data-quality table.
- US Geological Survey, Mineral Commodity Summaries: the cobalt share; the fuller mineral treatment is Chapter 13’s.
- Zambian Ministry of Mines and Minerals Development, and Congolese customs and central bank reporting: copper and cobalt production and export volumes.
- Company and concessionaire reporting: Ivanhoe Mines and Kamoa Copper, First Quantum Minerals, Lobito Atlantic Railway, TAZARA and China Civil Engineering Construction Corporation, and Zambeef Products.
- IMF country reports and Zambia’s bondholder and official-creditor documentation: the default and the restructuring.
- The New Regional Economics, chapter 14 (Wilse-Samson, 2026): the Kasumbalesa border research, the four-corridor comparison and the cobalt tariff episode.
12. Exercises
Discussion questions
Zambia’s output per worker fell over the decade to 2024 while the Democratic Republic of the Congo’s rose at 1.8 percent a year, on similar demographics, in the same ore body, over a period when both expanded copper production. Using sections 2 and 4 rather than a list of policies, set out the two most plausible explanations for that divergence and say which observation available before 2030 would distinguish between them. Note before you start that one country carries a low confidence flag and the other a medium one.
Section 3 argues that two constraints bind here, one on the quantity of ore that leaves and one on the share of the proceeds that stays, and that fixing either alone gives a disappointing result. Construct the strongest case that this is one constraint rather than two, or that the ordering should be reversed. What would a corridor that had fixed only the first look like in the identity ten years on, and how would you tell it apart from one that had fixed only the second?
Two railways to two oceans, financed from two directions, both concessioned for thirty years to consortia in which no government of the pole holds a controlling stake. Argue for one of two readings: that a landlocked region with two competing outlets has gained real bargaining power, or that it has exchanged one dependence for two. Use section 5, and say what evidence from Chapter 25’s account of a concessioned port would strengthen your case.
Try it
Open the three cards of the corridor side by side: Zambia, the Democratic Republic of the Congo and Angola, in that order. Read down the identity block, where the three columns share one scale, then down the data-quality block. Write one paragraph on a single question: the middle column belongs to the country that supplies most of the world’s cobalt and holds the fastest-growing large population in the pole, and it carries the least trustworthy numbers on the page. What should a reader do with an aggregate that includes it? Argue for one of three positions: report it with the flag attached, report the pole without it and treat it separately, or refuse the aggregate. Then switch to the Growth Pole Map, turn the confidence toggle on, and see whether your answer survives.
Data exercise
Download all fifty-four cards from the country cards page on this site, as cards.csv or cards.json, and build a table of the four countries in this chapter with these fields: identity.working_age_pop_growth, identity.employment_to_wa_growth, identity.output_per_worker_growth, identity.gdp_growth_observed, overlays.wage_employment_share, overlays.output_per_worker_within, overlays.output_per_worker_between, balance_sheet.external_debt_stock, balance_sheet.china_loan_commitments_cumulative, scale.gdp_usd and data_quality.confidence_flag. Then do four things. First, reproduce Table 30.1 and confirm that the three terms sum to implied growth and that implied growth is close to observed. Second, compute each country’s debt stock and its cumulative Chinese commitments as shares of output, rank the four on each, and say in two sentences why the rankings disagree so violently for Angola and the Democratic Republic of the Congo. Third, take all 54 cards, select those whose working-age population grew faster than 3 percent a year and whose employment ratio grew by less than half a point, and say how many of that group are commodity exporters; this is the resource-corridor shape, tested outside this chapter. Fourth, repeat the first step excluding every card with a low confidence flag, and say which of this chapter’s claims survives. Treat nulls as nulls: a missing within-and-between split is a country the database does not cover, not a country with no structural change.