2. The Demographic Century
Learning Objectives
After reading this chapter, you should be able to:
- Take term one of the book’s identity apart into the pieces that actually move: the level of the working-age population, its growth rate, the working-age share of the total, and the dependency ratio, and explain why it is the share rather than the headcount that turns population growth into income growth.
- Place any African country in one of the four demographic stages the continent contains at the same time, using total fertility, median age and the dependency ratio from its country card, and name the countries at each end of the range.
- Distinguish a demographic dividend from a youth bulge, state the arithmetic condition that separates them, and explain why a dependency ratio above 100 is a pre-dividend condition rather than a dividend delayed.
- Explain why child survival falls before fertility does, why that ordering makes health the precondition of the dividend rather than a competing claim on the same budget, and what it implies about the sequencing of policy.
- Say what a United Nations population projection is made of, identify the African projections resting on the oldest enumerations, and judge how much of the distance between the medium and the low variant is assumption rather than measurement.
Prior work: the Sahel’s distress urbanization and the consumption-city argument this chapter points toward are developed at length in the companion volume, The New Regional Economics, chapter 13 (Wilse-Samson, 2026). This chapter cites them rather than repeating them.
Between 2024 and 2050 the number of Africans aged 15 to 64 rises from 867 million to 1,559 million (WPP, 2024). That is an increase of 692 million people in twenty-six years, which works out at 26.6 million a year, or a little over 70,000 a day, every day, for a quarter of a century. No policy decision taken between now and then will change the size of that number by very much, because almost everyone in it has already been born. What will change is whether they find anything productive to do.
The more consequential number is a ratio rather than a count. In 2024, 867 million of Africa’s 1.515 billion people are of working age, which is 57.3 percent of the total. By 2050, on the same projection, 1,559 million of 2.467 billion are of working age, which is 63.2 percent. Put the other way round, the continent carries about 75 dependants for every hundred people of working age today and will carry about 58 in 2050. Six percentage points of working-age share over twenty-six years does not sound like a revolution. It is the whole of the demographic dividend, and in East Asia an equivalent shift was worth about a third of the growth that the world later called a miracle.
This chapter is term one of the identity taken apart. Chapter 1 stated the arithmetic and quoted the continental totals; the job here is to ask what those totals are made of, which countries are producing them, on what assumptions the projections rest, and under what conditions a bulge of young people becomes a dividend rather than a problem. The answer is not uniform, and the interesting thing about African demography is precisely that it is not uniform. The continent contains, at this moment, every stage of the demographic transition that has ever been described, and a single continental average is therefore a number without a referent.
The Transition, Country by Country
Start with fertility, because fertility is the engine and everything else is downstream of it. Across the 54 country cards the median total fertility rate is 3.84 births per woman. That median conceals a range that no other continent can match. At the top sit Chad at 6.03 and Somalia at 6.01, with the Democratic Republic of the Congo at 5.98, the Central African Republic at 5.95 and Niger at 5.93 immediately behind them. At the bottom sit Mauritius at 1.23, Cabo Verde at 1.51 and Tunisia at 1.82, all three well below the replacement level of roughly 2.1 births per woman. Mauritius has a lower total fertility rate than France. Chad has a higher one than any country outside Africa. They are members of the same continental average and of the same regional trade negotiations, and the average tells you nothing useful about either.
Median age says the same thing in a different unit. The median across the 54 cards is 18.9 years, and 19 of the 54 record a median age below 18. Niger’s is 15.4 years and Mauritius’s is 37.4, a gap of twenty-two years between two members of the African Union. A median age of 15 means that half the population is a child. It means that the ratio of new entrants to incumbents in the labour market is unlike anything the rich world has experienced since the nineteenth century, and that the school system, not the pension system, is the binding fiscal constraint.
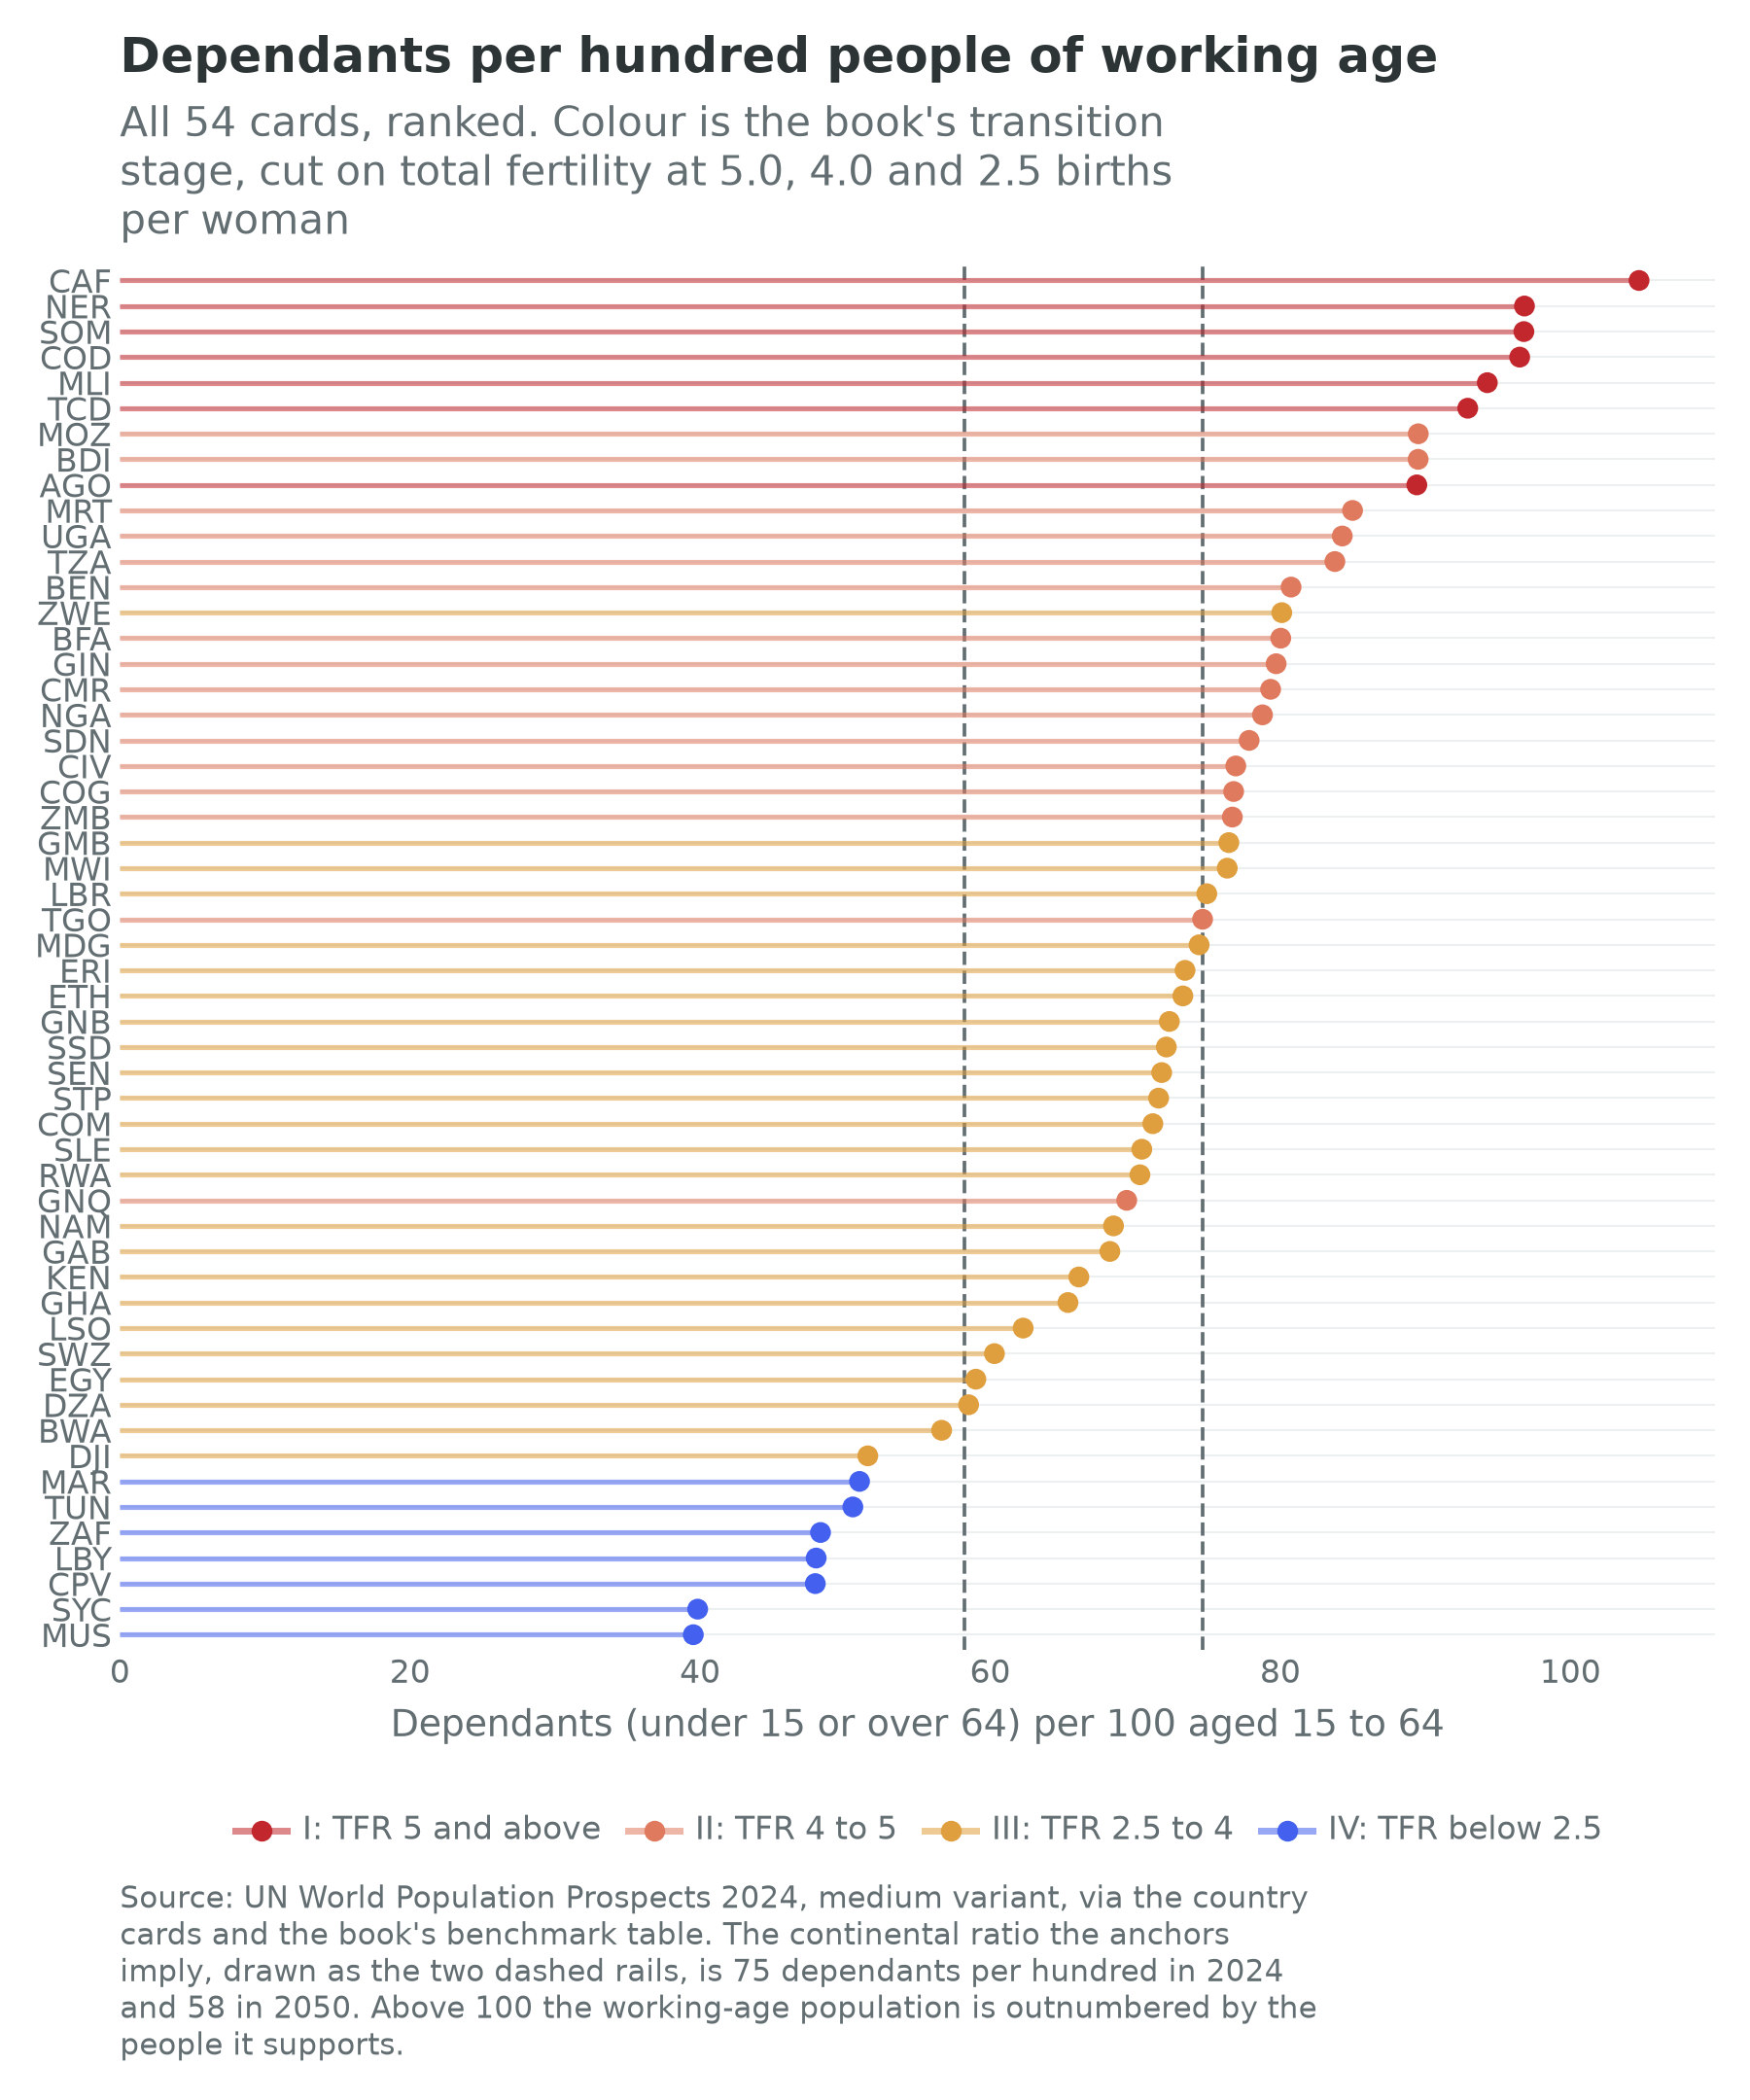
The dependency ratio is where the two facts meet the identity. It counts the people under 15 or over 64 for every hundred of working age, and the median across the cards is 73.9. Fifteen countries carry more than 80 dependants per hundred workers, and six carry more than 90: the Central African Republic at 104.7, Niger and Somalia at 96.8, the Democratic Republic of the Congo at 96.5, Mali at 94.3 and Chad at 92.9. At the other end, eleven countries carry fewer than 60, and Mauritius and Seychelles carry fewer than 40. In the Central African Republic the working-age population is outnumbered by the people it supports. In Mauritius each hundred workers support fewer than forty. Those two countries are in the same book because they are on the same continent, and for no other reason that the identity can detect.
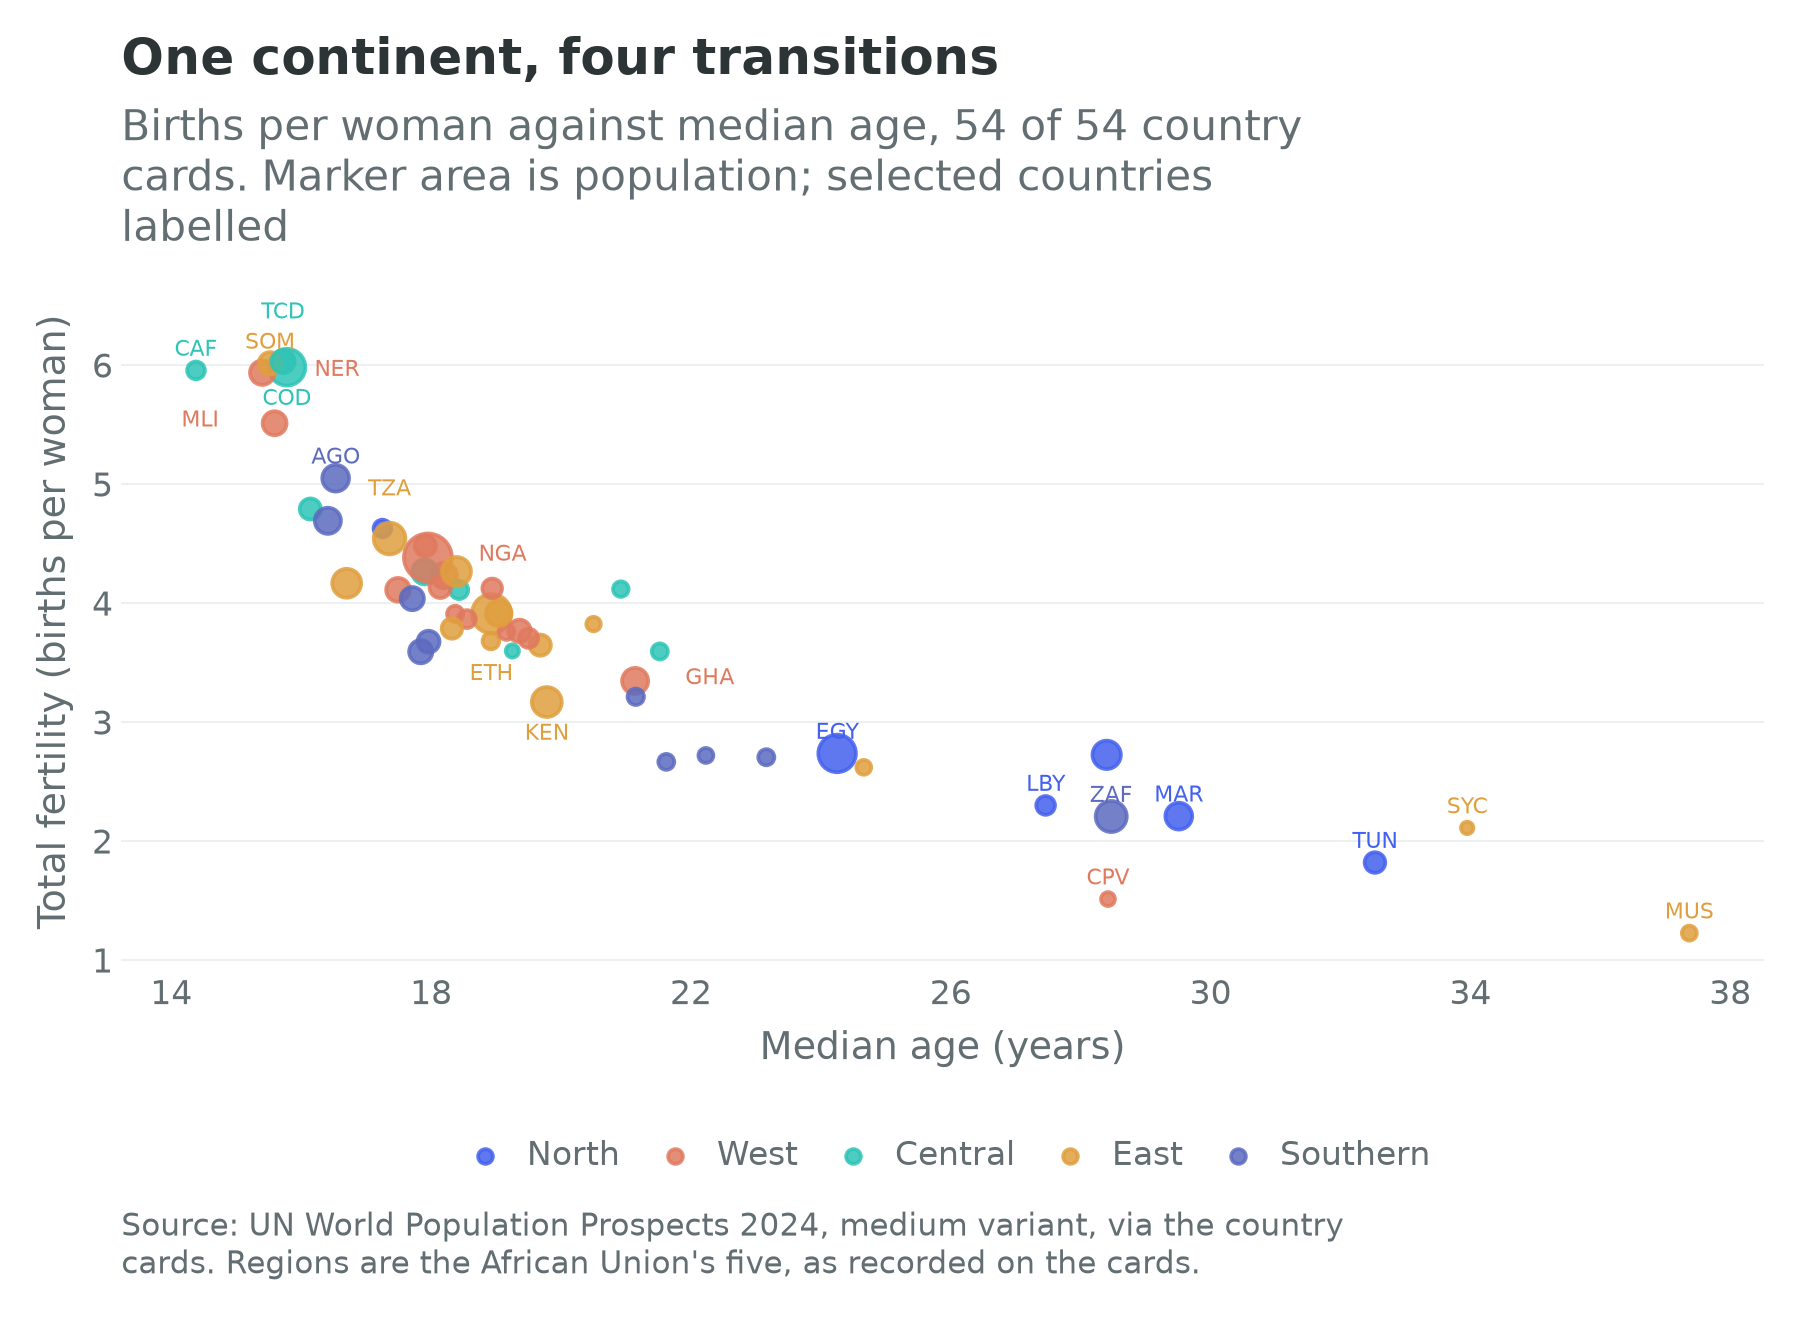
The figure shows the relationship, and it also shows why regional shorthand fails. The five African Union regions do not sort cleanly along the curve. The Northern region sits at the low-fertility end, with the important exception of Mauritania at 4.63 births per woman, which is a Sahelian country by demography and a North African one by African Union classification. The Eastern region contains both Somalia at 6.01 and Mauritius at 1.23. West Africa is tightly clustered in the middle of the curve except for Niger and Mali at the top and Cabo Verde at the very bottom. Geography is a poor predictor here. Fertility history is the whole story.
Four Stages at Once
The classical demographic transition runs in stages: high fertility and high mortality, then falling mortality with fertility still high, then falling fertility, then low fertility and an ageing population. Textbooks present the stages as a sequence a country passes through. Africa presents them as a cross-section, all four visible at the same instant on the same map.
This book cuts the four stages on total fertility, at 5.0, 4.0 and 2.5 births per woman. The cuts are a convention rather than a finding, they are stated here so that a reader can move them, and the figures colour by them so that moving them is a visible act rather than a hidden one.
The first stage, total fertility at or above five, holds seven countries: Chad, Somalia, the Democratic Republic of the Congo, the Central African Republic, Niger, Mali and Angola. Between them they hold 243 million people, 16.1 percent of the continent’s population. These are the places where the transition has barely begun, where the dependency ratio is above 89 in every case, and where term one of the identity is doing all of the work.
The second stage, total fertility between four and five, holds sixteen countries and 608 million people, 40.2 percent of the continent. Nigeria is in it, at 4.38 births per woman, and so are Tanzania at 4.54, Uganda at 4.17, Sudan at 4.26, Cameroon at 4.26, Côte d’Ivoire at 4.23 and Mozambique at 4.69. This is the largest bloc by population and the one that decides the continental aggregate. Fertility here is falling, but slowly, and the question of how fast it falls over the next twenty years is worth more to the identity than anything else in this chapter.
The third stage, total fertility between 2.5 and four, holds twenty-four countries and 538 million people, 35.5 percent of the continent. Ethiopia is in it at 3.91, Kenya at 3.17, Ghana at 3.34, Senegal at 3.77, Rwanda at 3.65 and Egypt at 2.73. These are the countries whose dependency ratios are falling now, which is to say the countries whose dividend window is open. Kenya’s dependency ratio is 66.1 and Ghana’s is 65.4, both well under the continental figure. If the dividend is going to be visible anywhere in the data over the next decade, it will be visible here first.
The fourth stage, total fertility below 2.5, holds seven countries and 124 million people, 8.2 percent of the continent. Libya, South Africa, Morocco, Seychelles, Tunisia, Cabo Verde and Mauritius have completed the transition or are within sight of the end of it. Their arithmetic is European. Morocco’s projected population in 2100 is fractionally below its population today, and Mauritius’s is a little under half of it. Any sentence about “Africa’s young population” that includes these seven is a sentence about the other 91.8 percent of Africa with an error attached, and the error is not small in the countries it misdescribes.
Dividend or Bulge
The demographic dividend has a precise arithmetic content that survives most of the enthusiasm written about it. Output per head is output per worker times the employment-to-working-age ratio (\(E/L\)) times the working-age share of the population. Those are levels; Chapter 1’s growth identity is the same product written as three growth rates, and the employment term there is \(g_{E/L}\), not a percentage-point change in the rate. If the working-age share rises and nothing else changes, income per head rises, mechanically, with no productivity improvement whatsoever. That is the first dividend, and it is temporary: it lasts as long as the working-age share is rising and stops when the share peaks. Lee and Mason (2006) named the second dividend, which is different in kind. A population that expects a long retirement and has fewer children accumulates assets, and the accumulated capital raises output per worker permanently rather than temporarily. They put the two dividends together at up to 1.9 percent a year of growth in output per effective consumer in East and Southeast Asia between 1970 and 2000, and there the second, at about 1.3 points, was the larger of the two (Lee and Mason, 2006). The first dividend is arithmetic. The second is behaviour, and it depends on institutions that let households save and on financial systems that turn savings into productive capital, which is the subject of Chapters 16 and 21.
The East Asian benchmark is worth stating precisely because it is so often stated loosely. Between 1965 and 1990 East Asia’s working-age population grew by 2.39 percent a year, against 0.25 percent a year for the dependent population and 1.58 percent for the population as a whole (Bloom and Williamson, 1998). Bloom and Williamson (1998) estimate that this shift added between 1.4 and 1.9 percentage points a year to per capita output growth, accounting for roughly a third of the region’s observed growth over the period. A third is a great deal. It is also not everything, and the remaining two-thirds is precisely what the identity’s other two terms describe: Korean and Taiwanese workers were not merely numerous, they were employed and they were productive. The dividend is a permission slip, not a payment.
Now apply the condition to the African cards. A dividend requires a rising working-age share. A rising working-age share requires fertility to fall faster than mortality among the working-age population, which is to say it requires the transition to be underway. In the seven stage-one countries it is not underway, or has barely begun, and the dependency ratio is consequently between 89 and 105. A dependency ratio above 100, which only the Central African Republic records, is not a dividend that has been delayed. It is a pre-dividend condition, the state a country is in before the transition starts to work in its favour, and the policy implications are the reverse of the dividend’s. Where the ratio is falling, the argument is about absorbing workers. Where the ratio is above 90, the argument is about feeding, schooling and vaccinating children, and about the fertility decline that has not yet happened.
The uncomfortable fact underneath all of this is that Africa’s transition is running slower than the ones the dividend literature was built on. Shapiro and Hinde (2017), reading the United Nations series, put the comparison in a single statistic: it took twenty years after peak fertility for sub-Saharan Africa’s total fertility rate to fall by 10 percent, against ten years in Asia and in Latin America and the Caribbean, and fifteen years in Northern Africa. Bongaarts and Casterline (2013) measure the pace at a comparable stage of the transition. The median African decline was 0.03 births per woman per year, less than a third of the median pace in Asia and in Latin America, and even if unmet need for contraception were eliminated entirely, fertility would remain well above Asian and Latin American levels, because ideal family size is high. Bongaarts (2017) traces why. The African transition starts later, and at a lower level of development, than the transitions elsewhere; at a given level of development, desired family size is higher, and that difference in preferences, rather than a failure to implement the preferences people already hold, accounts for most of the remaining difference in fertility. Shapiro and Gebreselassie (2008) documented the pattern that gave the phenomenon its name, transitions that fall and then stall: Kenya and Ghana both saw fertility decline halt for the better part of a decade before resuming. Caldwell, Orubuloye and Caldwell (1992) argued much earlier that African fertility transitions would be different in kind rather than merely late, because the economics of children in African lineage systems differs from the economics of children in the settings where the transition was first described. Thirty years on, that argument has aged well.
The practical consequence for this book is a discipline about tense. The dividend is not something Africa has. It is something a growing number of African countries are becoming eligible for, at different dates, on different conditions, and the country cards are how the book keeps track of which is which.
Health Is the Precondition, Not the Sequel
Fertility does not fall first. Child survival falls first, and fertility follows it, usually after a lag of a decade or more. This is the central mechanism of the demographic transition and it is worth being explicit about, because it inverts the way health spending is usually argued about in ministries of finance.
The mechanism is straightforward once stated. Households in high-mortality settings target a number of surviving children, not a number of births. When one child in five dies before the age of five, a family that wants three adult children has six. When child mortality falls and the fall becomes visible and credible, the same target is met with fewer births, and fertility declines. The lag is the time it takes for the new mortality regime to be believed, which is roughly the time it takes for a cohort of parents to observe that their neighbours’ children are surviving. Canning, Raja and Yazbeck (2015) organise the whole of the World Bank’s African dividend volume around this ordering: declines in child mortality come first, declines in fertility follow, and only then does the age structure begin to shift in a way that produces a dividend. Their conclusion is that the dividend in Africa is available but conditional, and that the conditions are met by policy rather than by waiting.
This has three implications that this book will return to. The first is that health spending is not in competition with growth spending; on this reading it is the first stage of growth spending, because the age-structure shift that the identity’s first term is about does not begin until child survival has improved. Ezeh, Bongaarts and Mberu (2012) make the parallel case for family planning: in the poorest countries, and especially in sub-Saharan Africa, unmet need for contraception is large, and a voluntary family-planning programme is the main instrument for reducing unwanted fertility. The second implication is that the sequencing gives a country a rough forecast of its own future: a country whose child mortality fell sharply fifteen years ago should be seeing fertility fall now, and if it is not, something specific is blocking it, which is a question with an answer rather than a lament. The third is that the health argument and the fertility argument are the same argument, which is why this book treats health here, in the demographic chapter, and then reprises it briefly in Chapter 23 rather than devoting a separate sector chapter to it.
There is a counter-case, and it is a serious one. Ashraf, Weil and Wilde (2013) built a simulation model of exactly this channel, allowing fertility reduction to work through schooling, age structure, capital accumulation, parental time and the crowding of fixed resources, and asked what moving Nigeria from the United Nations medium variant to the low variant would be worth. Their answer is that output per capita would be 5.6 percent higher after twenty years and 11.9 percent higher after fifty (Ashraf, Weil and Wilde, 2013). That is a real gain and it is also a modest one, far smaller than the rhetoric around the demographic dividend implies, and it accumulates over a half-century. The honest reading is that fertility decline is worth having, that it is not a substitute for anything on the productivity side of the identity, and that a country which gets its demography right and its term three wrong will still be poor.
What the Projections Rest On
Chapter 1 named the eight African UN member states that at least double their populations between 2024 and 2054: the Democratic Republic of the Congo, the Central African Republic, Angola, Somalia, Niger, Chad, Tanzania and Mali. The question this chapter has to answer is why those eight and not others, and the answer has two parts.
The first part is fertility level, and it is nearly the whole story. Seven of the eight are stage-one countries, with total fertility at or above five births per woman. Tanzania is the exception at 4.54, and it doubles for the second reason rather than the first. That second reason is age structure, or momentum. A population with a median age of 17.4, as Tanzania’s is, contains an enormous cohort of girls who are not yet of childbearing age. Even if each of them goes on to have fewer children than her mother did, there are so many more of them that the number of births rises. Momentum is why a fertility decline that starts today does not show up in the population total for twenty years, and it is why the 2050 numbers are far more reliable than the 2100 numbers. Almost everyone alive in 2050 is either alive now or will be born to a woman who is alive now. Nobody who will be alive in 2100 is bound by that constraint.
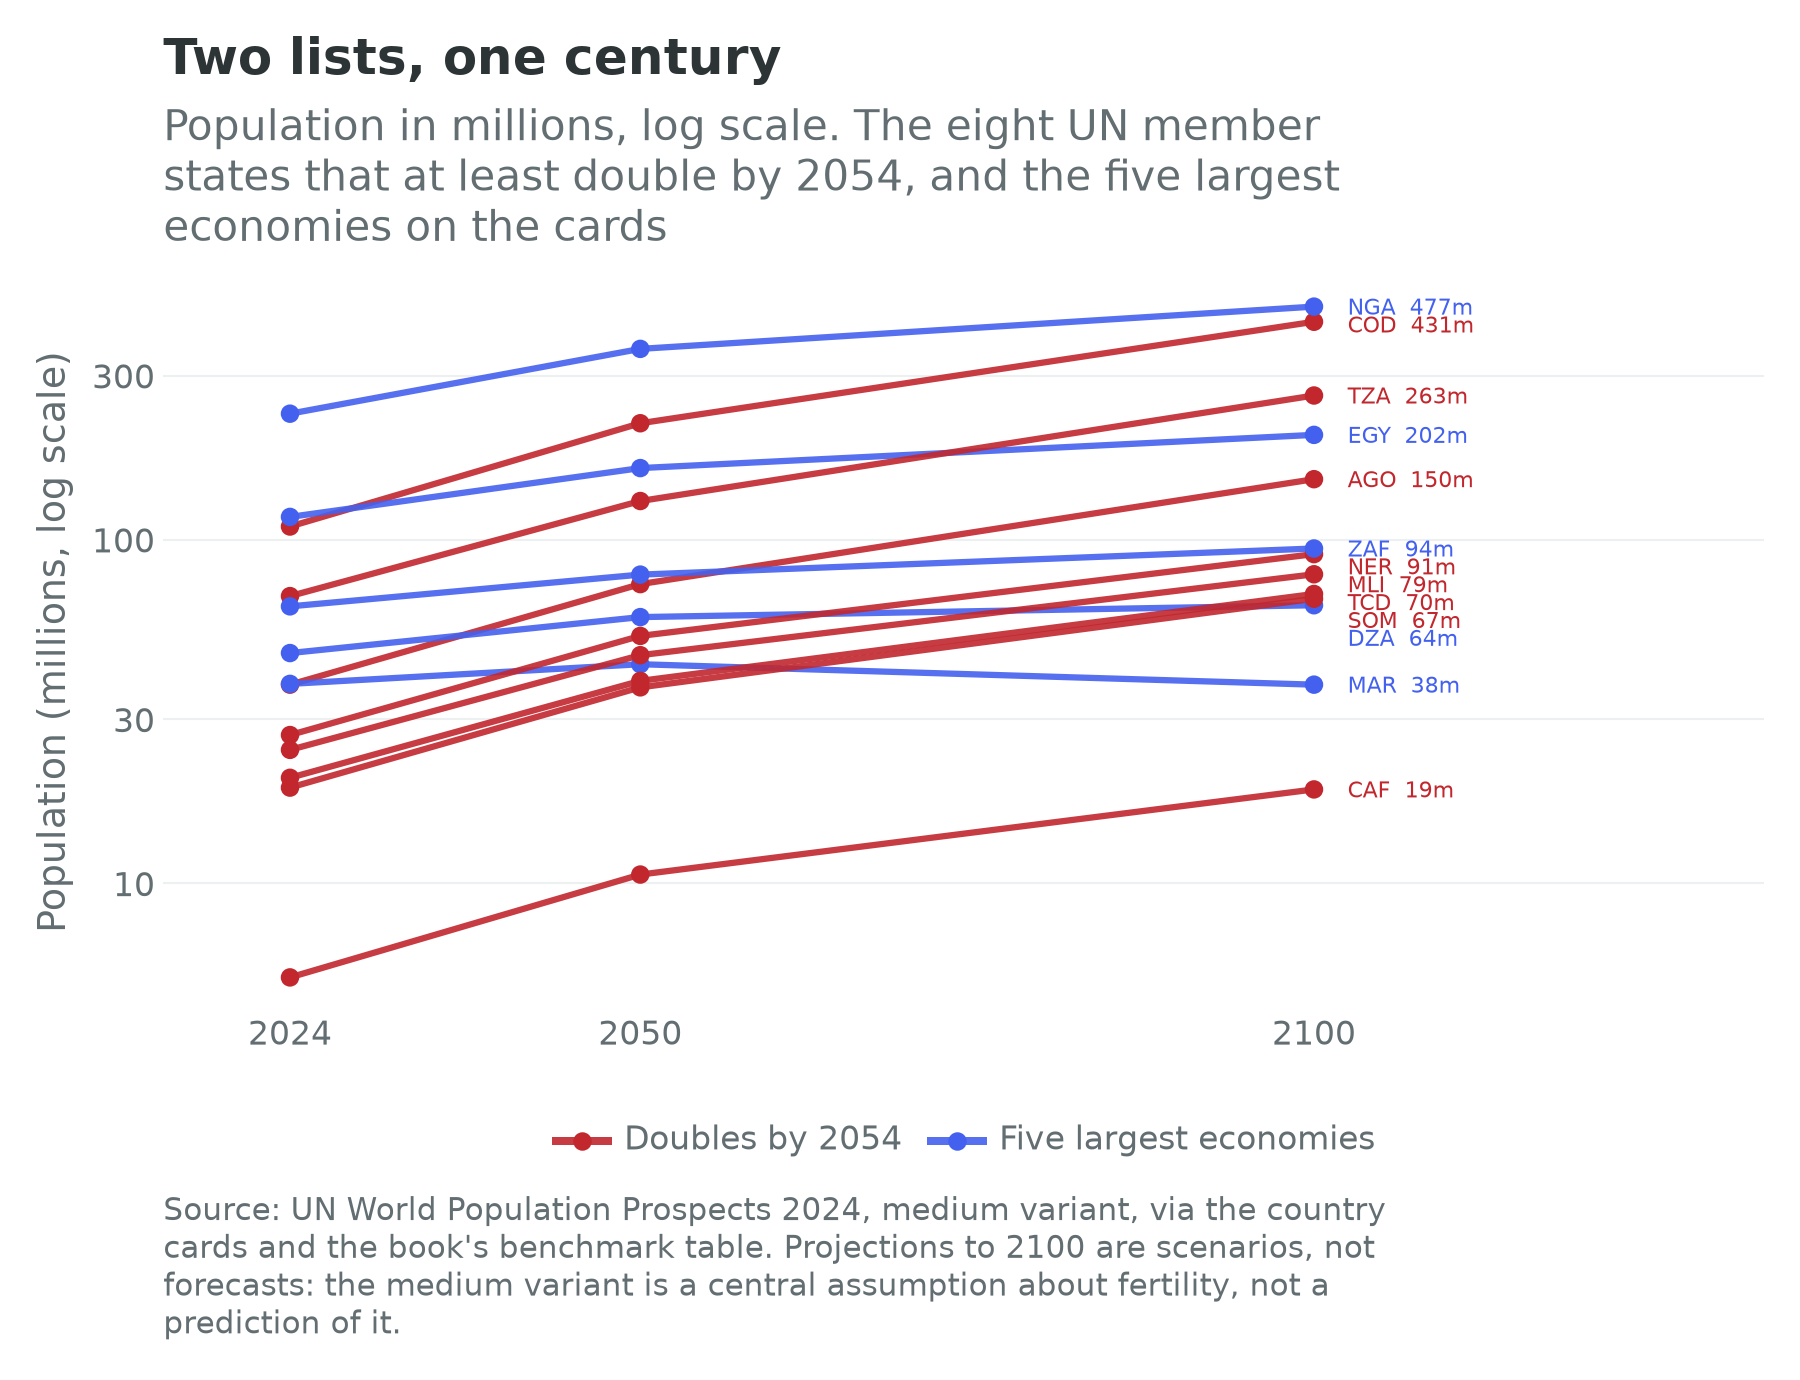
The figure puts the two lists on one panel, and the divergence is the point. Nigeria, on the economic list, goes from 232.7 million to 476.7 million over the century, a little more than doubling but over seventy-six years rather than thirty. The Democratic Republic of the Congo, on the demographic list, goes from 109.3 million to 430.7 million, very nearly quadrupling, and ends the century within striking distance of Nigeria. Angola nearly quadruples, from 37.9 million to 150.0 million. Tanzania goes from 68.6 million to 262.8 million and ends the century larger than Egypt. Morocco, meanwhile, ends the century with 37.9 million people against 38.1 million today, which is to say slightly fewer. The economic map of Africa in 2100, if these paths hold, is not a scaled-up version of the economic map of Africa today.
That conditional is doing a lot of work, and it deserves a paragraph of its own. A United Nations population projection is not a forecast in the sense a weather forecast is. It is a cohort-component calculation: take the population by age and sex, apply assumed fertility rates, mortality rates and net migration, roll it forward five years, and repeat. Everything therefore depends on the assumptions, and since the 2010 revision the assumptions have themselves been estimated statistically rather than chosen by hand. Raftery, Alkema and Gerland (2014) describe the machinery: Bayesian hierarchical models for total fertility and for life expectancy at birth, fitted to the historical experience of all countries, which produce a probability distribution over each country’s future fertility path rather than a single line. The medium variant that this book quotes throughout is the median of that distribution. It is not a ceiling, it is not a floor, and it is not a plan. The low and high variants shift assumed fertility by half a child per woman in each direction, which is a convention rather than a confidence interval, and the distance between them is large: it is the difference, in Nigeria’s case, between the two paths Ashraf, Weil and Wilde (2013) priced at nearly 12 percent of output per head over fifty years.
Underneath the assumptions sit the enumerations, and here the African projections are on thinner ice than the elegance of the method suggests. The Democratic Republic of the Congo, the largest of the eight doublers and the country the medium variant has approaching 431 million people by 2100, last ran a census in 1984. The Central African Republic last counted in 2003, Chad in 2009 and Niger in 2012. Somalia’s last published census was in 1975. Of the eight doublers, four rest on an enumeration more than fifteen years old, and only Angola, Tanzania and Mali have counted since 2020. Nigeria, which is not a doubler but which supplies more people to the world’s population increase than any other African country, last counted in 2006.
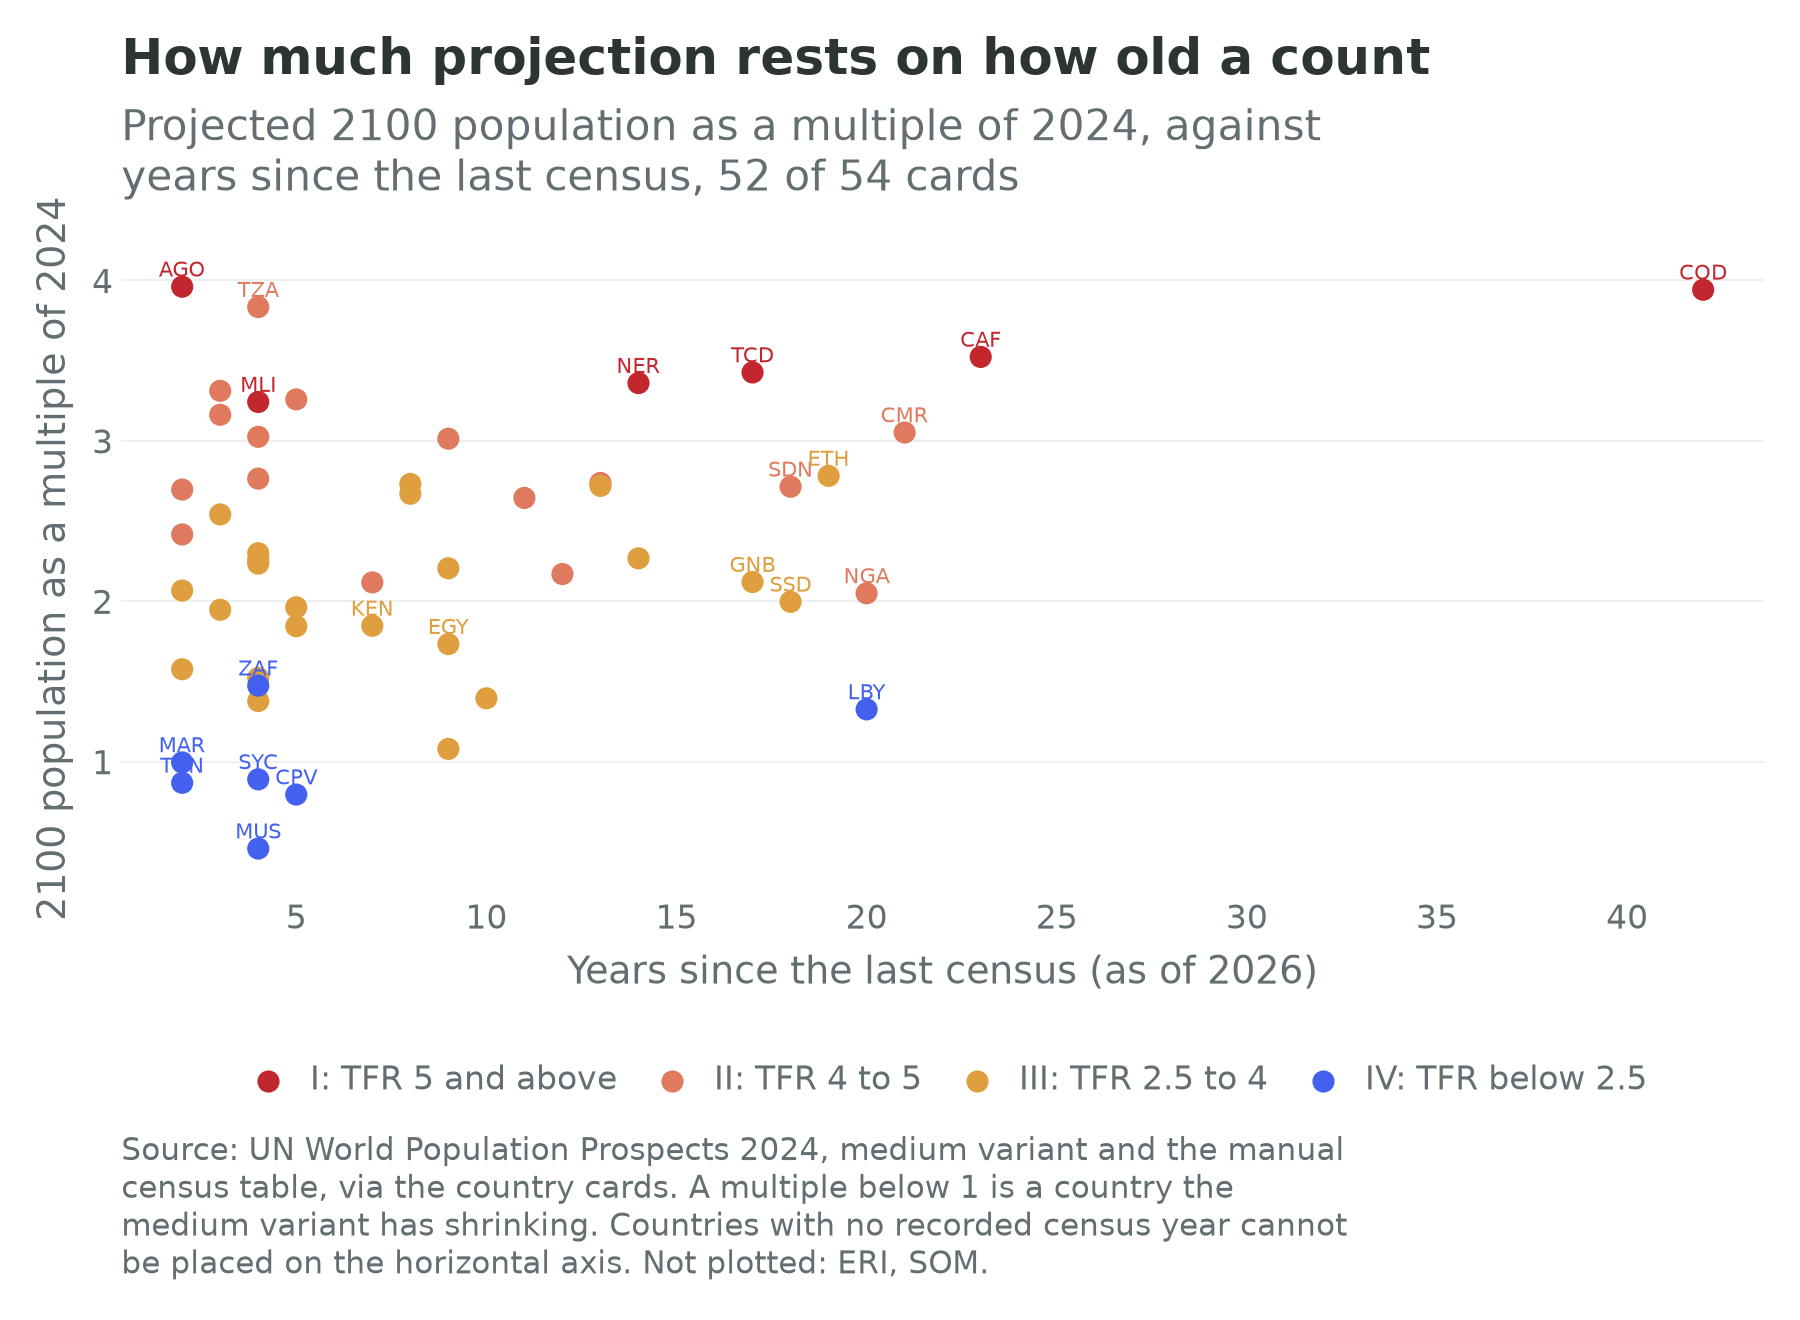
The right conclusion from the figure is not that the projections should be discarded. Fertility and mortality are estimated from household surveys as well as from censuses, the transition is slow and smooth, the methods are public and revised in public, and a projection error of ten percent on a number that quadruples does not change any argument in this book. The right conclusion is narrower and more useful. Country-level population levels for the worst-documented cases should be held loosely; per capita statistics for those countries inherit the same looseness through the denominator; and the confidence layer on every map in this book exists so that a reader can see, in one click, which countries the projection is asking to carry the most weight on the least evidence. Chapter 1 set out that machinery, and this is the first chapter where the argument depends on it.
The Youth Cohort and the Move
A cohort this large does not stay where it was born, and three kinds of movement matter for the identity. This section marks them and hands them on. Chapter 10 owns migration and does the country-by-country work.
The first movement is internal, from countryside to town, and it is the largest of the three by an order of magnitude. It matters for term three of the identity rather than term one, because a worker who moves from a farm to a city has not changed the size of the working-age population but may have changed her output per hour a great deal, or may not have, depending on what she finds when she arrives. Whether African urbanization is delivering the productivity gain that urbanization delivered elsewhere is the question the consumption-city literature raises, and the companion volume’s chapter 13 works through it (Wilse-Samson, 2026). Chapter 22 carries the urban half of this book’s answer.
The second movement is intra-African, and it is systematically misunderstood outside the continent. The large majority of Africans who cross an international border move to another African country rather than to Europe or North America, and the drivers are the ordinary ones of work and family rather than the emergency ones of conflict and famine (Flahaux and de Haas, 2016). The same work makes a point that matters for the next thirty years: development and emigration rise together over long stretches of the income range, because leaving requires money, so a richer Africa will in the first instance be a more mobile one, not a less mobile one. The regional communities have built formal free-movement regimes for exactly this traffic, in the Economic Community of West African States and the East African Community above all, and Chapter 7 assesses how much of the free movement is real.
The third movement is the diaspora, which the African Union calls its sixth region and which sends home more money than foreign direct investment delivers. That is a balance-sheet fact rather than a demographic one, and Chapters 10 and 21 handle it.
Behind all three sits the number that gives this book its central tension. Ten to twelve million young Africans enter the labour market each year, and the formal economy creates roughly three million jobs (AfDB, 2016). Term one of the identity produces the twelve million. Term two decides what happens to the other nine, and it is not currently deciding in their favour. The reader should hold the two numbers side by side, because everything hopeful in this chapter is contingent on the second one moving.
Where Term One Is Alone
The counter-case belongs on this page rather than in a later one, and the Sahel is where it is sharpest.
Take Niger, Mali, Burkina Faso and Chad together. Niger records a total fertility rate of 5.93 and 96.8 dependants per hundred working-age adults; Mali records 5.51 and 94.3; Chad records 6.03 and 92.9; Burkina Faso, further along, records 4.11 and 80.0. Their working-age populations grew at 4.0, 3.5, 3.3 and 4.1 percent a year respectively over the decade to 2024, at or near the top of the continental distribution. Term one, in other words, is delivering everything it can deliver. What is happening to the other two terms is the problem. Three of the four have withdrawn from the Economic Community of West African States. Only Chad lacks a survey within the last five years, its last being from 2018; Niger and Mali have household surveys with an employment module, from 2022 and 2024, and Burkina Faso runs a twice-yearly employment survey, most recently in 2025. The employment term can be measured in the places where it matters most, but from surveys built first to measure living standards, and only since these rounds; before them the record was empty.
This is what the identity looks like when term one runs alone. Working-age population growth above three percent a year, an employment ratio that is very likely falling as conflict closes markets and displaces farmers, and output per worker under pressure from insecurity, from the loss of the arable margin to the south, and from the collapse of the trade routes the region’s towns were built on. A term that adds three points a year to potential output is worth nothing when the other two subtract more. The companion volume’s chapter 13 develops the distress-urbanization argument for Niamey, Ouagadougou, N’Djamena and Bamako, cities growing quickly without formal employment growing at all (Wilse-Samson, 2026), and Chapter 36 of this book carries the full Sahel section, including the climate and conflict material and the shock-propagation exhibit. Chapter 31 has a pointer to it. Nothing in this chapter is a reason to be optimistic about the Sahel, and the honest version of the growth-century thesis has to say so in the same breath as it says that two of every three people joining the human race in the next three decades will be African.
There is a second, quieter counter-case in the same data. The Central African Republic has the continent’s highest fertility at 5.95 and its highest dependency ratio at 104.7, and its working-age population grew at only 1.27 percent a year over the decade to 2024, less than half the Sub-Saharan median. High fertility does not automatically produce a fast-growing labour force. It produces one only if the children survive and stay. Where conflict raises mortality and drives emigration, a country can have the demography of a pre-dividend state and the labour-force growth of a post-dividend one, which is the worst of both arrangements.
What the Cards Show
Every country card carries term one already, as a growth rate over 2014 to 2024, alongside the fertility, median-age and dependency fields this chapter has used. The two terms that decide whether term one becomes income are on the cards too, on 53 of the 54, and Chapter 10 reads them from the employment side and the output side against the wage-employment and non-agricultural overlays that make the middle term mean what a finance minister means by a job. The sorted table is the identity scoreboard: working-age population growth in one column, employment-ratio growth in the next, output-per-worker growth in the third, and the sum against observed GDP growth in the fourth. The countries where the first column is large and the other two are small are the ones the book is really about. A decomposition whose middle term is modelled rather than measured, in the countries where the argument is decided, is still a decoration rather than a decomposition, and Chapter 1 has already made the case for not decorating. Chapter 10 puts the survey coverage on the same page as the numbers, which is why the table is worth reading.
Connections to Other Chapters
- Chapter 1 (Africa in Numbers) states the identity this chapter takes apart, and builds the confidence layer that Figure 2.4 uses.
- Chapter 4 (The Case and the Counter-Case) stages the dividend-versus-bulge argument as an argument, with the Africa Rising literature on one side.
- Chapter 10 (Labor, Youth, and Migration) owns the entrants figure, the employment overlays and all three kinds of migration sketched here.
- Chapter 20 (Human Capital) takes up what happens to the children counted in the dependency ratios above once they reach a classroom.
- Chapter 22 (Land) carries the urban half of the youth cohort’s story, including the megacity projections and the consumption-city critique.
- Chapter 23 (Inequality, Social Protection, and Health) reprises the child-survival argument on the distributional side rather than the demographic one.
- Chapter 35 (Scenarios to 2050 and 2100) projects the identity forward under alternative fertility, employment and productivity paths, and is where the medium and low variants are put to work rather than merely described.
- Chapter 36 (What Could Go Wrong) carries the full Sahel section and the fertility-stall scenario.
Discussion Questions
The first demographic dividend is arithmetic and the second is behavioural. Using the Lee and Mason (2006) distinction, explain why a country could capture the first and miss the second entirely, and name two features of a financial system that would decide which happens. Then say which African countries in stage three of the transition you would expect to capture the second, and why.
Bongaarts and Casterline (2013) show that sub-Saharan fertility has fallen more slowly than fertility in Asia or Latin America at the same point in the transition. Suppose you believe them and you also believe the medium variant. Are those two beliefs consistent? Set out what the medium variant would have to assume about the pace of decline for both to be true, and say what evidence would settle it.
The Central African Republic has the continent’s highest dependency ratio and one of its slowest rates of working-age population growth. Explain how both can be true at once, and use the case to say what the dependency ratio does and does not measure. Then say whether you would want the country cards to carry a separate field for the child dependency ratio and the old-age dependency ratio, and what you would learn from splitting them.
Try It
Open the Century Slider and drag the year from 1950 to 2100, watching the eight doublers: the Democratic Republic of the Congo, the Central African Republic, Angola, Somalia, Niger, Chad, Tanzania and Mali. Then switch the scaling from total population to the working-age population aged 15 to 64 and run the century again. Several of the eight are much smaller circles under the second view than the first, and they are the stage-one countries, because so much of their population is under 15. Then switch on the confidence layer, which fades every country whose demographic estimates rest on an old census or a weak statistical system, and run it a third time. Write one paragraph on which of the eight doublers survives all three views, and whether the ones that fade are the ones this chapter’s argument leans on hardest.
The same exercise can be done from the numbers alone. Open the country cards for the eight and read each card’s population in 2024, 2050 and 2100, its working-age growth rate, its dependency ratio, and the four data_quality fields; then colour the Growth Pole Map by working-age population growth and switch on its confidence layer. The cards will tell you which of the eight shrink when the measure changes from people to workers, and the map will tell you which of those you should not lean on.
Data Exercise
Download all fifty-four cards from the country cards page on this site, either as cards.csv or as cards.json, and build a table of all 54 countries with seven columns: scale.tfr, scale.median_age, scale.dependency_ratio, scale.population, scale.population_2050, scale.population_2100 and data_quality.last_census_year. Then answer four questions. First, reproduce this chapter’s four stages by cutting scale.tfr at 5.0, 4.0 and 2.5, and check the counts and the population shares reported above. Second, move the cuts: try 4.5, 3.5 and 2.1 instead, and report how many countries change stage and whether any of the chapter’s claims stop being true. Third, compute each country’s 2024-to-2100 population multiple and regress it on scale.tfr and scale.median_age together; report which of the two does more work and explain, in one sentence, why momentum shows up as the median-age coefficient. Fourth, split the sample at a census fifteen years old and compare the mean multiple on each side, then say whether the difference tells you something about demography, something about statistical systems, or something about the correlation between the two. Note which fields are null rather than zero, and never impute a null as a zero.
Data Sources and Further Reading
Key data sources
- UN World Population Prospects 2024 (population.un.org): all fertility, median-age, dependency, working-age and projected-population figures here, medium variant, ages 15 to 64 unless stated. The continental benchmarks are the medium-variant totals for 2024, 2050 and 2100; country values are on the cards.
- National statistical offices and census records, cited by name in the manual data-quality table behind
data_quality.last_census_year: INS Democratic Republic of the Congo (1984), NBS Nigeria (2006), CSA Ethiopia (2007), INS Niger (2012), INSTAT Mali (2022). - Demographic and Health Surveys and Multiple Indicator Cluster Surveys: the inter-censal fertility and child-mortality estimates that carry the projections between enumerations.
- UN DESA World Urbanization Prospects and Africapolis: the urban side, used in Chapters 22 and 24 rather than here (OECD and SWAC, 2020).
- ILOSTAT: the employment series that Chapter 10 sets beside term one.
Further reading
- David Canning, Sangeeta Raja and Abdo Yazbeck, eds., Africa’s Demographic Transition: Dividend or Disaster? (2015), the standing reference for the conditional version of the dividend argument.
- John Bongaarts, “Africa’s Unique Fertility Transition” (2017), for why the African transition is not simply a late version of everyone else’s, with John Bongaarts and John Casterline (2013) on the pace and David Shapiro and Andrew Hinde (2017) for the twenty-year comparison.
- David Bloom and Jeffrey Williamson, “Demographic Transitions and Economic Miracles in Emerging Asia” (1998), for the benchmark every African dividend claim is implicitly measured against.
- Quamrul Ashraf, David Weil and Joshua Wilde, “The Effect of Fertility Reduction on Economic Growth” (2013), for a sober estimate of what fertility decline is actually worth.
- Marie-Laurence Flahaux and Hein de Haas, “African Migration: Trends, Patterns, Drivers” (2016), for the correction to almost everything written about African migration in the European press.
- Adrian Raftery, Leontine Alkema and Patrick Gerland, “Bayesian Population Projections for the United Nations” (2014), for what is actually inside a UN projection.