22. Land: Rural Tenure and Urban Land
Learning Objectives
After reading this chapter, you should be able to:
- Explain how customary tenure actually allocates and secures rural land in Africa, why it is an administration rather than an absence of one, and what the politics of that administration decides.
- Set out what the certification and registration programmes of the last thirty years bought, distinguishing the effect on investment from the effect on credit and from the effect on the state’s own information.
- Trace how a plot becomes a house in an African city, name the claims a buyer has to settle on the way, and say which of them a certificate extinguishes and which it does not.
- Place land in the book’s identity: why the rural side is a term-three question and the urban side a term-two one, and why the price of urban land is where structural change meets the consumption city.
- Say what land is worth in each of the book’s two worlds, and why the answer decides the distribution of income in the second one.
Prior work: the consumption-city argument (Gollin, Jedwab and Vollrath, 2016), the Africapolis agglomeration series and the seventeen-megacity projection, the Lall, Henderson and Venables account of African urban costs, the Sahel’s distress urbanization and the nightlights machinery are all developed at length in the companion volume, The New Regional Economics, chapters 13 and 14 (Wilse-Samson, 2026). This chapter cites that material and does not repeat it. What it adds is the land market itself, rural and urban, read against the identity.
About nine tenths of the rural land of Sub-Saharan Africa is held without a document that any registry would recognize (Byamugisha, 2013). In Nigeria, the continent’s largest country, less than 3 percent of land is formally registered with any tier of government, and a survey in 2019 found more than seven in ten landlords holding no certificate of occupancy at all (Africa Check, 2023). The single largest asset class on the continent, the ground itself, is therefore almost entirely undocumented, which does not mean that nobody owns it. It means that ownership is established by something other than paper: by lineage, by clearing, by continuous use, by a chief’s word, by a receipt from a family that says it sold you the plot, and, when those fail, by whoever can hold it.
That is the subject of this chapter, and it comes in two halves that are usually written about by different people. The rural half is about tenure: who has the right to farm, for how long, with what security, and whether that security changes what they plant. The urban half is about price: what a plot on the edge of Lagos or Nairobi is worth, who captures the difference between its value as farmland and its value as a building site, and whether the people whose labour makes the city valuable can afford to live inside it. The two halves are one market, because the frontier between them moves outward every year, and the money is made at the frontier.
Land in the identity
Start where the book always starts. GDP growth is approximately the growth of output per worker, plus the growth of the employment-to-working-age ratio, plus the growth of the working-age population, and all three are growth rates. Land does not appear in that identity anywhere, which is the first thing to say about it, and the second is that it is underneath all three terms.
The rural side is a term-three story. A farmer who expects to hold her plot in fifteen years will plant a tree, terrace a slope, dig a well and buy fertiliser for a soil she intends to keep. A farmer who does not will plant maize and move on. Everything the tenure literature measures is a within-sector productivity effect in the sense of Chapter 6: it makes farming better rather than moving farmers. Chapter 11 borrowed one paragraph of this argument, the investment margin, and left the rest here.
The urban side is a term-two story, and it is less obvious. Where a city’s workers can live decides who can take which job, because a commute of three hours each way at a fare a day-labourer cannot pay is a barrier to employment as real as a licence or a skill. The price of urban land is therefore a labour-market variable. It is also where the between-sector component of term three meets the consumption city: reallocation adds to measured productivity only if the worker who leaves the farm arrives somewhere more productive, and a city whose growth is financed by a rent rather than by tradable output offers her a market stall, which the companion volume works through and this chapter does not restate (Wilse-Samson, 2026).
The third connection is the one Chapter 5 named. Land is the rent growing fastest on this continent, and in much of Africa the state or an authority holds the freehold, so converting peri-urban land from customary use to serviced plots is an administrative act. The gap between the two values goes to whoever signs. That is the third of Chapter 5’s four rent mechanisms, and every megaproject section in Part VI is partly a story about who got the land around it.
What the cards do not carry
This chapter has a problem the others do not, and the honest thing is to put it in the second paragraph rather than the last section. Land is the input the country cards do not carry. There is no field for land area under title, none for the price of a hectare, none for rents. The two urban fields the schema does define are both filled, and between them they carry a warning this chapter has to pass on. Every one of the fifty-four carries an urban share, read at 2025 on each country’s own definition of what counts as a town: Nigeria 63.8 percent, Egypt 42.9, Kenya 32.2. Fifty carry a largest city and its 2050 projection, Nigeria’s being Lagos at 16.1 million and 36.9 million. The four that do not are the ones where the agglomeration database’s newer delineation produced a figure the book will not print: Kenya’s largest settlement comes out as neither Nairobi nor anything a reader would recognise, and Egypt’s Cairo absorbs most of the Delta. The two fields answer different questions and are never combined: an urban share is a national statistical office’s boundary, a largest city is a built-up area drawn the same way everywhere, and one is not a check on the other.
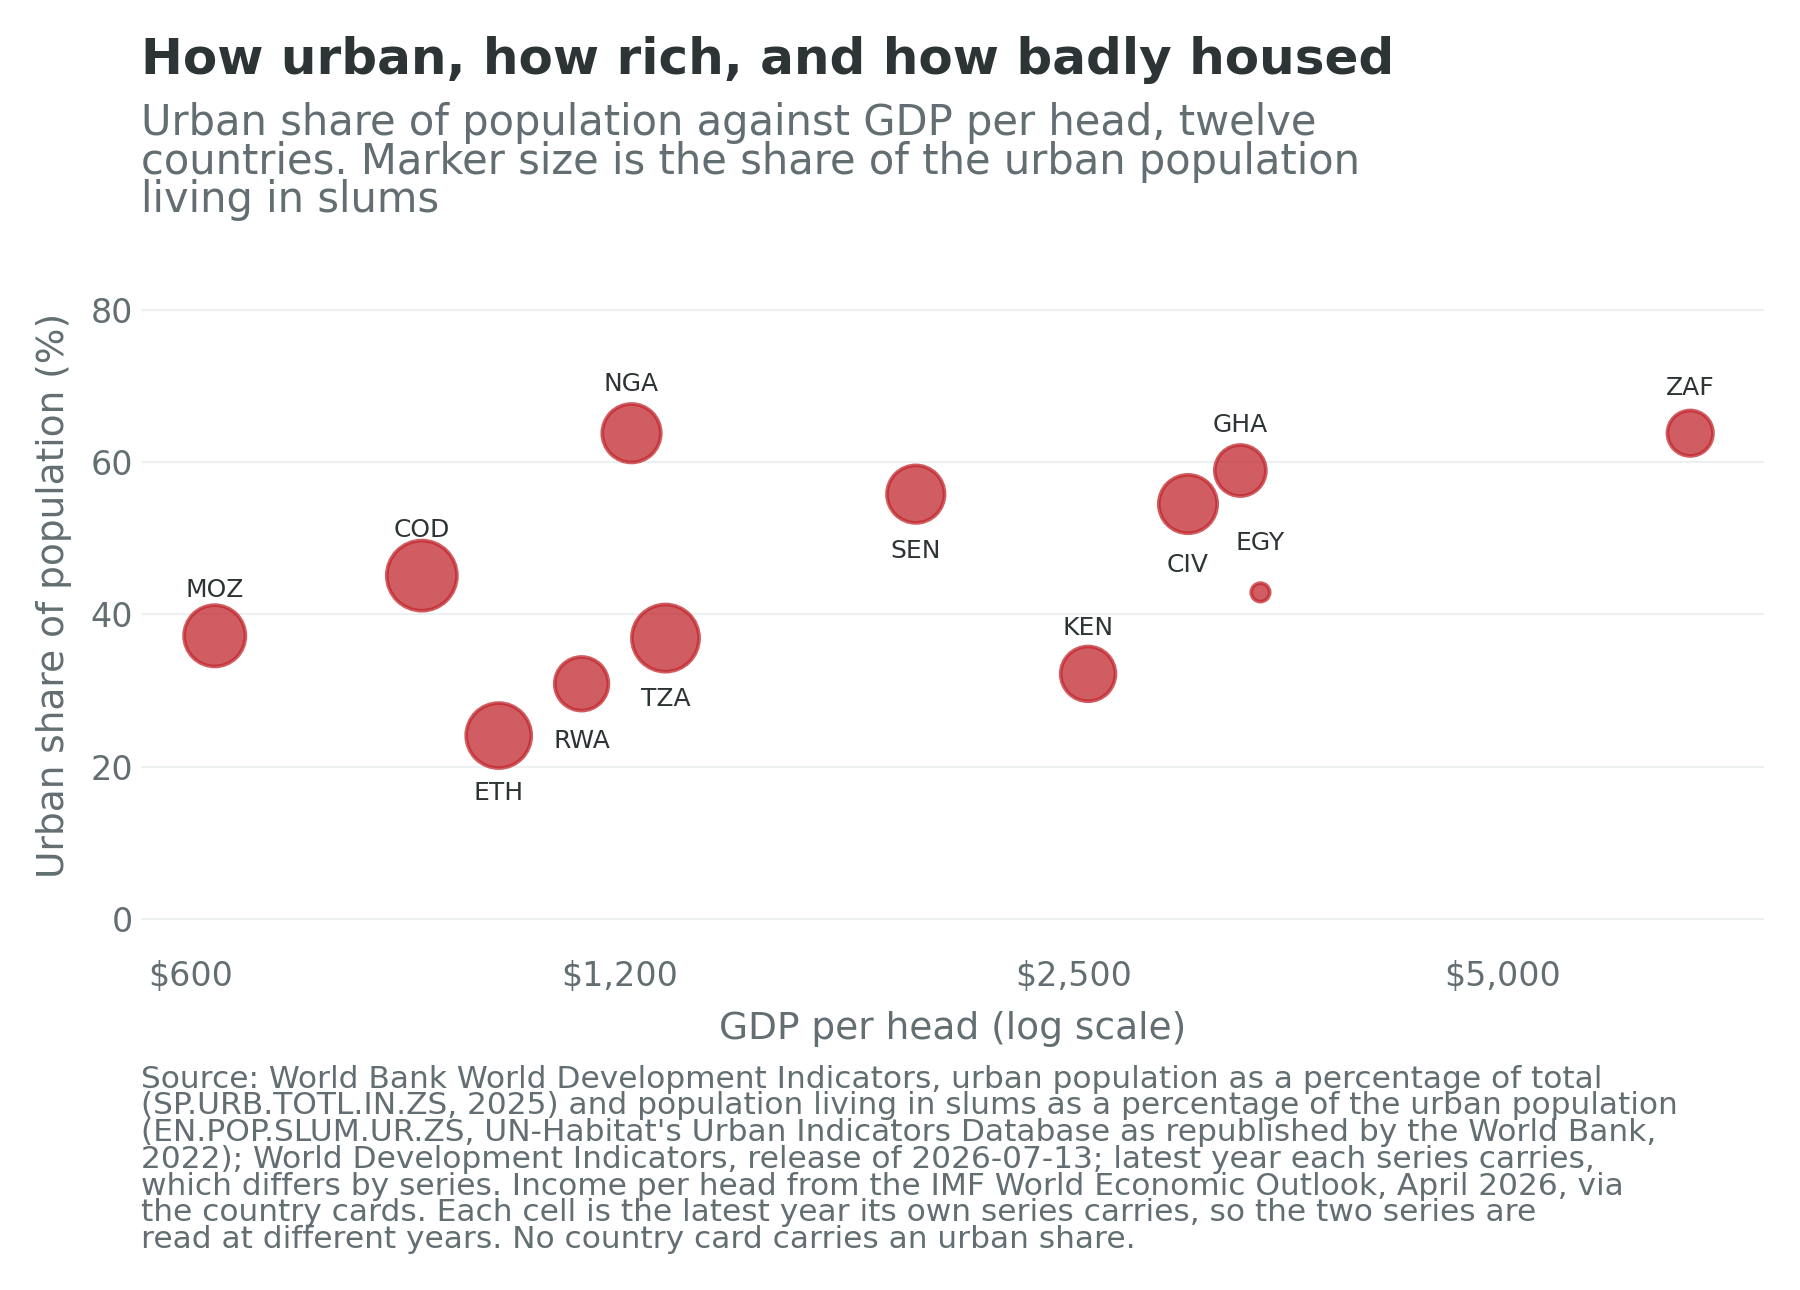
A second warning belongs beside it, and it is about vintage rather than definition. This chapter keeps its own data file, which is what Figure 22.3 and the two correlations beneath it are drawn from; the file and the cards read the same indicator at the same rule for which year to take, and they agree to the decimal on all twelve: Rwanda 30.9 percent, Nigeria 63.8, Senegal 55.8 and South Africa 63.8, where the previous revision of the same indicator gave 18.1, 55.0, 50.1 and 69.3. The Rwandan gap is the widest of the four because the 2022 census moved the country’s urban share by some twelve percentage points. Urban shares on this continent are revised in level and not only at the margin, so a reader setting these figures beside a source published two years ago should expect differences of that order and should check the revision before concluding that anybody has urbanised. The scatter would not turn on it in any case, because a scatter of twelve points does not turn on any one of them and the argument it makes is about the difference between two slopes rather than about either level. But a chapter arguing that African land data is assembled rather than measured should be the first to say which vintage of which series its own numbers come from.
Every other urban figure in this chapter is quoted with its own vintage and listed in the chapter’s data file, the slum share among them: the World Bank publishes it, from UN-Habitat, every second year, and last for 2022. Where a city population is needed, the book uses the companion volume’s agglomeration figures, which are built-up-area readings rather than administrative counts and are labelled as such each time (Africapolis, 2025).
What the cards do supply is the identity position of the countries this chapter argues about. Table 22.1 carries twelve of them: six where the rural tenure argument lives, six where the urban one does, with Kenya, Ethiopia and Nigeria in both.
| Country | Term one | Term two | Term three | Outside agriculture (%) | Informal (%) | Urban share | Largest city | GDP per head ($) | Confidence |
|---|---|---|---|---|---|---|---|---|---|
| Ethiopia | 3.46 | -1.58 | 5.91 | 39.0 | 77.7 | 24.1 | Addis Ababa, 4.9m | 987 | low |
| Rwanda | 2.83 | 0.65 | 3.26 | 63.5 | 84.3 | 30.9 | Kigali, 3.6m | 1,128 | high |
| Kenya | 2.94 | -1.17 | 2.84 | 53.5 | 86.5 | 32.2 | not carried | 2,558 | high |
| Ghana | 2.52 | -1.56 | 3.48 | 64.8 | 78.1 | 58.9 | Accra, 5.4m | 3,271 | medium |
| Côte d’Ivoire | 2.88 | 0.11 | 2.90 | 53.7 | 92.1 | 54.6 | Abidjan, 6.7m | 3,006 | medium |
| Nigeria | 2.90 | 0.29 | -1.94 | 65.9 | 93.1 | 63.8 | Lagos, 16.1m | 1,223 | low |
| Senegal | 3.51 | 1.50 | 0.27 | 69.4 | 89.2 | 55.8 | Dakar, 4.4m | 1,936 | high |
| Mozambique | 3.25 | -0.47 | 0.57 | 26.9 | 95.5 | 37.2 | Maputo, 3.0m | 623 | medium |
| Tanzania | 3.55 | 0.03 | 1.92 | 34.9 | 90.8 | 36.9 | Dar es Salaam, 6.9m | 1,292 | medium |
| Egypt | 1.96 | 0.07 | 2.26 | 82.0 | 68.6 | 42.9 | not carried | 3,379 | high |
| South Africa | 1.61 | -0.45 | -0.48 | 94.6 | 34.8 | 63.8 | Johannesburg, 11.0m | 6,769 | high |
| Democratic Republic of the Congo | 3.38 | -0.18 | 1.81 | 41.1 | 97.3 | 45.1 | Kinshasa, 11.9m | 871 | low |
| Continental median | 2.89 | -0.15 | 0.74 | 59.0 | 89.1 | 45.7 | 1,678 |
Table 22.1: the twelve countries this chapter argues about. The three identity terms are annual growth rates in percentage points over 2014 to 2024 and sum to implied GDP growth; the share columns never enter that sum. Term one is the working-age population aged 15 to 64; term two is modelled employment aged 15 and over divided by that population. The urban-share column is the share of population living in areas each country’s own statistical office calls urban, read from the card at 2025; it is a different delineation from the largest-city column and the two are never combined. The largest-city column is the agglomeration the card carries, on a built-up-area rule rather than an administrative boundary, and is empty for Kenya and Egypt because the database’s newer delineation gives those two a figure the book will not print; both gaps are in the book’s own data layer and are not claims about these countries. The median row is taken column by column and is not a country. Sources: UN World Population Prospects 2024, medium variant; ILOSTAT modelled estimates, November 2025; IMF World Economic Outlook, April 2026; World Bank World Development Indicators for the urban share; the book’s data-quality table; all via the country cards.
The twelve hold 60.4 percent of Africa’s people, some 913 million, and produce 57.3 percent of its output, so this is a majority of the continent rather than a convenience sample. Five carry a high confidence flag, four medium and three low, and the three low ones are Ethiopia, Nigeria and the Democratic Republic of the Congo, whose last censuses were in 2007, 2006 and 1984. Every urban statistic about those three, including every share in this chapter’s figures, has a population projection in its denominator.
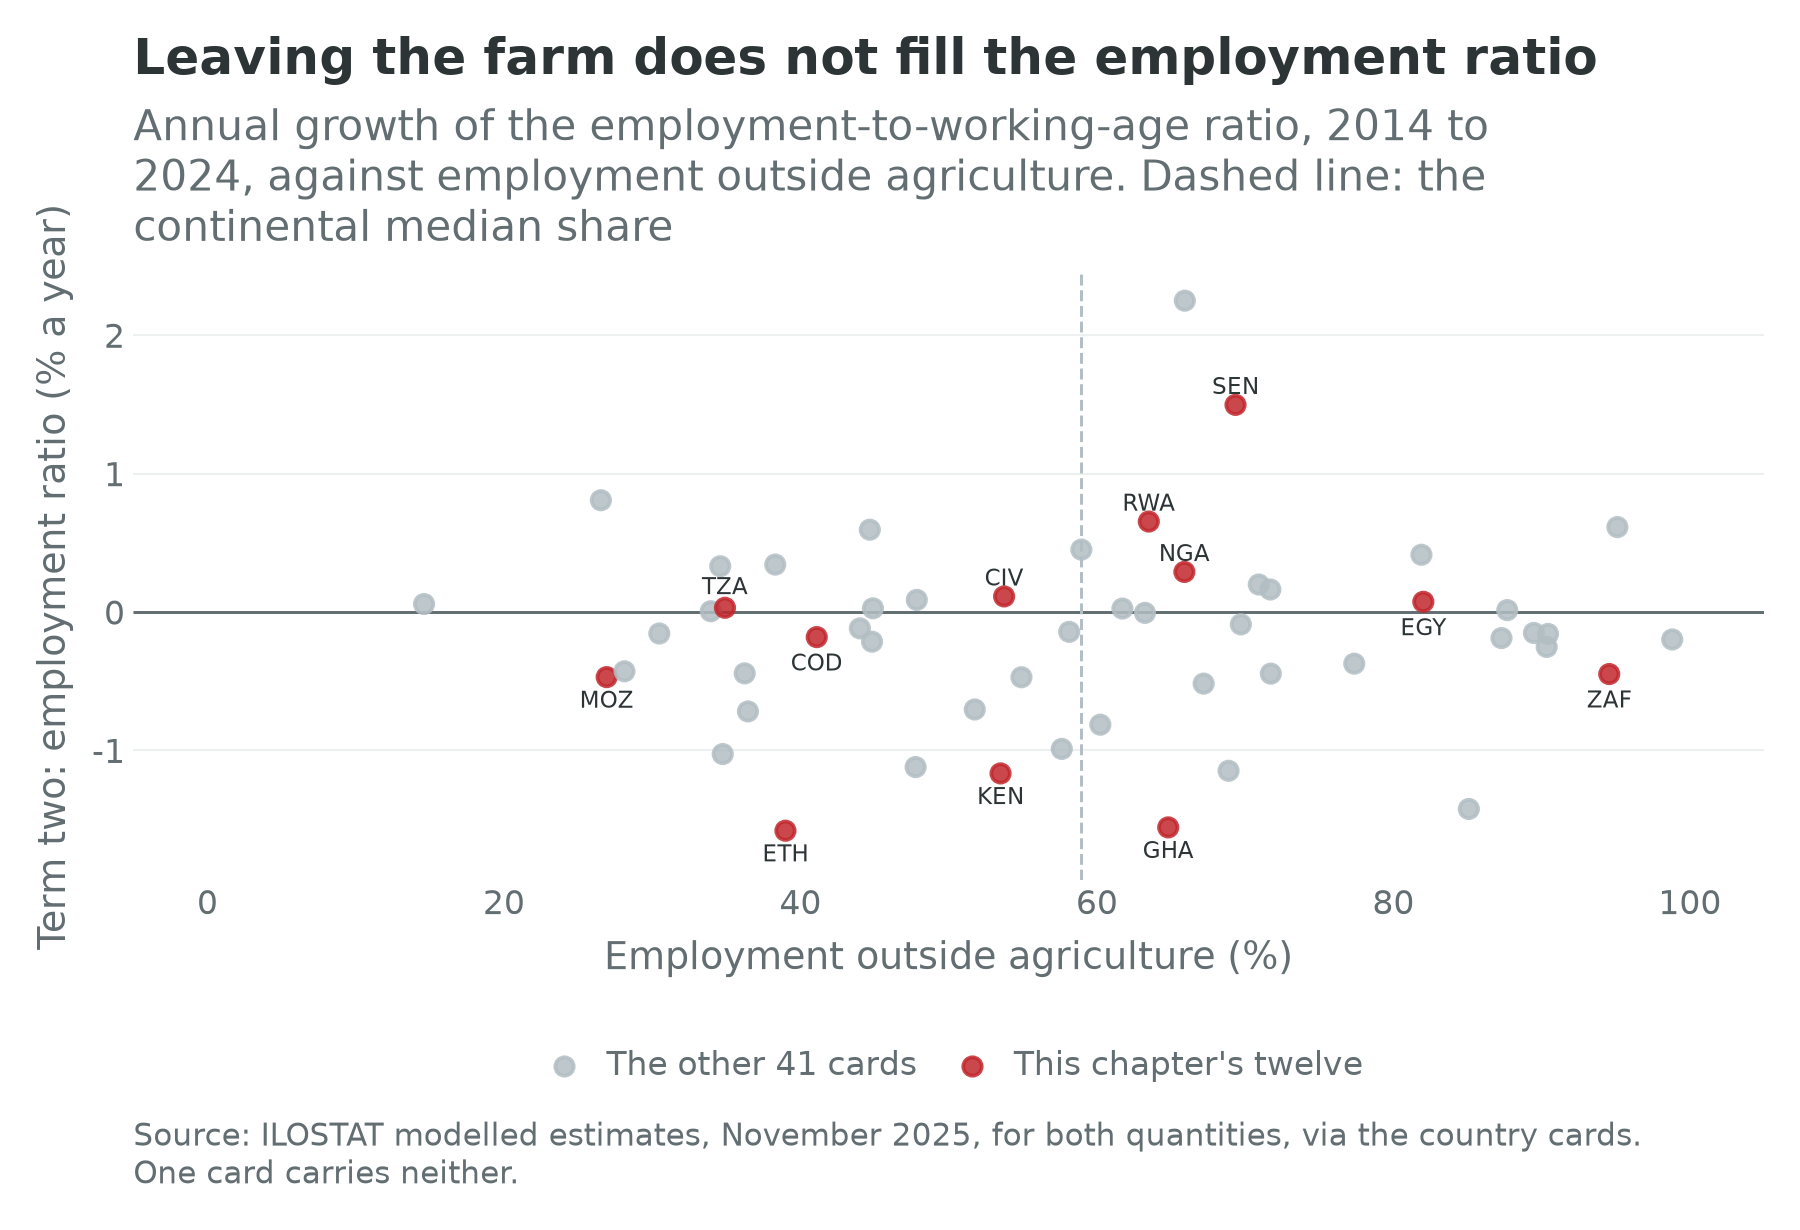
Figure 22.1 is the chapter’s hinge, and its message is a flat line. Across the 53 cards the non-agricultural employment share and the identity’s second term correlate at 0.06, which is nothing. Correlation with the third term is 0.17, barely more. Chapter 11 reported the same pair from the agricultural side. What the pair means for this chapter is that the great movement of Africans off the land, which is real and which is what the urban half of this chapter is about, has not by itself raised the share of working-age Africans in work or the output of the ones who are. Where they arrive matters, and where they arrive is decided by the price of land.
Customary tenure, and the administration inside it
The standard Western reading of African land is an absence: no title, no register, no market, therefore no security. Every part of that is wrong, and Sara Berry’s formulation is still the best correction. Rights in African land are not absent but negotiable: they are held through membership of a group, activated by use, defended by argument, and renegotiated at every succession and every marriage (Berry, 1993). A man farms because his father farmed; a woman farms because her husband’s lineage allocated her a plot; a stranger farms because he asked the chief and gave a token. None of this is written down and all of it is known.
Catherine Boone’s Property and Political Order in Africa is the book to read next, because it makes the point that decides the politics (Boone, 2014). Land regimes across the continent differ in one respect above all: whether the state has devolved the power to allocate land to a customary authority, or has kept it. Where it has devolved, as across most of West Africa and much of Southern and Central Africa, the chief, the earth priest, the lineage head or the traditional council allocates, adjudicates and taxes. Where it has kept it, as in Ethiopia since 1975 and in Nigeria since the Land Use Act of 1978, the district officer or the state governor does. The difference is not a matter of quaintness. It determines who can be excluded, whom a migrant has to satisfy, and whose consent a national government needs before it can lease a valley to an investor. Land conflict in Africa is very often a conflict between the two systems, and it is fought over which one applies.
This is Chapter 5’s bifurcated state, still in place. Mamdani’s argument was that colonial administrations governed the rural majority cheaply through a customary authority they licensed and frequently invented, and the chiefs in this chapter are that institution, holding information about who lives where that no ministry has (Mamdani, 1996). Chapter 5’s tax experiments in Kananga found precisely that: local chiefs collecting property tax outperformed central agents because they knew which household could pay (Balán, Bergeron, Tourek and Weigel, 2022). A chief is a land registry that will not print you a copy.
Two consequences follow, and they pull in opposite directions. The first is that customary tenure is more secure than the deed-and-register model gives it credit for. Jean-Philippe Platteau’s assessment of the evolutionary theory of land rights, which had predicted that population pressure would drive African systems spontaneously toward individual title, found the prediction only partly borne out and the welfare case for hurrying it along much weaker than assumed (Platteau, 1996). For an annual crop on a plot a household has farmed for two generations, a piece of paper adds very little.
The second is that the negotiability which makes customary tenure flexible also makes it a machine for producing disputes as land gets scarce. Pauline Peters made the argument the literature took twenty years to absorb: negotiability had been read as reassurance, when what negotiation produces under pressure is winners and losers, and the losers are systematically the young, the migrant and the female (Peters, 2004). Where land has value, the ambiguity that once absorbed conflict starts to generate it. That is the rural half of this chapter’s counter-case, and it is the mechanism underneath the farmer-herder violence that Chapter 36 takes up: a pastoral corridor is a customary right of way with no document, and it is the first thing a cultivator with a claim to enclose will enclose.
Thirty years of trying to write it down
Against that background, four generations of programme have tried to convert use into record.
Kenya ran the longest experiment and is the standing warning. Individual titling began under late-colonial policy in the 1950s and has been pursued for seventy years, and the recurring finding, which Chapter 9 states in one line, is that title alone did not deliver the promised credit or investment, because family and lineage claims persisted underneath the register and because banks would not lend against a smallholding anyway. Kenya’s second term over the decade was minus 1.17 percent a year, fiftieth of fifty-three, which is not caused by land policy and is evidence that land policy was not the binding constraint.
Ethiopia certified use rights without creating ownership. All rural land has been state property since 1975; households hold usufruct that cannot be sold and can be rented only under restriction. First-level certification from 1998 issued simple, unmapped holding certificates for more than 20 million plots in a few years (Deininger et al., 2008); second-level certification from 2005 began replacing them with parcel-level, mapped, digitally registered certificates, and its largest programme had demarcated more than 10 million plots in the four large highland regions by the end of 2018, against a target of 14 million (NIRAS, 2018). This is the largest land-registration operation ever run in Africa, and it was run by a state that had abolished the land market. The result is genuinely egalitarian, genuinely constraining, and compatible with the continent’s sharpest fall in the employment ratio.
Rwanda did the whole country in under four years. Between February 2010 and August 2013 the national land tenure regularization programme demarcated and adjudicated 10.3 million parcels, essentially every parcel in the country, against a target of 7.9 million, and approved about four in five for title, at a cost of between $5.47 and $6.48 a parcel, by using local para-surveyors, national aerial photography and adjudication in public on the hill rather than in an office (Gillingham and Buckle, 2014). It is the fastest and cheapest national registration attempted anywhere, and the institution it left behind is profiled below. Chapter 9 carries the political price: the state that could register 10 million parcels in under four years could also compel crop choice and village siting.
Ghana works through the customary authorities rather than around them. Roughly four fifths of Ghanaian land is stool, skin or family land held by traditional authorities, and the state’s answer has been the customary land secretariat: an office established by the land-owning stool itself, with central support, that records allocations, mediates disputes and reports revenue. There are about 110 in operation, and in January 2026 the Office of the Administrator of Stool Lands announced a programme to establish 300 more (Office of the Administrator of Stool Lands, 2026). This is the most interesting institutional design on the continent because it accepts Boone’s premise: it does not try to replace the authority that actually allocates land, it tries to make that authority keep books.
Mozambique nationalized the land and recognized the custom. The 1997 land law vests all land in the state and grants use rights instead: the direito de uso e aproveitamento da terra, or DUAT, the right to use and benefit from a piece of land, which communities acquire through customary occupation without a formal title, and which companies acquire for fifty renewable years subject to community consultation, an approved plan and an environmental licence (Government of Mozambique, 1997). On paper this is the most progressive land law in Africa. In practice the consultation requirement has proved a low bar, and the country’s rural land conflicts are mostly arguments about what a consultation was. Tanzania’s Village Land Act of 1999 is structurally similar, vesting village land in the village assembly and providing for certificates of customary right of occupancy.
These are five answers to one question, and the question is not how to give people title but who is allowed to say who holds what. Kenya answered the registrar; Ethiopia the state; Rwanda the state, at speed, with the village watching; Ghana the stool, with a filing cabinet; Mozambique the community, with a lawyer’s definition of one.
What the record says about what any of it bought
The evidence is better than the debate suggests, and it points three ways at once.
On investment, tenure security works, and it works on the long-payback margin. Goldstein and Udry’s study of Akwapim in southern Ghana is the founding result and still the sharpest (Goldstein and Udry, 2008). Fallowing is the investment that matters there, because a long fallow restores fertility and a plot left fallow is a plot somebody else can claim. Farmers who held political office in the local hierarchy, and who were therefore secure against reallocation, fallowed longer and earned substantially higher profits than farmers who did not, with women systematically on the insecure side. Tenure security in that setting is not a legal category. It is a position in a political hierarchy, and its return is measurable in cocoa.
The randomized evidence agrees and adds nuance. Ali, Deininger and Goldstein’s evaluation of Rwanda’s registration pilot found higher investment in soil conservation, with the largest effects among female-headed households (Ali, Deininger and Goldstein, 2014). Deininger, Ali and Alemu found the same pattern for Ethiopia’s certification: more investment, more land-rental activity, better perceived security (Deininger, Ali and Alemu, 2011). And Benin’s rural land plan, which demarcates and maps village land without issuing individual titles, raised long-term investment on demarcated plots by something in the range of 23 to 40 percent, concentrated among the households whose starting tenure was weakest (Goldstein, Houngbedji, Kondylis, O’Sullivan and Selod, 2018). The Benin result matters most because it separates two things that are usually bundled: a public act of demarcation that lowers expropriation risk changes behaviour even when no certificate is issued. What the programme sold was not a document. It was a reduction in the probability that somebody else would take the plot.
On rental markets, formalization does something quieter and possibly more useful. A household with a recognized claim will rent land out; a household without one will not, because a tenant is exactly the person who might later claim the plot. Rental markets move land from households with more land than labour to households with more labour than land, which is a straightforward productivity gain, and both the Ethiopian and Rwandan evaluations find participation rising after registration. It is the least glamorous finding in the field and one of the few that survives replication.
On women, the reforms have moved further on paper than in the plot. Most African constitutions now bar discrimination in property and successive statutes provide for joint titling of spouses; Rwanda’s registration recorded husband and wife as a matter of course, and Ethiopia’s certificates carry both names and a photograph of both holders. The Benin evaluation contains the uncomfortable footnote. Women in treated villages did shift their fallowing, narrowing the gender gap in that soil investment, but they also moved effort away from the newly demarcated land and toward parcels outside the village, because those were the parcels still at risk and therefore the ones that had to be guarded (Goldstein, Houngbedji, Kondylis, O’Sullivan and Selod, 2018). Securing some of a household’s land reallocates its defensive effort rather than releasing it, a lesson about partial formalization that applies to cities as much as to villages.
On credit, the record is close to a refutation. Hernando de Soto’s argument that the poor world’s dead capital could be brought to life by titling, so that a house becomes collateral and collateral becomes a business loan, was the most influential land-policy claim of the last thirty years (de Soto, 2000). The African evidence against it comes from three directions. Banks do not want smallholder land as collateral, because foreclosing on a farm in a district where the family has lived for a century is not a legal problem but a physical one. Title is not the constraint on lending anyway, as Chapter 16 argues at length: the constraint is the cost of screening a borrower and enforcing a small claim. And the one randomized study that looked hardest, the Sri Lankan formalization experiment Chapter 6 describes, found that the most common reason firms did not register was a land-ownership problem rather than a fee, which is de Soto’s diagnosis exactly, and that follow-up surveys found higher mean profits driven by a few fast-growing firms rather than a broad payoff to registration (De Mel, McKenzie and Woodruff, 2013). Kenya has titled for seventy years and, in December 2024, had 30,016 outstanding mortgage loans in a country of 56 million people (Central Bank of Kenya, 2025). Title is not what is missing.
The honest summary is therefore a three-part answer. Formalization raises investment, modestly and on the long-payback margin. It thickens rental markets. It does not create credit. And it reliably does one thing nobody lists as a benefit, which is that it tells the state who is where.
The land rush, and what happened to it
Between 2007 and 2012 a great deal was written about a global land grab, and the sharpest empirical statement of it came from the World Bank itself, in a report that documented the scale of the acquisitions and was unusually candid about how badly most of them were being done (Deininger and Byerlee, 2011). Africa was the epicentre. The register that emerged, the Land Matrix, is a crowd-sourced database of reported deals; its second analytical report, in 2016, counted 1,004 concluded transnational agricultural deals worldwide covering 26.7 million hectares, of which Africa held 422 deals, about 42 percent, and 10 million hectares, about 37 percent of the area (Land Matrix, 2016).
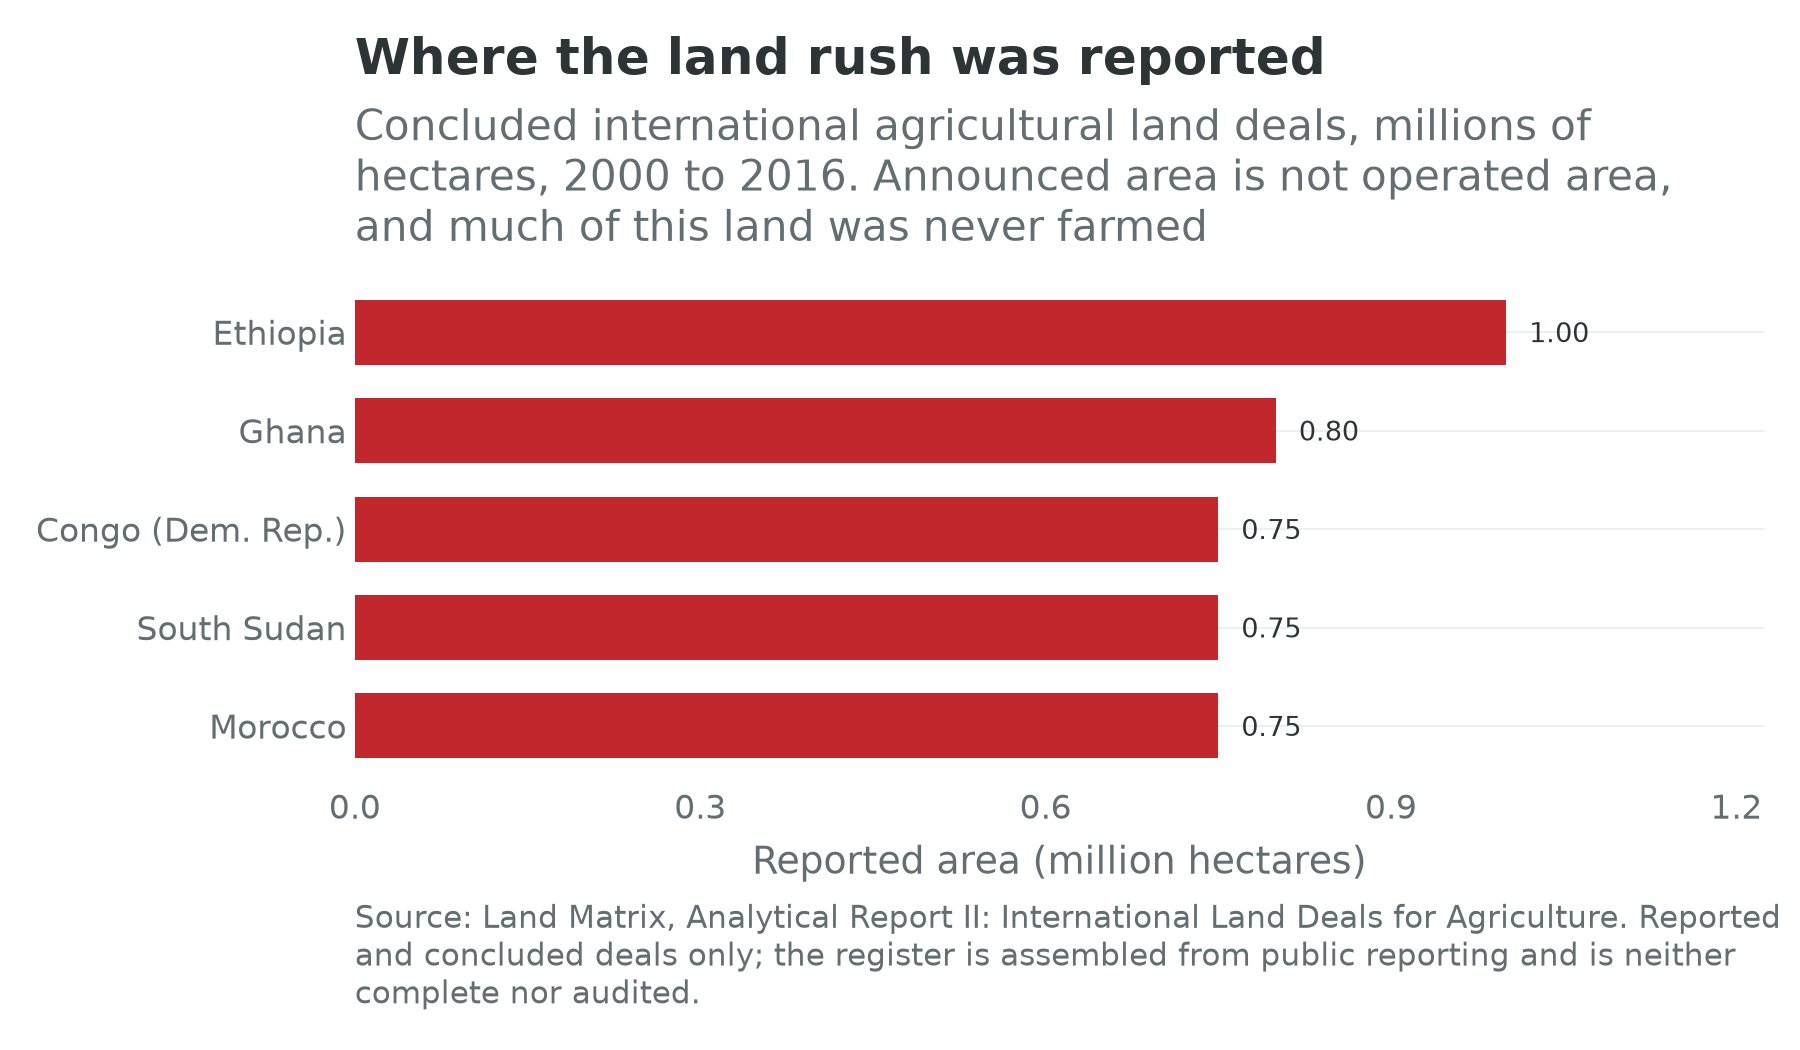
Figure 22.2 carries two qualifications and then a third that matters more. A register of reported deals is not a cadastre; it records what was announced, and announcements are made by people raising money. Its vintage is old: the analytical report behind the country figures covers 2000 to 2016, and the wave it measures had already broken by the time it was published. The third changes the argument. Most of these deals did not happen.
Three cases carry the point.
Gambella. In 2010 an Indian agribusiness took a fifty-year lease over 100,000 hectares in the Ethiopian lowlands, having first been allocated 300,000, in a region whose Anuak and Nuer inhabitants held no titles and were being moved into planned villages under a national villagization programme. The federal agency found it had developed about 1,200 hectares, and terminated the lease in December 2015 (Yewondwossen, 2016). The displacement was real, the environmental damage was real, the villagization was real, and the farm was not.
ProSavana. A Brazilian and Japanese programme along Mozambique’s Nacala corridor proposed to bring something on the order of 14 million hectares into commercial cultivation, on an explicit analogy with the Brazilian cerrado. It generated a transnational campaign of Mozambican, Brazilian and Japanese peasant organizations, and in July 2020 the Japanese foreign ministry announced its termination (Government of Japan, 2020). Nothing at scale was planted.
Ndiaël. In 2010 a Senegalese company backed by an Italian group received 20,000 hectares in the Senegal River valley for biofuel feedstock, was moved after protests in which two villagers were killed, and spent the following decade in litigation and stagnation (GRAIN, 2013).
The pattern is not that the land rush was imaginary. It is that a large share of it consisted of leases signed by governments with the legal power to sign them, over land that people were living on, to investors who could not farm it. The cost to the displaced was paid in full and the promised output was never delivered, which is the worst of both cases and a direct consequence of the legal structure this chapter began with. Where the state owns the land and nine tenths of the rural population hold no document, the transaction cost of signing away a valley is a signature, and the political cost falls on people whose claim the paperwork does not record.
Two footnotes. The pastoral version is the most dangerous, because rangeland is the tenure category formalization handles worst: a corridor used seasonally by herders is invisible to a demarcation exercise that maps parcels, and once the parcels are mapped the corridor is gone. Chapter 36 carries the Sahel. And Zimbabwe remains the one African redistribution at East Asian scale; Chapter 9 states the finding that matters, which is that the careful field research found neither the collapse the press reported nor the success the government claimed (Scoones et al., 2010).
How a plot becomes a house
Now cross the frontier into the city, where the same tenure system meets a price.
Suppose you want to build a house on the edge of Lagos. The land you are buying is almost certainly family land, held by a lineage that farmed it when the city was thirty kilometres away. You will deal with the omo onile, literally the children of the landowner, the members of that family who assert the right to sell and to be paid at every stage afterwards: for the survey, for the foundation, for the roof, for the fence. Their claim is not fraudulent, though fraudulent versions are common, and it is not enforceable in the way a lien is enforceable. It is enforced by the ability to stop work. You will pay them, then commission a survey plan, then attempt to obtain the governor’s consent and eventually a certificate of occupancy, because under the Land Use Act of 1978 all land in a Nigerian state is vested in the governor and what you are buying is at best a ninety-nine-year leasehold (Federal Republic of Nigeria, 1978). Most buyers never complete the last step. More than seven in ten Nigerian landlords held no certificate at all as of 2019, and less than 3 percent of the country’s land is formally registered (Africa Check, 2023).
The same structure, in different vocabulary, is what a buyer meets in Accra, where the stool and the family both have claims and selling the same plot twice is common enough to have a name; in Nairobi, where colonial reserves, settlement schemes and the land register between them produce plots with two valid chains of title; and in Kinshasa, where a customary chief’s attestation, a fiche parcellaire from a land office and a formal contract are three documents describing the same ground with different degrees of enforceability, in the state Chapter 31 describes.
Three economic points follow, and the urban half of this chapter turns on them.
Transaction cost is the tax. A market in which every purchase requires settling four claims, one of which reappears when you pour the foundation, imposes a levy on construction that no budget records. It falls hardest on the small builder, because the large developer can afford the lawyers and, more to the point, can buy the whole neighbourhood at once. This is one reason African urban development bifurcates into self-built informality at one end and gated estates at the other, with almost nothing between.
Formalization is expensive precisely where it is worth most. Until it was discontinued, the World Bank’s Doing Business survey scored the procedures, days and cost of registering a property transfer, and African economies clustered at the wrong end on all three; the programme was ended in 2021 after an inquiry into data irregularities and no successor covers the same ground (World Bank, 2021). The Land Governance Assessment Framework, a slower instrument that scores a country through a panel of national experts, has been applied in more than forty countries and reaches the same conclusion from the inside: the constraint is not the law but the cost, the queue and the discretion (World Bank, 2026d).
The peri-urban conversion rent is the largest transfer in African urban economics and nobody measures it. A hectare of maize on the edge of a growing city is worth a few thousand dollars. The same hectare, subdivided, serviced and legally residential, is worth a multiple of that, and the multiple is the reward for an administrative act. Whoever controls the act, a governor, a chief, a lands officer or a family head, captures the difference or sells the right to capture it. Chapter 24’s Lekki, Chapter 27’s desert cities and Chapter 29’s corridor are three places to watch it happen.
Where the cohort actually lives
Now the aggregate. Africa’s working-age population rises from 867 million to 1,559 million between 2024 and 2050, and Chapter 10 established that most of the movement inside that total is internal rather than international. Where does it go? The cards answer the level but not the flow: every card carries the share of its population living in towns today, from 17.6 percent in Malawi to 92.1 in Gabon, with a continental median of 45.7. None of them carries an urban growth rate, a migration flow or a destination, so the question of where the cohort goes is still one for a published series rather than for the data layer. Figure 22.3 plots such a series against income from the cards: its urban shares are the card’s own indicator read at the card’s own year, 2025, and its slum shares the World Bank’s republication of UN-Habitat, read at 2022.
Three readings, in ascending order of how much they matter.
The first is that the urban share tracks income loosely and the slum share tracks it a good deal more closely. Across the twelve, the urban share correlates with the logarithm of income per head at 0.53; the slum share, on the same twelve, at minus 0.72 (World Bank, 2026g). Being urban is a weak predictor of being rich on this continent; being badly housed is a much better predictor of being poor. The median urban share among the twelve is 44.0 percent and the median slum share 47.3 percent, so the representative country here has a little over two fifths of its people in towns and about half of those in housing that fails at least one of UN-Habitat’s four tests: durable structure, sufficient living space, improved water, improved sanitation.
The second is that the slum share is a definition as much as a condition, and Egypt is where you can see it, at 3.8 percent, the lowest of the twelve by a distance and a figure the same series put below 1 percent as recently as 2020 (World Bank, 2026g). Anyone who has walked through the ashwa’iyyat, the self-built districts that absorbed Cairo’s growth from the 1970s and hold the majority of its residents, will find that number difficult, and it is not wrong: those districts are brick and concrete, dense but not overcrowded by the threshold used, and piped for water and sewerage, often after the fact. What they lack is legal standing, which the four tests do not measure. Chapter 27 carries what the Egyptian state has done about them. The indicator measures the physical adequacy of housing and not the security of its tenure, and on this continent the second is the binding one.
The third is the aggregate. UN-Habitat’s estimate is that about half the urban population of Sub-Saharan Africa lived in slums in 2020, some 265 million people by 2022, the largest such population of any region and the one growing fastest (UN-Habitat, 2022). Set that beside Chapter 10’s cohort arithmetic and the shape of the century’s urban problem is visible without any forecasting at all.
The deficit numbers, and why not to trust them
Every African housing ministry quotes a deficit, and Nigeria’s is worth taking apart because the anatomy generalizes. The headline is 28 million units, a private-sector and multilateral estimate that has doubled since 2010; the Nigerian government’s own technical committee, reporting more carefully, put the deficit of units genuinely absent at about 14.9 million and separately classified about 15.2 million existing homes as structurally inadequate (Centre for Affordable Housing Finance in Africa, 2024; Obiowo, 2025; Addeh, 2026). Those are two problems with two remedies, and adding them produces a number that supports neither. The finance side is unambiguous: Nigerian mortgage lending is under 1 percent of GDP and mortgage rates run from 20 to 32 percent a year, so the deficit will not be closed by lending against it.
A housing deficit is in any case a strange object, the difference between the stock and a normative standard, evaluated at prices nobody can pay. What a policymaker needs is simpler: how many serviced plots came onto the market this year, at what price, with what tenure, and how far from the jobs. Almost no African city publishes that, and those that do publish it for the formal market only.
Taxing the ground
If land is the fastest-growing rent on the continent, the obvious question is whether the state can tax it. The property tax is the textbook answer, because land cannot be moved offshore, and Africa collects almost none of it.
Chapter 5 opened with the number. In Kananga, a provincial capital of about a million people in the Democratic Republic of the Congo, 0.1 percent of households paid the property tax before a research team helped the province knock on doors; a randomized campaign raised compliance to 11.6 percent, and taxed citizens then became measurably more likely to attend town-hall meetings and to evaluate officials (Weigel, 2020). Chapter 31 reads that as evidence about a thin state. Read as land policy it says something else: a property tax is a register, and a register is what the state does not have.
Two African cities have shown what happens when it builds one.
Freetown. From 2019 the city council, working with tax researchers, rebuilt its property register from scratch. Satellite imagery identified and measured every building; enumerators visited each one, fixed its coordinates and scored the quality of walls, roof and windows; roofline area and quality score together produced a valuation with no professional valuer anywhere in the process. When the council approved the new valuation in April 2020, the roll had roughly doubled, from about 57,000 to about 110,000 properties, and potential revenue had risen more than fivefold, in line with a mayoral target of raising revenue from 7 billion to 35 billion leones (Grieco et al., 2019). The distributional effect is the part usually left out: the old rateable-value formula had drifted, and the new one more than tripled the bill on the top fifth of properties and more than halved it on the bottom fifth (Prichard, Kamara and Meriggi, 2020). Sierra Leone’s card is no story of national success, with a second term falling at 0.47 percent a year, a low confidence flag and a last labour-force survey in 2018. A city can do this in a country that cannot.
Lagos. The counter-example is instructive because the technical work was the easy part. Lagos State’s Land Use Charge Law of 2018 consolidated the property taxes, updated the valuation method and raised the rates. The political reaction was severe, and in 2020 the state reverted to the pre-2018 rates while keeping the 2018 valuation method, waiving penalties for 2017 to 2019 at a cost put at about 5.6 billion naira (Lagos State Government, 2020). The valuation survived and the rate did not, which is the shape of most African property-tax reform: the register is a technical problem that is now cheap to solve, and the rate is a political problem that is not.
The wider version is land value capture. If a public investment raises the value of nearby land, the state can in principle finance it out of the increase, through a betterment levy, a sale of development rights, or by owning the land before it builds, which is how a good deal of Hong Kong and Tokyo rail was paid for. African applications have delivered very little. The World Bank’s assessment of bus rapid transit finance in Sub-Saharan Africa concludes that the value around stations and depots is real and that capturing it needs an integration of transit and land-use planning, and an institutional coordination, that the cities running BRT do not have (World Bank and PPIAF, 2021). Dar es Salaam and Lagos run the continent’s most successful corridors and neither finances them from the land they made valuable. You cannot levy betterment on parcels you have not registered, owned by people whose claim is a family receipt.
Expansion, new cities, and the bulldozer
The physical form all of this takes is sprawl. The Atlas of Urban Expansion, which measured built-up area from satellite imagery for 200 cities holding about 70 percent of the world’s urban population, found densities in developing-country cities falling at roughly 2 percent a year through the 1990s, from an average of about 135 persons per hectare in 2000, and projected that if the trend continued the developed land area of those cities would more than triple by 2050 (Angel, Parent, Civco and Blei, 2011). African cities are dense at the core and sprawling at the edge, and the edge is where the cohort arrives.
Two responses to that have been tried, and they are opposites.
Build a new city. The last fifteen years have produced a remarkable crop: Eko Atlantic on reclaimed land beside Victoria Island, designed for about 250,000 residents at the top of the Lagos income distribution and described in Chapter 24; Konza Technopolis and Tatu City outside Nairobi; Kigali’s Vision City; Egypt’s New Administrative Capital, which Chapter 27 assesses; Diamniadio outside Dakar; and a long tail of Chinese-built estates, from Kilamba outside Luanda onward, whose common early problem was that they were priced for a middle class that did not exist yet. Read as urban planning, most of these avoid the land problem rather than solving it: you cannot assemble a hundred hectares inside the built-up area without settling ten thousand claims, and you can assemble ten thousand hectares of scrub outside it with one. Read as land plays, which is what they mostly are, they are a bet that the conversion rent will accrue to the developer. What separates Tatu City, profiled below, from Konza is not the master plan but the tenure: one is a private freehold assembled by a developer who then sold serviced plots with clean title, and the other is a state project whose land was never the constraint and whose tenants were.
Clear the old one. The other response is demolition, and its record is the ugliest material in this chapter. Addis Ababa’s corridor development project rebuilt 40 kilometres of the central city in a first phase completed in September 2024 and launched a second covering 132 kilometres, and Amnesty International documented at least 872 people forcibly evicted from two sub-cities in a single month, with satellite imagery confirming about 29 hectares of dense built-up area cleared (Amnesty International, 2025); Chapter 29 carries it. Abuja has demolished settlements inconsistent with its master plan periodically since the 1990s. In Nairobi, after the floods of April and May 2024, the government ordered everyone within 30 metres of a riverbank to leave within 48 hours (Wakhungu et al., 2024); a schoolboy was killed by a bulldozer during the demolitions, and in October the High Court found the evictions unlawful for want of proper notice and ordered compensation for residents of Mathare, Gwa Kairu, Mukuru kwa Reuben and Kiamaiko (Oduor, 2024).
Two things are true about these episodes at once. Riverbanks in Nairobi genuinely flood, and Addis Ababa genuinely needed a working central road network. And the reason the people living there had no recourse is the subject of this chapter: an occupant with a certificate is compensated, and an occupant with a family receipt is cleared. Formalization’s most consequential effect is not on credit, which it does not produce, or on investment, which it modestly raises. It is on what happens when the state wants your ground.
Behind all of it sits a capacity gap that is rarely named. A city of five million people growing by four percent a year requires the survey, servicing and release of tens of thousands of plots a year, and African municipal planning departments are staffed at a fraction of what that needs. The result is not an absence of planning but planning that arrives after the building, which is the most expensive order in which to do it.
Three institutions
Rwanda’s Land Administration Information System
The most consequential land institution built in Africa this century is a database. Rwanda’s registration programme could have ended in 2013 with 10.3 million parcels adjudicated and a paper archive; instead the state built a national Land Administration Information System, operational from June 2012, and equipped all thirty district land bureaux to record transactions in it (Gillingham and Buckle, 2014). The hard part of land administration is not the first registration but the second: a register that is not updated when land changes hands is a photograph, and most African registers are photographs. Rwanda’s is the continent’s clearest attempt to build a film. Its identity numbers are the ones Chapter 9 calls the recipe reading well, a second term of 0.65 percent a year and a third of 3.26. The counter-case is Chapter 31’s and belongs on the page: a state that can register every parcel in under four years can also decide what you plant on yours.
Rendeavour and Tatu City
Rendeavour is a private urban land developer, with shareholders from the United States, New Zealand, Norway and the United Kingdom, that assembles very large tracts on the edges of African cities and sells serviced plots inside them. Tatu City, its flagship, is a 5,000-acre development on Nairobi’s northern edge and Kenya’s first operational special economic zone (Tatu City, 2021); by 2025 it held more than 100 companies, about 25,000 people lived, worked or studied there each day, and a Nairobi mall developer announced a $500 million, 60-acre scheme inside it (Tatu City, 2025). Firms there pay corporation tax at 10 percent for ten years and 15 percent for the next ten against a standard 30, and, under the national zone schedule, are exempt from import declaration fees, stamp duty and value-added tax on qualifying purchases (Konza Technopolis Development Authority, 2026).
Read it in two directions, as the book reads every megaproject. Rendeavour’s product is not buildings but tenure: it buys land with a contested history, spends years clearing the claims, installs roads, water, power and fibre, and sells a plot a bank will lend against and a manufacturer will build on. That is this chapter’s missing institution, supplied privately to those who can pay for it. The other direction is that the price is the point. A development whose corporate residents pay a third of the standard tax rate, on land whose conversion rent accrued to its assembler, is a transfer from the public purse and the previous occupants to a private balance sheet, and 25,000 people a day living, working or studying there is a small number against a country whose second term fell at 1.17 percent a year over the decade. Which reading dominates depends on whether the serviced land would otherwise have come to market at all.
The Kenya Mortgage Refinance Company
Kenya set up a mortgage liquidity facility in 2018, capitalized by the Treasury with development-finance participation, to buy mortgages from banks and saccos and refinance them long, on the theory that the constraint on housing finance was the maturity mismatch between deposits and home loans. By August 2025 it had lent about 21.4 billion shillings and supported about 4,500 affordable home loans, on the National Treasury’s figures (Muiruri, 2025). Set that against the market it was built to move: 30,016 outstanding mortgage loans in the whole country in December 2024, up from 29,260 a year earlier, on a book of 279.3 billion shillings (Central Bank of Kenya, 2025). Seven hundred and fifty-six additional mortgages in a year, in a country of 56 million people.
The institution is well designed and the diagnosis behind it is wrong, which makes it the sharpest illustration of this chapter’s argument. The binding constraint is not the tenor of bank funding. It is that the households who need houses have incomes no lender will underwrite, on plots whose title no lender will accept, in cities where the serviced plot is itself the scarce good.
What the experiments say
Does formalizing land raise investment, credit, or only the state’s information?
Land is one of the few areas of development policy where the randomized evidence is genuinely decisive, and its verdict is narrower than either side of the argument wanted.
Demarcation raises investment even without a certificate. Goldstein, Houngbedji, Kondylis, O’Sullivan and Selod (2018) randomized Benin’s rural land plan, a village-level demarcation and mapping exercise that issues no individual title. Long-term investment on demarcated land rose by 23 to 40 percent, concentrated among households whose starting tenure was weakest. The mechanism is expropriation risk rather than collateral, which is why the effect survives the absence of a document, and the finding on women is that they shifted effort toward the parcels still at risk rather than releasing it. Ali, Deininger and Goldstein (2014), on Rwanda’s registration pilot, is the closest African replication, with soil-conservation investment rising most among female-headed households.
Taxing property builds the register and, unexpectedly, the citizen. Weigel (2020) raised property-tax compliance in Kananga from 0.1 to 11.6 percent by knocking on doors, and found political participation rising by about a third among those taxed; Balán, Bergeron, Tourek and Weigel (2022) then showed that local chiefs collected about 40 percent more than central agents, because they knew who could pay. Chapters 5 and 31 read these as state-capacity results. Read as land policy they say that the cheapest way to find out who holds what is to try to tax them.
Freetown and Lagos are the natural experiment beside them. One city rebuilt its register from satellite imagery and enumerator visits, doubled the roll and made the bill sharply more progressive; the other rebuilt its valuation method, raised the rate, and had the rate reversed within two years. Neither is randomized, and the pair is the cleanest available demonstration that the technical constraint has fallen and the political one has not.
Giving people a formal house does not give them a livelihood. Franklin’s study of Addis Ababa’s condominium lottery, which randomly allocated the right to buy a state-built apartment and then randomized the neighbourhood, found that many slum households valued the apartments above what they cost to build, and that winning did not harm labour-market outcomes, schooling or consumption (Franklin, 2025). The comparison case is Barnhardt, Field and Pande (2017), who followed the winners of a Mumbai slum-relocation lottery for fourteen years: better housing, no change in tenure security, income or human capital, measurable losses from separation from family and caste networks, and 34 percent of winners never taking up the flat with 32 percent later leaving it. A house on the periphery is a wealth transfer first; whether it is also a labour-market cost depends on what the move severs.
Planning the plot in advance beats upgrading it afterwards. Michaels, Nigmatulina, Rauch, Regan, Baruah and Dahlstrand Rudin (2021) exploited Tanzania’s sites-and-services programme of the 1970s and 1980s, which laid out roads and plots in twelve new neighbourhoods in Dar es Salaam and six secondary cities and upgraded twelve existing ones, and compared them decades later with matched areas. The newly laid-out areas ended up with larger, more regularly arranged, more densely built and better-connected housing. The intervention that worked was the cheapest available and it had to happen before anybody arrived.
Put the seven together and the answer to the box’s question is: investment, yes, modestly, through the expropriation-risk channel; credit, no; and information, decisively, which is the effect nobody was arguing for and the one with the largest consequences. A state that knows who holds what can tax it, can compensate for it, and can also clear it.
Land in two worlds
Chapter 1 set out the assumption underneath the identity and the world in which it fails: one in which the frontier of production is a stock of machines and energy rather than a stock of workers, so that the marginal worker stops being what growth is made of. No chapter in this book changes meaning as completely as this one when the assumption goes.
In the labour-abundant world, land is an input and tenure is a productivity policy. Secure the farmer and she plants a tree; service the plot and the worker can reach the factory; register the parcel and the city can tax it and build the road. Everything above is about making land work harder for the people on it, and the identity says why it matters: the rural half raises term three, the urban half decides whether term two can rise at all.
In the labour-redundant world, land stops being an input and becomes a claim. Chapter 1 named the four holdings that keep their value when the frontier stops needing workers: people, whose value is the open question, land, sun and ore. Two of the four are this chapter’s subject. Food is a physical need no model satisfies, so farmland holds its value or gains it; the solar belt from the Sahara to the Kalahari is ground, and a gigawatt of panels is a land transaction before it is an energy one; and the carbon in the Congo basin peatlands and the Miombo woodland is a property right waiting for a registry, which Chapter 34 takes up.
The consequence is the reason this chapter sits in Part IV rather than in an appendix. If income stops arriving through wages, it arrives through ownership, and on this continent ownership of the single largest asset is undocumented for nine tenths of the people who hold it. A world that pays for African land will pay whoever can produce a document, and under the arrangements described above that is the state in Ethiopia and Mozambique, the governor in Nigeria, the stool in Ghana, the registered holder in Rwanda, and in much of the rest whoever gets to the lands office first.
Two readings of the customary system follow, and they are exact opposites. On the first, it is the last defence against enclosure: a claim that cannot be sold because no single person has the standing to sell it is a claim that survives an offer, and Ethiopia’s non-transferable usufruct, whatever its costs in fragmentation and collateral, is why there is no Ethiopian land market for a foreign fund to enter. On the second, custom is the mechanism of enclosure rather than the defence against it, because it concentrates the power to alienate in a few authorities who can be paid, and because the people whose rights it holds have no document to wave when the lease is signed. Gambella and Ndiaël are the second reading in practice. Which describes the next thirty years is not a question about custom. It is a question about whether the record gets built, and who is on it when it is.
The urban version is Chapter 6’s. A consumption city, growing on a rent spent in it rather than on tradable output produced in it, is a city whose land value is a claim on the rent. In the labour-redundant world that is not a pathology to be grown out of but the general case, because the rent is where the income is. The distributional question becomes who owns the ground the rent is spent on, and the answer in every African city described here is a small number of families, a smaller number of developers, and a state that can convert one into the other with a signature.
Connections to Other Chapters
- Chapter 5 (States, Political Settlements, and Development Bargains) names land as one of the four mechanisms by which rents are distributed and supplies the bifurcated state whose customary authorities administer it; Chapter 6 (The Informal Economy) owns the consumption-city argument this chapter’s urban half rests on and the formalization experiments its tenure half extends.
- Chapter 9 (The Studwell Recipe Applied) tests the recipe’s first ingredient and states why East Asian land reform does not travel; this chapter is what replaces it. Chapter 10 (Labor, Youth, and Migration) hands over the internal-migration flow whose destination this chapter describes, and Chapter 11 (Agriculture and Agribusiness) borrows the investment margin and leaves tenure here.
- Chapter 14 (Energy) is where the solar land transaction lands, Chapter 16 (Finance and Fintech) where the collateral argument is settled, and Chapter 34 (Climate Finance) where carbon becomes a property right in African ground.
- Chapter 20 (Human Capital) and Chapter 21 (Capital and Sovereign Debt) are this chapter’s neighbours in Part IV: the other two factor markets, and the balance sheet the conversion rent does not appear on. Chapter 23 (Inequality, Social Protection, and Health) carries the distribution of the wealth this chapter is about.
- Chapters 24, 27, 29 and 31 (Lagos-Abidjan; Cairo-Suez; Addis-Djibouti; Where the State Is Thin) each contain a megaproject section that is partly a land story: Eko Atlantic and Lekki, the New Administrative Capital and the ashwa’iyyat, the corridor demolitions, and Kinshasa’s layered claims. Chapter 36 (What Could Go Wrong) carries the farmer-herder conflict that pastoral tenure produces when the corridor is enclosed.
Discussion Questions
The randomized evidence says that demarcation raises long-term investment through the expropriation-risk channel, that registration does not create credit, and that the most reliable effect of formalization is on what the state knows. A minister with a fixed budget can spend it on a national registration programme or on servicing peri-urban plots. Argue for each using the identity rather than an appeal to rights, then say which of Chapter 1’s two worlds your answer assumes.
Freetown rebuilt its property register and doubled the roll; Lagos rebuilt its valuation method, raised the rate, and had the rate reversed within two years. Using Chapter 5’s vocabulary of settlements and deals, say what distinguishes the two cases and what it would take for the Lagos rate to survive. Is the binding constraint the size of the affected group, its organizational power, or the absence of a visible service the tax buys?
This chapter offers two opposite readings of customary tenure in a world that pays for African land: the last defence against enclosure, and the mechanism of it. Take a country from Table 22.1, say which reading fits it, and name the observation before 2040 that would show you were wrong.
Try It
Open the three cards side by side: Ethiopia, Nigeria and Rwanda. These are the continent’s three largest land-administration experiments and three different answers to who may say who holds what: a state that certified use rights it will not let anyone sell, a federation that vested all land in its governors and registered almost none of it, and a state that registered every parcel in four years. For each, read the three identity terms, then the non-agricultural and informal shares, then scale.urban_share, then the four data-quality fields. Two of the three are under a third urban and the third is nearly two thirds, on shares the cards read at the same year, and the ordering is not the ordering of their land reforms. Then open the Growth Pole Map and switch on the confidence toggle. Write one paragraph on a single question: two of these three carry a low confidence flag, and both are countries whose land policy this chapter treats as consequential. What exactly would you refuse to conclude about them, and which one field, if the cards carried it, would change your answer most?
Data Exercise
Download all fifty-four cards from the country cards page on this site, as cards.csv or as cards.json if you want the release each number came from travelling beside it, and take this chapter’s urban and slum-share data file from the same page. Then do five things. First, join scale.urban_share from the cards to the urban share in the chapter’s data file, country by country, and confirm that the two agree to the decimal on all twelve and that the file’s year column reads 2025 throughout. They are one indicator read once. Then repeat the join against the previous revision of the same series, in which Rwanda reads 18.1 against the card’s 30.9, and write two sentences on what a change of vintage that size does to a scatter drawn before it. Second, using overlays.nonag_employment_share and identity.employment_to_wa_growth, reproduce Figure 22.1 and its correlation of 0.06, then repeat after dropping every card whose data_quality.confidence_flag is low or unset, and say whether the flat line survives. Third, redo the chapter’s first correlation on the card field instead of the file: regress scale.urban_share on the logarithm of scale.gdp_per_capita across all fifty-four and report it beside the file’s 0.53 on twelve; the series is the same in both, so say what is left to explain the difference. Fourth, correlate scale.urban_share with overlays.nonag_employment_share and then with identity.output_per_worker_growth, and say in three sentences why a chapter about structural change should find the first strong and the second near zero, and what that does to the phrase “urbanization without industrialization”. Fifth, take identity.working_age_pop_growth and scale.population_2050 for the twelve, compute the additional people of working age each will hold in 2050, and set that beside scale.urban_share: state, for the three fastest, how many people would have to be housed in towns by 2050 if the urban share simply held constant. Note which fields are null rather than zero, and never impute a null as a zero.
Data Sources and Further Reading
Key data sources
- The country cards for every identity term, share, income and data-quality field quoted here: UN World Population Prospects 2024 (medium variant, ages 15 to 64) for term one, ILOSTAT modelled estimates (November 2025) for terms two and three and the non-agricultural and informal overlays, the IMF World Economic Outlook (April 2026) for output and income per head, the World Bank Statistical Performance Indicators with the book’s census and survey table for the data-quality layer, and the World Bank’s urban-share series read directly for
scale.urban_share, which is on all fifty-four at 2025. The cards carry no land field of any kind. Their two urban fields are both filled, the urban share on 54 and the largest city on 50, and they are different delineations that the book never combines. - World Bank World Development Indicators for both of this chapter’s urban series: urban population as a percentage of total, which the World Bank takes from UN DESA’s World Urbanization Prospects, 2025 revision (UN DESA, 2025b), and which therefore rests on each country’s own definition of a town, and the share of the urban population living in slums, which republishes UN-Habitat’s Urban Indicators Database. This chapter’s data file is read from the same two series the cards are and at the same rule for which year to take, so the file and the cards agree to the decimal on all twelve; the two series do not end together, the urban one running to 2025 and the slum one, biennial, to 2022, and both years travel with every reading in the file. Africapolis supplies agglomeration populations on a built-up-area rule, used through the companion volume.
- The Land Matrix for reported large-scale land acquisitions: a crowd-sourced register of announced and concluded deals, not a cadastre; this chapter’s figure uses its 2000 to 2016 analytical report.
- The World Bank’s Land Governance Assessment Framework country reports, and the discontinued Doing Business “registering property” indicator, for the cost and procedure of a formal transfer.
- The Centre for Affordable Housing Finance in Africa yearbooks for housing-finance series, national central banks for mortgage counts, and the International Centre for Tax and Development for the Freetown property-tax work.
Further reading
- Catherine Boone, Property and Political Order in Africa (2014), for why land regimes differ and what the difference decides politically, with Sara Berry, No Condition Is Permanent (1993), for negotiability and Pauline Peters (2004) for what negotiability does under scarcity.
- Frank Byamugisha, Securing Africa’s Land for Shared Prosperity (2013), for the scale of the undocumented majority, and Jean-Philippe Platteau (1996) for the sceptical assessment of the evolutionary case for titling.
- Markus Goldstein and Christopher Udry (2008), for tenure security as a position in a political hierarchy, with Goldstein, Houngbedji, Kondylis, O’Sullivan and Selod (2018) and Deininger, Ali and Alemu (2011) for the randomized and quasi-experimental evidence; Hernando de Soto, The Mystery of Capital (2000), which should be read because it was believed.
- Klaus Deininger and Derek Byerlee, Rising Global Interest in Farmland (2011), for the land rush documented by the institution most often blamed for it.
- Somik Lall, Vernon Henderson and Anthony Venables (2017), Africa’s Cities, and Shlomo Angel and co-authors’ Atlas of Urban Expansion (2011), for the costs of the African urban form, with The New Regional Economics, chapter 13 (Wilse-Samson, 2026), for the consumption-city argument this chapter cites rather than repeats.
- Guy Michaels and co-authors (2021) on Tanzanian sites and services, and Sharon Barnhardt, Erica Field and Rohini Pande (2017) on Mumbai, for the two long-run housing experiments that bracket what public housing can and cannot do.