14. Energy and the Solar Transition
Learning Objectives
After reading this chapter, you should be able to:
- Say why electricity is the constraint growth diagnostics keep finding, and why a sector with almost no employment of its own is the one every other sector’s third term runs through.
- Describe how electricity is actually paid for: the tariff that does not cover cost, the arrears that follow, and whose balance sheet carries them.
- Compare grid extension, mini-grids and solar home systems on cost per connection and on what each can run, and say what the randomized evidence settles.
- Explain why an access number and a consumption number tell different stories about the same country, and why the two published counts of Africa’s unserved population differ by tens of millions.
- Judge whether a generation project is bankable given the offtaker behind it, and state the argument that Africa’s electricity, rather than its labour, is what the next century buys from it.
Prior work: the Lagos grid material this chapter leans on is developed in the companion volume, The New Regional Economics, chapter 13 (Wilse-Samson, 2026). This chapter cites it rather than repeating it.
In 2023, 666 million people in the world had no electricity, and 565 million of them lived in Sub-Saharan Africa; 451 million of those were rural (World Bank, IEA, IRENA, UNSD and WHO, 2025). Thirty-five million gained access that year and the deficit fell by five million, because the other thirty million were newly born into unserved households. On a different definition and a later year the International Energy Agency puts the number at about 600 million, roughly 47 percent of the Sub-Saharan population, with fewer than 19 million a year gaining access in 2023 and 2024 against 23 million in 2019 (IEA, 2025a). The two counts disagree by more than the population of a large African country, and both are right about what matters: the continent whose working-age population is about to double is adding connections more slowly than it adds people.
That arithmetic, not the price of a panel, is this sector’s problem. The panel is cheap now; what is not cheap is the wire, the meter, the utility that reads the meter, the tariff that would pay for all three, and the sovereign standing behind the contract.
1. Overview
Energy is an input rather than a sector, which is why it behaves oddly in the identity. As an industry it is small: a few hundred thousand direct employees and a share of value added that would not justify a chapter. As an input it is the multiplier on everything else. The firm that cannot run a second shift, the cold chain that does not exist, the welding shop paying four times the grid tariff for diesel: each is a subtraction from somebody else’s third term. In the growth-diagnostic trees this book runs pole by pole, electricity is the constraint that appears most often and binds most quietly, because firms that cannot get power shrink instead of asking.
| Identity term | What this sector does to it | Where it sits on the cards |
|---|---|---|
| One: working-age population | Nothing directly. Demand follows the cohort; the cohort does not follow the power | Median 2.9 percent a year, 48 cards outside the Northern region |
| Two: employment-to-working-age ratio | Small directly; large indirectly, through what other employers can operate | Median minus 0.15 percent a year, 53 cards (Chapter 10) |
| Three: output per worker | The multiplier term, and the one the diagnostics are about. Reliability matters more than capacity | Median 0.74 percent a year, positive on 32 of 53 cards |
Source: UN World Population Prospects 2024 for term one and ILOSTAT modelled estimates, November 2025, for terms two and three, via the country cards.
Three pole chapters have already made the case that the constraint binds, in three different ways. Chapter 24 finds Nigerian manufacturers spending 1.35 trillion naira, ₦, on alternative power in 2025 against grid capacity above 13,000 MW delivering under 5,000: capacity that exists and cannot be moved. Chapter 25 finds a South African utility shedding almost 25,000 gigawatt hours across 287 days of blackouts in 2023 and almost none by 2025: an administrative failure and recovery, with no new plant in between. Chapter 30 finds Zambian generation collapsing with the water in Lake Kariba, live storage at 8.7 percent in August 2024. Wires, management, rain. Any one will do it.
The countries this chapter discusses
Fourteen countries carry most of this chapter’s argument. They hold 63.5 percent of the continent’s population and produce 64.0 percent of its output. A chapter about to claim that electricity moves the third term should first show what that term is doing where the claim is made.
| Country | Term one | Term two | Term three | Wage employment, % | Non-agricultural employment, % | Confidence |
|---|---|---|---|---|---|---|
| Nigeria | 2.90 | 0.29 | -1.94 | 13.6 | 65.9 | low |
| DR Congo | 3.38 | -0.18 | 1.81 | 14.7 | 41.1 | low |
| Ethiopia | 3.46 | -1.58 | 5.91 | 15.4 | 39.0 | low |
| Tanzania | 3.55 | 0.03 | 1.92 | 14.5 | 34.9 | medium |
| Kenya | 2.94 | -1.17 | 2.84 | 35.1 | 53.5 | high |
| Ghana | 2.52 | -1.56 | 3.48 | 32.2 | 64.8 | medium |
| Côte d’Ivoire | 2.88 | 0.11 | 2.90 | 28.7 | 53.7 | medium |
| Senegal | 3.51 | 1.50 | 0.27 | 35.3 | 69.4 | high |
| Zambia | 3.70 | 0.59 | -0.93 | 27.9 | 44.7 | medium |
| Mozambique | 3.25 | -0.47 | 0.57 | 14.5 | 26.9 | medium |
| South Africa | 1.61 | -0.45 | -0.48 | 82.7 | 94.6 | high |
| Egypt | 1.96 | 0.07 | 2.26 | 72.9 | 82.0 | high |
| Morocco | 1.10 | -0.45 | 1.88 | 59.6 | 71.7 | high |
| Namibia | 2.64 | -0.37 | -1.05 | 63.2 | 77.4 | low |
Terms are annual growth rates over 2014 to 2024, in percent. Source: UN World Population Prospects 2024 for term one, ILOSTAT modelled estimates, November 2025, for the other columns and the book’s data-quality table for the flag, via the country cards.
Read the table against the access record and the first uncomfortable finding appears. South Africa has 87.7 percent access and a negative third term; Ethiopia has 56.6 percent access and the highest third term on the continent; Nigeria has 61.2 percent access and the worst third term of any large economy.
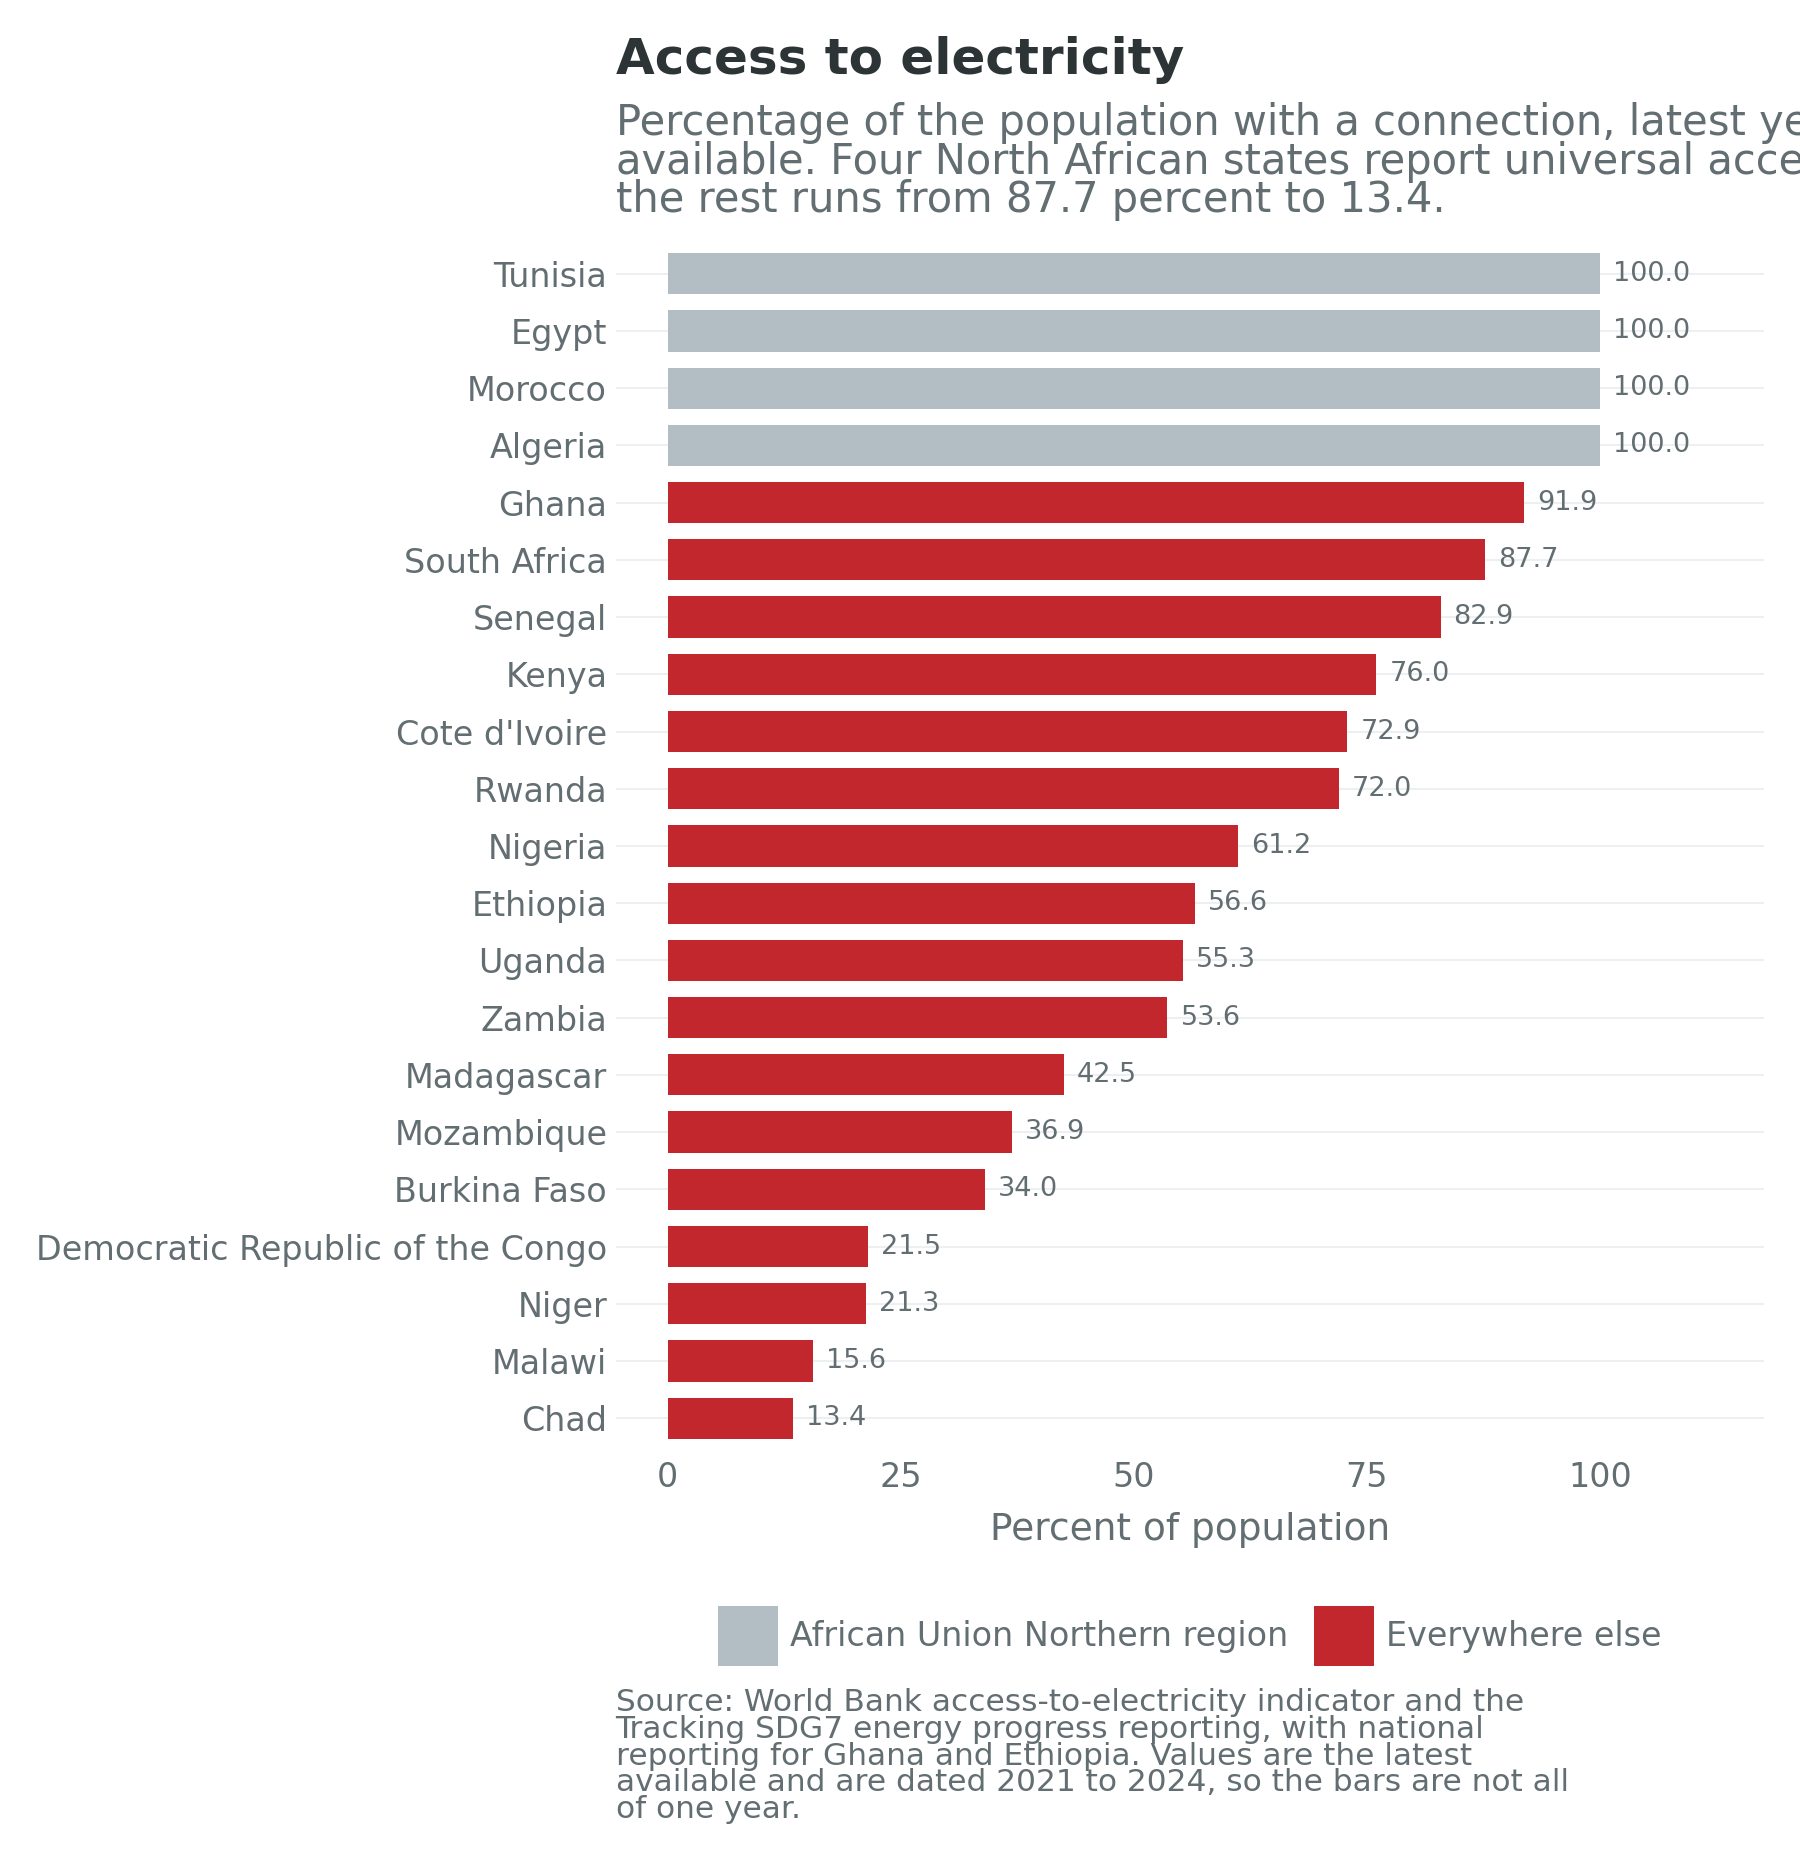
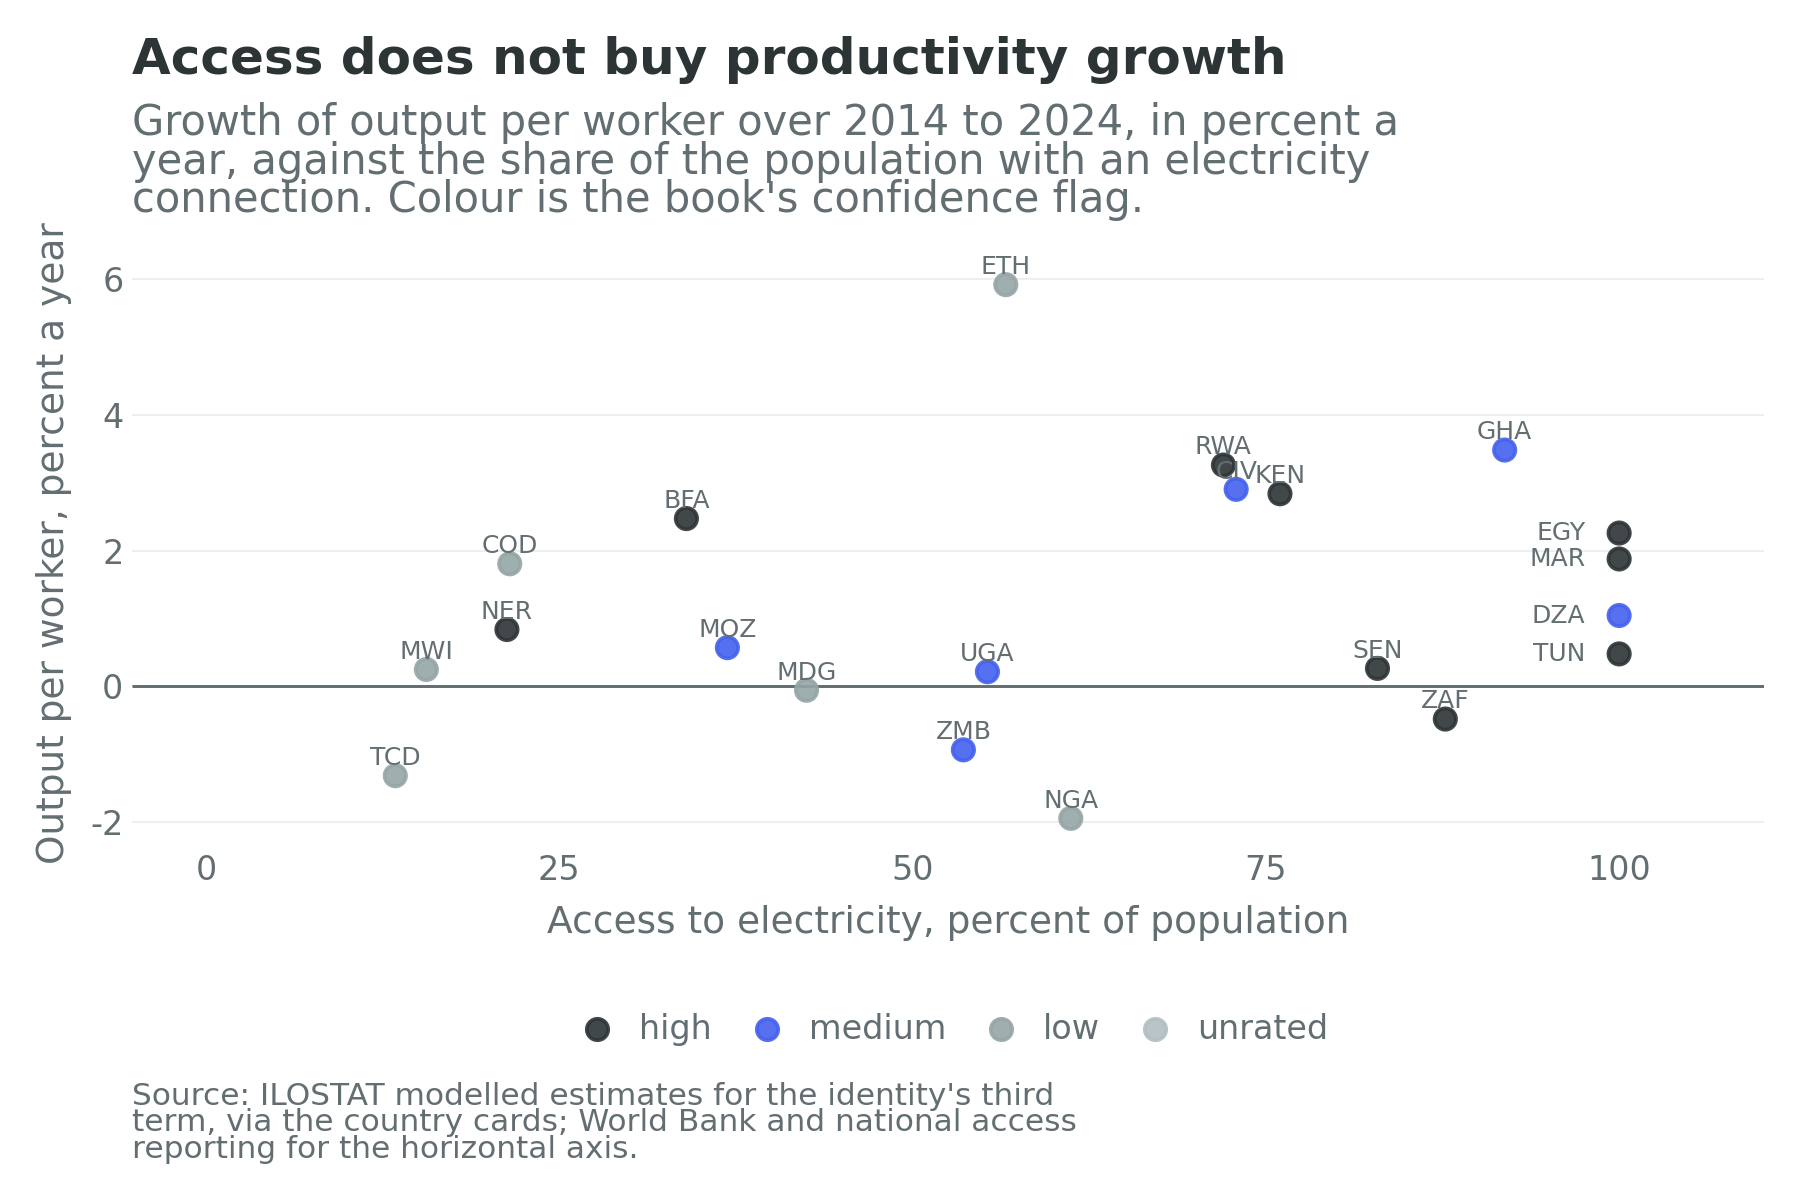
Figure 14.2 is the honest version of this chapter’s own claim, and it declines to confirm it. If access were the binding constraint on productivity in a simple way, the cloud would slope. It barely does, because access counts a connection and not a service: a household with a meter, four hours of supply and a 200-watt limit is one access point in the numerator and produces nothing. This is the modern-energy-minimum critique the Energy for Growth Hub has pressed since 2021, that the access threshold counts a trickle of household consumption and leaves out the electricity used outside the home, where most of it goes and most income is earned (Moss et al., 2021). Where the sector shows up in term three is in reliability and price, neither of which is on the horizontal axis, and both of which are what Sections 2 and 3 are about.
2. How the industry works
The utility, and why it is insolvent
Almost every African power system is organized around one state-owned company that generates, transmits and distributes, or did until unbundling split it into pieces owned by the same shareholder. Call it the utility. Its economics are the same from Accra to Lusaka, and they are why nothing else in the sector works. It sells electricity below cost, because the tariff is set by a regulator answerable to a government for which the price of power is political, so the tariff moves late, in steps, and usually after an election. The gap is a subsidy paid three ways: a treasury transfer, rare; an arrear to a supplier, common; or deferred maintenance, universal, which presents its bill later as an outage.
Then there are losses. Technical losses are physics, the energy that heats the wire rather than the kettle. Commercial losses are everything else: meters that do not work, meters bypassed, connections never registered, bills to public bodies unpaid. The largest defaulter in most African power systems is the state itself, and South Africa’s case is the best documented because the numbers are published: municipalities owed the national utility R111.6 billion at the end of March 2026 and R119.9 billion by June, growing by about R3 billion a month (Eskom, 2026). The electricity was generated, transmitted, delivered and consumed. What failed was the collection.
An insolvent offtaker cannot sign a bankable contract, and that is the hinge of the sector. A plant is financed against payments from the utility; if the utility does not pay, the plant is not built, or is built at a cost of capital reflecting the risk, which raises the tariff, which the utility can afford even less. Africa holds about 20 percent of the world’s people and receives about 2 percent of global clean energy investment (IEA, 2025a). A distributor’s arrears end up in a solar plant’s discount rate; Chapter 21 owns the rest.
The independent power producer and its contract
Since the 1990s the standard answer has been to leave the utility as buyer and let private capital build the plant. The instrument is the power purchase agreement: a twenty-year contract in which the producer builds and operates and the utility pays a tariff per kilowatt hour, usually with a capacity charge payable whether or not the electricity is taken. That charge is the point of the contract and the source of every controversy about it, because it moves demand risk from investor to utility, which makes a plant financeable and an over-contracted utility pay for power it does not use.
Kenya is the instructive case because its parliament put numbers on the complaint: the national distributor paid independent producers 73.7 billion Kenyan shillings, KSh, about 60 percent of all its power-purchase costs, for 41 percent of the electricity it sold (National Assembly of Kenya, 2024). A freeze on new agreements followed, lifted in November 2025 when the National Assembly adopted a report that admits only producers who have disclosed their beneficial ownership and directs that procurement move within a year to an auction modelled on South Africa’s programme (National Assembly of Kenya, 2025; Baru et al., 2025). Whether those tariffs were corrupt or merely early is a live argument; that bilateral negotiation with a monopsony buyer produces indefensible contracts is not.
South Africa’s Renewable Energy Independent Power Producer Procurement Programme is the demonstration that the alternative works: seven bid windows, more than 7,700 MW of renewable power secured since inception (Madiba, 2025), and a seventh round that named eight preferred bidders for 1,760 MW and R31.4 billion of investment (Engineering News, 2025b). The mechanism is an auction with a standard contract, a published schedule and a sovereign guarantee. It is no mystery why it worked, and none why it stalled between rounds four and five: the state stopped procuring. Egypt’s Benban is a third model, the state-assembled site: about 1,650 MW of land, grid and permits prepared at one location in Aswan, inside which some forty developers built under a feed-in tariff (AfDB, 2019).
The wire, which is the actual constraint
Generation gets announced; transmission decides whether the announcement matters. Nigeria’s grid carries under 5,000 MW against installed capacity above 13,000 (Chapter 24), and South African renewable procurement is now limited less by price than by the absence of grid capacity in the Cape provinces where the wind and sun are. A transmission line is a monopoly asset with a thirty-year life, no consumer to bill directly, and a return that exists only if somebody regulates it into being. Private capital will build a solar farm all day and will not build a pylon.
The regional version of the problem is the power pool, and three matter. The Southern African Power Pool, thirty years old and the most developed, still trades a rounding error: 156.7 GWh across all its markets in May 2026, against regional consumption measured in hundreds of terawatt hours a year (Southern African Power Pool, 2026). The West African Power Pool has existed since 1999 and its flagship North Core interconnection was 56 percent complete at the end of 2025 (Chapter 24). The Eastern Africa Power Pool has the one transformative line on the continent, the 500 kV direct-current link from Ethiopia to Kenya, rated at 2,000 MW and delivering 1,534 GWh into Kenya in the year to June 2025, 10.6 percent of Kenyan supply (KETRACO, 2026; Energy and Petroleum Regulatory Authority, 2025). Chapter 29 tells the Ethiopian half, in which exports earned $86.3 million from Kenya and $30.9 million from Djibouti in 2024/25 (Le360 Afrique, 2025). One working line moved more power across an African border than the continent’s oldest pool trades in a month, because a pool is a market layered on wires and the wires are missing.
Below the grid: mini-grids, solar home systems and the generator
Where the grid will not reach for a decade, three other systems operate. A mini-grid is a small solar-and-battery generator with a low-voltage network over a few streets. The economics are unforgiving: capital cost per connection is high, demand is low, and the customer who makes the arithmetic work is a business with a motor rather than a household with a light. Husk Power Systems, which says it owns the world’s largest private portfolio of mini-grids and doubled its fleet in 2024 to reach more than 400 communities in Nigeria and India, weights its customers towards small businesses for that reason (Husk Power Systems, 2025). The World Bank’s assessment is that mini-grids could serve about 380 million Africans by 2030 at a cumulative cost near $91 billion, with levelised costs falling to roughly $0.22 per kilowatt hour if scale and productive use both arrive (ESMAP, 2022). Both conditions do a great deal of work in that sentence.
A solar home system is a panel, a battery, lights and a phone charger, sold on credit and disabled remotely if the customer stops paying. Pay-as-you-go is the most successful consumer-finance innovation in African history and its scale is now serious. M-KOPA passed ten million customers in July 2026, and Sun King reports a base approaching ten million and plans to take its agent network from about 45,000 to about 90,000 by 2030 (M-KOPA, 2026; Sun King, 2025). What they deliver is real: light after dark, a charged phone, an end to kerosene. What they do not deliver is a motor. A 40-watt system runs a household, not a mill or a welding set, which is why the industry’s growth path runs through appliance finance and why Section 10’s evidence on solar kits is muted.
The third system is the one nobody planned and everybody uses. Backup generators are in aggregate the largest private power system on the continent. Nigeria’s backup capacity has been put at about eight times the grid’s peak of about 5.3 GW, and Nigerian spending on backup generation at $12 billion to $17 billion a year (Borofsky, 2021). Across developing countries generator fuel costs up to $50 billion a year, and in Sub-Saharan Africa more is spent on it than on maintaining and managing the national grids (International Finance Corporation, 2019). That is the shadow price of the constraint, paid in cash, daily, by the firms whose productivity is the third term, and it is the strongest evidence here because it is revealed preference rather than a survey answer.
That generator is also what the solar import surge is replacing, and Nigeria is the case. Chapter 24 owns the political story: the fuel subsidy came off on 29 May 2023 and the naira was floated the next month. Households and firms that had been buying petrol and diesel for generators then faced a different relative price, and they bought panels. Ember’s reading of Chinese customs records for assembled photovoltaic modules puts Nigeria’s imports from China at 1.3 GW in calendar 2024, the first year the country crossed a gigawatt, and at 1,721 MW in the twelve months to June 2025, second on the continent after South Africa (Ember, 2025a; Ember, 2025b). These are modules shipped, not modules on roofs. Ember notes that some will still be on the water or in warehouses, which is why an import series and an installation series will not agree.
What the trade data show is a customer who has given up on the grid and, after the subsidy, given up on the generator as the default answer. Ember’s own arithmetic, counting the panel only and leaving out the inverter, the battery and the installation, puts the diesel payback at about six months in Nigeria (Ember, 2025b). Nigeria’s statistical office recorded photovoltaic cells not assembled into modules among the most-traded manufactured imports in the last quarter of 2024, ₦229 billion of them from China (National Bureau of Statistics, 2025). Cells are an input to assembly, not a lamp. The surge is real, it is below the grid, and it is a price response rather than a programme.
Cooking, which is the bigger number
Electricity is the sector’s glamorous half. About one billion people in Africa still cook on open fires or basic stoves, household air pollution contributes to some 815,000 premature deaths a year on the continent, and universal clean cooking by 2040 would need about $37 billion against $2.2 billion of commitments at the 2024 clean-cooking summit (IEA, 2026). Some 15 million Sub-Saharan Africans gained clean cooking in 2025, above the preceding five-year average and still short of population growth. The gap is gendered, it is a health problem before it is an energy problem, and it is where a small sum buys the most measurable welfare. Chapter 23 carries the health accounting.
3. Industry structure
The utilities. The state company is still the centre of every system. Eskom generates most South African electricity and is profiled in Section 9. Kenya splits the functions between KenGen, which generates, and Kenya Power, which distributes, which is why the Kenyan tariff argument could be had in public with numbers. Ghana’s Electricity Company of Ghana is the weak link in a system whose generation is adequate. Nigeria unbundled furthest, into a state Transmission Company of Nigeria and eleven privatized distribution companies, and got the worst of both worlds: private owners without capital, a public wire without capacity, and a regulator now sharing jurisdiction with sixteen states. Ethiopian Electric Power generates and transmits for a system 94.5 percent hydroelectric by installed capacity (Ethiopian Electric Power, 2025). Morocco’s ONEE and Algeria’s Sonelgaz reached universal access as vertically integrated monopolies, worth remembering when unbundling is called a precondition rather than a preference.
The developers. A handful of firms build most of the continent’s new private generation. Scatec, Norwegian, operates about 1.5 GW in Egypt alone and took the largest award of South Africa’s seventh bid window at 846 MW (Scatec, 2026). ACWA Power, Saudi, reports about $7 billion of investment across African projects and signed a framework with the African Development Bank in Rabat in December 2025 aiming to mobilize up to $5 billion between 2025 and 2030 (ACWA Power, 2024; Moho Amer, 2025a). Globeleq, Masdar and AMEA Power occupy the same space, and behind all of them sit the Chinese contractors who build much of African hydro and thermal plant without owning it; Chapter 32 owns their lending.
The off-grid firms and the equipment. M-KOPA, Sun King, d.light and Husk are consumer-finance companies that happen to sell hardware, and their binding constraint is local-currency credit rather than solar technology. Africa does not make its panels: Chinese customs data show 16.1 GW of modules shipped to African countries in 2025 and 58.1 GW since 2017 (Global Solar Council, 2026). Assembly plants in South Africa, Egypt, Morocco and Nigeria laminate imported cells; Chapter 15 asks whether that is a first rung or a permanent one.
The financiers. The African Development Bank, the World Bank’s windows, the United States International Development Finance Corporation, the European development banks and the Africa50 platform provide the concessional layer without which almost no African generation project reaches financial close. Private clean-energy investment in Africa roughly tripled from about $17 billion in 2019 to almost $40 billion in 2024, with $20 billion more in public and development finance (IEA, 2025a): respectable numbers on a continent needing a multiple of them.
4. Geographic distribution
Where the electricity comes from is a map of geology and rainfall more than of policy.
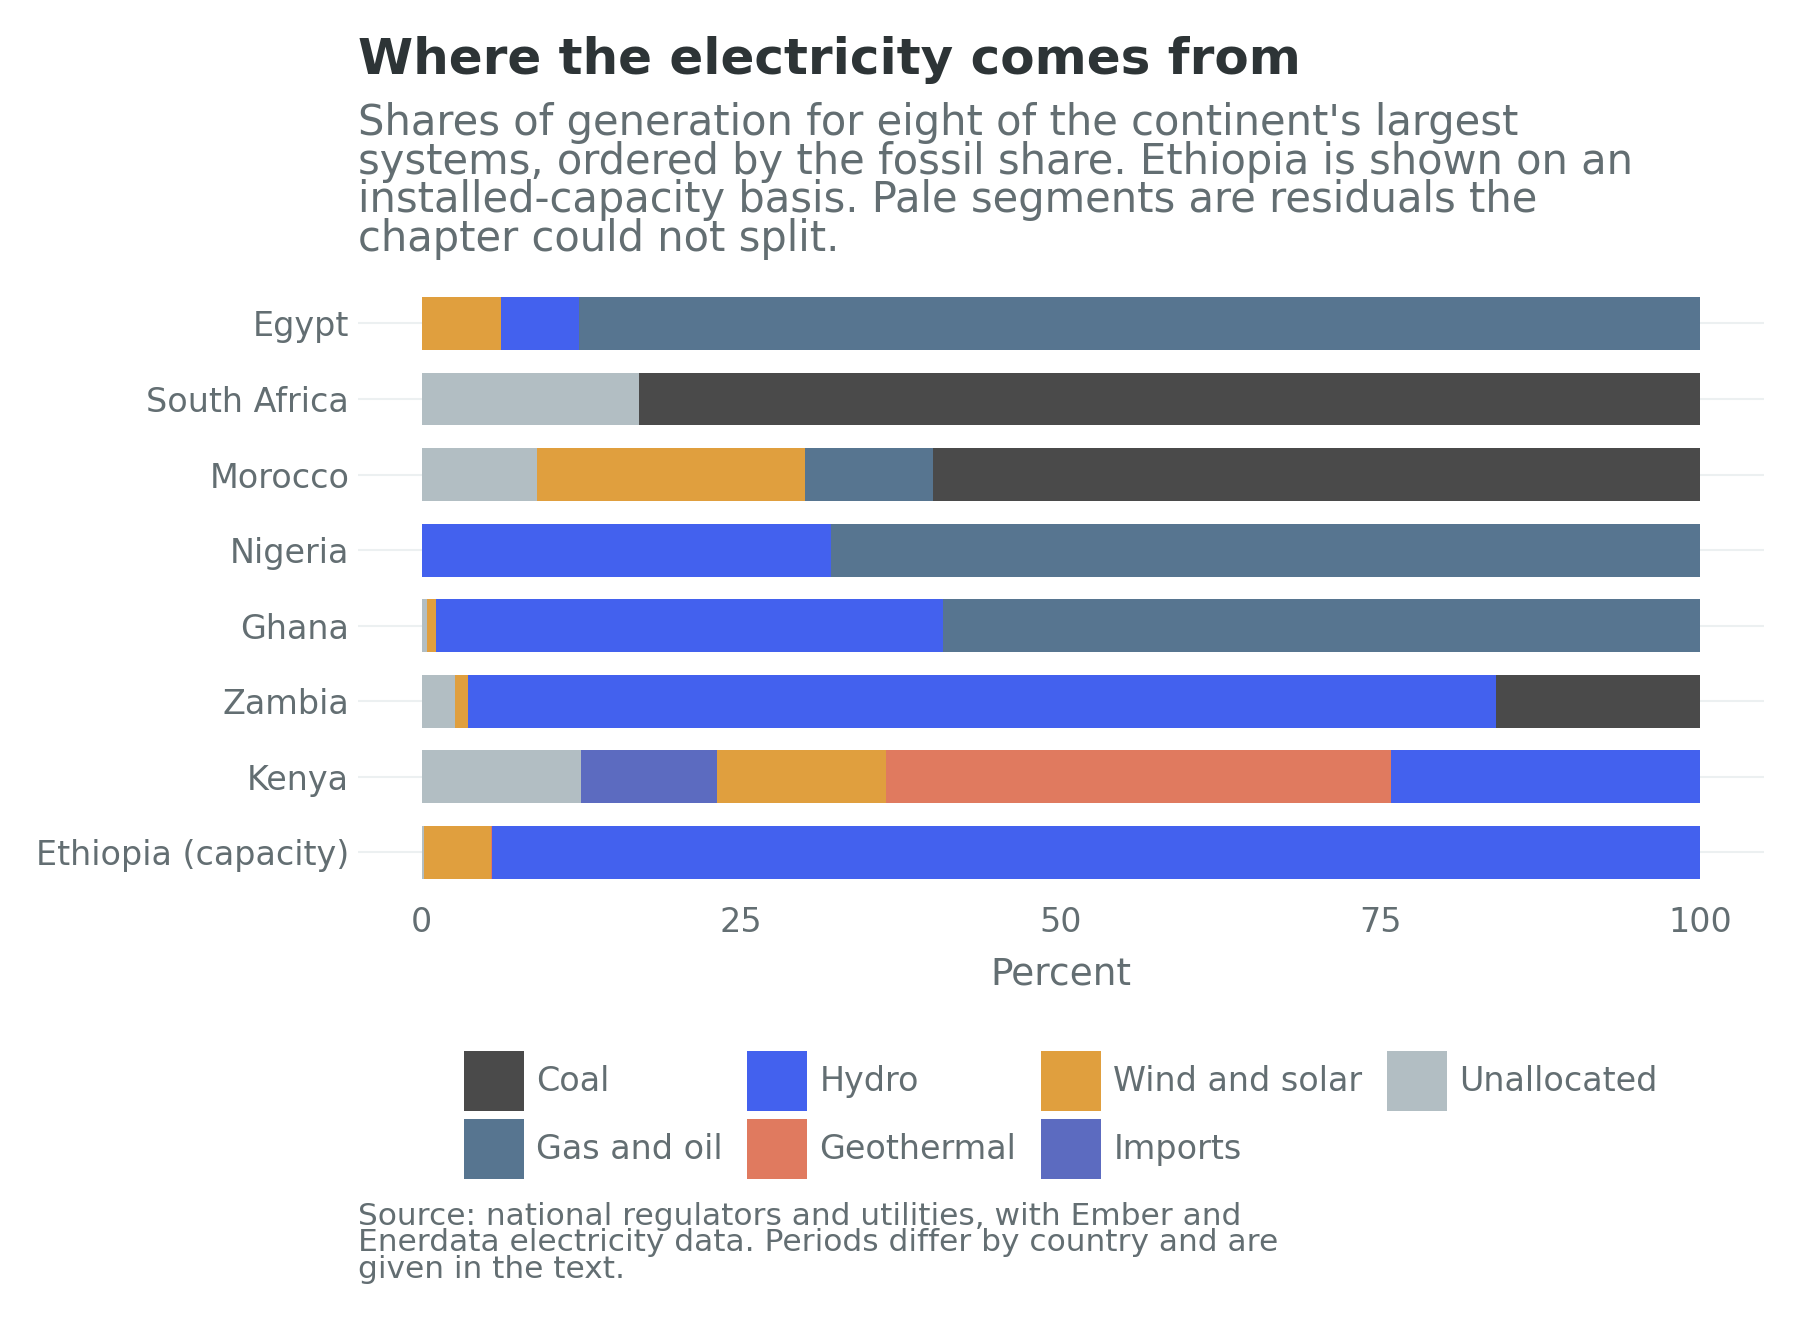
Four patterns. The largest systems are the least renewable: South African coal supplied 83 percent of utility-scale generation in 2024 and Egyptian gas 81.3 percent (CSIR, 2025; Ember, 2026). The greenest are green by hydrology rather than by choice, which is why Section 8 treats them as exposed rather than exemplary. Kenya is the one system built deliberately around a resource nobody else has: geothermal supplied 39.5 percent of generation in the year to June 2025, hydro 24.2 percent, wind 13.2 and imports 10.6 (Energy and Petroleum Regulatory Authority, 2025). And Morocco’s renewable share of installed capacity, about 46 percent at the end of 2025 (Chapter 28), sits beside a coal share of generation near 60 percent: capacity is not energy.
The pole geography follows. Chapter 24’s Lagos to Abidjan corridor is gas-rich and wire-poor; Chapter 25’s Gauteng block sits on coal and exports its shortage through the Southern African Power Pool; Chapter 29’s Addis to Djibouti pole is the continent’s hydro exporter; Chapter 30’s Copperbelt is where mining demand meets drought-exposed hydro; and Chapter 28’s Casablanca to Tangier platform is where the sun is being made into an export industry. Chapter 31 owns the Inga question: Inga I and II have a combined nameplate capacity of about 1,775 MW and have for years delivered well under half of it, while Inga III has been designed at anything between 2,000 and 11,000 MW and remains in design (World Bank, 2025c). The chapter’s map layer carries thirty-four sites, from the large hydro of the Nile, Zambezi, Volta, Niger and lower Congo to the solar of Benban and Ouarzazate.
The Grand Ethiopian Renaissance Dam is the largest single change to African generation this century. Inaugurated on 9 September 2025 after fourteen years of construction, at a cost of about $5 billion financed by domestic bonds, payroll deductions and diaspora subscription, it carries 5,150 MW and supplied 51.5 percent of Ethiopian Electric Power’s generation in its first year (Webuild Group, 2025; Diop, 2026). Chapter 29 profiles it as an industrial-policy instrument and Chapter 27 as a hydrological one. From here it shows two things: that an African state can still build a very large power asset without external lenders, and that doing so takes fourteen years.
5. Workforce
This sector employs almost nobody, and the fact is important rather than incidental. Eskom, the largest electricity employer on the continent, has about 42,000 employees for a system serving 64 million people (Eskom, 2026); KenGen generates most Kenyan electricity with a workforce in the low thousands; a 100 MW solar plant employs several hundred people for eighteen months and a few dozen thereafter. Capital-intensity is the point of the technology, and any argument for electricity as a jobs programme therefore has to run through the electricity’s users rather than its producers.
Where it does employ at scale is in sales at the bottom of the market. Sun King’s African agent network alone is about 45,000 people and is planned to reach about 90,000 (Sun King, 2025), made of commission-paid salespeople rather than employees. That illustrates Chapter 10’s finding that the African jobs question is about earnings rather than headcount, and the wage-employment column of the card table is the one to watch: Nigeria, Ethiopia, Tanzania, Mozambique and the DR Congo all sit below 16 percent.
Utility workforces are nonetheless politically load-bearing. A national utility is one of the largest formal, unionized, pensionable employers in most African countries, which is why tariff reform is fought so hard, and why Chapter 5’s vocabulary of political settlements applies here.
6. Regulation and policy
The reform agenda has been the same for thirty years and is now, for the first time, being implemented in the two largest markets at once.
Unbundling. The 1990s template separated generation, transmission and distribution, created an independent regulator and invited private producers; it worked where the state could still run the residual monopoly and failed where it could not. South Africa has now reached the stage it ends at: the National Transmission Company of South Africa was incorporated and made system operator, and the Electricity Regulation Amendment Act of 2024 established a market operator and the framework for a competitive wholesale market (Republic of South Africa, 2024).
Licensing thresholds. The most consequential African energy reform of the decade is also the least ceremonious. South Africa raised the licence-exemption threshold for embedded generation from 1 MW to 100 MW in 2021 and removed it altogether in 2022, exempting any generator connecting to the grid regardless of size (Republic of South Africa, 2024). Private rooftop and industrial solar then arrived faster than any procurement programme had delivered, reaching 5.8 GW and adding roughly 2.3 TWh in 2024 alone (CSIR, 2025). A government that could not procure got out of the way, and the market did the procuring.
Nigeria’s Electricity Act 2023 devolved instead. States may now regulate their own intrastate markets on notifying the federal regulator, and by July 2026 oversight had passed to sixteen states (Nigerian Electricity Regulatory Commission, 2026). This is either the most important African power reform since South Africa’s or an invitation to sixteen incompatible regimes inside one grid. The optimistic reading is that Lagos and Enugu can now build what Abuja could not; the pessimistic one is that a transmission monopoly with no capacity is a poor foundation for sixteen state markets.
Tariffs and subsidies. Cost-reflective tariffs are the reform every programme requires and every government defers, because those who lose from a tariff rise are visible, organized and urban, and those who gain, being unconnected, are none of those things. The Ghanaian word dumsor, “off and on,” entered the language during the rationing of the 2010s and is still the shorthand for what a government pays politically for underinvestment; the Francophone délestage does the same work from Dakar to Kinshasa. Net metering is legislated in many countries and implemented in few, because a utility losing money on every unit sold will not buy units back.
Mission 300. The largest current initiative is the World Bank and African Development Bank commitment to connect 300 million people by 2030, launched in 2024 and organized around national energy compacts in which governments commit to tariff paths, utility governance and private-participation rules in exchange for coordinated financing. By 2026 it reported more than 50 million people connected across 40 countries, at close to double the pace recorded at the start, assuming about half of new connections come from the grid and the rest from mini-grids and solar home systems (World Bank and AfDB, 2026).
The sceptical reading is worth stating plainly. A programme reporting connections against a baseline it also constructs, where the access statistic is a survey-and-utility composite, is grading its own homework. The arithmetic does not close either: 300 million connections by 2030, against a deficit of 565 million in 2023 and a population adding some thirty million people a year, leaves a very large deficit, as the initiative’s own projections concede. And a connection is not a kilowatt hour, so a programme optimized for connections builds the cheapest and smallest ones, precisely those Section 10’s evidence finds hardest to justify. Its success should be measured in consumption per connected household, and in the arrears of the utilities doing the connecting, rather than in the headline it was named after.
7. Recent trends
Solar has stopped being a demonstration. Africa installed about 4.5 GW of solar in 2025, 54 percent more than in 2024 and the fastest growth on record, with South Africa at 1.6 GW, Nigeria at 803 MW, Egypt at 500 MW and Algeria at 400 MW, and eight countries above 100 MW against four the year before (Global Solar Council, 2026). Utility-scale projects were about 56 percent of the total and distributed systems 44, the more interesting half: much of the continent’s new generation is now installed by customers who gave up on the grid. Installed renewable capacity reached 82,397 MW in 2025, up 15.9 percent (IRENA, 2026). Real numbers, and small: roughly one percent of what the world installed that year.
Nuclear is back on the agenda, slowly. Egypt’s El Dabaa, four Russian-supplied reactors totalling 4,800 MW in a project of about $30 billion financed mainly by a $25 billion Russian loan, had its first reactor pressure vessel installed in November 2025, with all four units planned for completion in 2028 to 2029 (Nuclear Engineering International, 2025). South Africa extended both Koeberg licences by twenty years, keeping 1,860 MW of baseload to 2045, and revived its pebble-bed small-modular-reactor programme beside a planned 2,400 MW new-build (Eskom, 2025). Small modular reactors are announced across the continent at a rate bearing no relation to the rate at which they are built.
Green hydrogen is an export bet, not an energy policy. Namibia’s Hyphen project, announced at about $10 billion for roughly 5 GW of wind and solar feeding 3 GW of electrolysis in the Tsau Khaeb park, would make on the order of 300,000 tonnes of hydrogen a year at full build, and has not reached final investment decision (Hyphen Hydrogen Energy, 2026). Morocco approved six projects in March 2025 with about $32.8 billion of announced investment (Chapter 28). The logic is sound: an electron is expensive to move and a tonne of ammonia is not, so a country with sun, wind and a port has a reason to make the molecule at home. Whether any of it is built is another matter, and announced investment is not investment.
Two worlds: the electron and the worker
Chapter 1 set out the assumption the book rests on, that the marginal worker still matters, and named the world in which it stops being true. This is the chapter that world runs through, and it is why Chapter 1 said this would be an energy chapter and not a climate one.
In the labour-abundant world, electricity is an input to industrialization exactly as the development literature has always said: power the factory, the factory hires, term two rises and term three with it. Sections 2 through 6 are written for that world, and their policy conclusion is the conventional one.
In the labour-redundant world the sector changes role entirely. If the frontier of production is compute rather than labour, the binding physical constraint on it is electricity, and a continent with the best solar resource in the world, empty land beside it and no legacy grid to defend holds an asset priced by a bidder who does not care about African wages. That is a serious case for African prosperity and it is not the case this book’s title makes. A data centre is capital, energy and about fifty jobs.
What decides between the two futures is whether the data centres come to the power or the power goes to the data centres, and the continent’s most instructive recent event is an answer of a sort. In May 2024 Microsoft and the Emirati group G42 announced a geothermal-powered data-centre campus at Olkaria in Kenya, an initial 100 MW with the potential to reach 1 GW. By 2026 it was stalled, and the reason Kenya’s president gave was arithmetic: switching it on at full scale, he said, would mean shutting off power to half the country, whose installed capacity is about 3,000 MW (Semafor, 2026). One hyperscale facility wanted a third of a country. McKinsey projects data-centre capacity across Africa’s five largest markets rising from around 400 MW today to between 1.5 and 2.2 GW by 2030 (McKinsey, 2025). Against the continent’s renewable fleet of 82.4 GW that looks modest; against Kenya’s 3 GW it does not.
Three observations follow. First, the constraint runs the other way from what the optimistic version assumes: Africa’s problem is not a shortage of sun but a shortage of firm, dispatchable, contractable power at a bankable price, which is a question about balance sheets and wires rather than irradiance. A hyperscaler needs power that is there at three in the morning in a bad week, which is why the Kenyan bid was for geothermal and not solar, and why Morocco’s pitch rests on an interconnector to Spain as much as on the Sahara.
Second, the sites that win will be the ones that already work: Chapter 28’s Casablanca to Tangier platform, with a European interconnection, and Chapter 27’s Egyptian system, with 59.7 GW of capacity and cable landings on two seas. The Sahel, with the best irradiance and the weakest states, is not among them. Compute follows institutions exactly as manufacturing did, so this world would concentrate African income rather than spread it.
Third, and this is the uncomfortable one, an electron sold to a data centre and one sold to a welding shop are the same electron. A country with 3 GW of capacity that allocates 1 GW to a foreign hyperscaler has decided something about its own industrialization, at a moment when it cannot see which world it is in. The right posture is not to refuse the data centre but to notice that the choice is framed as an investment decision when it is an industrial-strategy decision. Chapter 17 owns the digital side and Chapter 35 carries it as a scenario axis.
8. Climate exposure
This sector is more exposed to climate than any other in the book except agriculture, and the exposure runs in an unexpected direction: it is the clean systems that are fragile.
Hydropower and drought. Roughly a fifth of African generation is hydroelectric, and in several countries it is nearly all of it. Zambia generated about 80 percent of its electricity from water in 2024, the year Lake Kariba’s usable live storage fell to 8.7 percent and the 1,080 MW Kariba North station was shut, with Zimbabwe sharing the same lake and the same collapse (Energy Regulation Board of Zambia, 2025; Chapter 30). Ghana’s hydro plants, the Akosombo dam the largest of them, produced about 40 percent of its electricity in the first half of 2024, a share that moves with the Volta’s inflows, and those inflows are what stand between Ghanaian industry and the dumsor of the 2010s (Ghana Energy Commission, 2024). Ethiopia is 94.5 percent hydro by installed capacity, so a country whose growth story is now partly an export story has bet it on the Blue Nile’s flow (Ethiopian Electric Power, 2025). A drought is a fiscal event in these systems: generation falls, the utility buys emergency power, arrears rise, and the finance ministry pays.
Heat, and the transition question. Warming raises peak demand through cooling at exactly the hours when thermal plant derates and transmission lines sag: load rises as the capacity to serve it falls. African peaks are still evening peaks driven by lighting, but the cooling peak is arriving in cities. Africa contributes under 4 percent of global emissions and holds the largest population without electricity, so any framing in which African decarbonization is the priority has the arithmetic backwards. Chapter 12 argues the gas-to-power case, Chapter 25 the labour side of a coal exit, and Chapter 34 owns climate finance. The exposure just described is a reliability problem now, not a mitigation problem later.
9. Firm profiles
Eskom (Johannesburg): the utility as fiscal object
Eskom is profiled because it is the clearest case of what a national utility becomes when it fails and what recovery actually consists of. Chapter 25 treats it as a fiscal and political object; this section treats it as a company.
For the year to 31 March 2026 it reported profit after tax of R30.3 billion, up from a restated R14.0 billion, a second consecutive profitable year, with borrowings down to R356 billion and an energy availability factor of 67.87 percent, its best since 2020 (Eskom, 2026). The recovery came from maintaining thirty-year-old coal stations better rather than from building: Kusile Unit 6 at 799 MW reached commercial operation and Medupi Unit 4 at 720 MW returned from repair, and that is the extent of the new plant. It was an administrative recovery, the most encouraging finding in Chapter 25 and the most fragile, since an availability factor rebuilt by maintenance has a shelf life and the fleet is old. The balance sheet was repaired by the state, through the R254 billion debt relief of 2023, later cut to R230 billion over five years as the utility’s performance improved (National Treasury, 2023; National Treasury, 2025). Chapter 25 reads that as the largest single allocation of South African fiscal capacity in the democratic era. The operating problem, meanwhile, migrated one level down, to municipalities that buy the power and do not pay. Eskom is now a profitable company with a solvent generation business and an insolvent customer base, which describes most African utilities and almost no company with an investment-grade sovereign behind it.
Scatec (Oslo, operating from Cairo and Cape Town): the developer as continental firm
Scatec shows what the independent-producer model looks like when it works. In Egypt it operates about 1.5 GW, including the 380 MW Benban plant and the 1.1 GW Obelisk solar-and-battery project; in South Africa it took 846 MW of solar in the seventh bid window (Scatec, 2026). The constraint on African renewable build, the profile says, is not developers, technology or equity: both portfolios were built against creditworthy, standardized offtake, a sovereign-backed auction in one country and a state-assembled site with a published tariff in the other. Where those do not exist the same firm does not build, which is Section 2’s argument stated as a company’s project map.
M-KOPA (Nairobi): energy as consumer credit
M-KOPA shows what the off-grid industry actually sells. Founded to sell solar home systems on daily instalments collected by mobile money, with the system disabled remotely on non-payment, it passed ten million customers in July 2026, six years after its first million (M-KOPA, 2026). The product mix long ago broadened into smartphones and appliances, which is the tell: the asset is not the panel but the repayment history accumulated on customers with no credit file. The profile cuts two ways. It is an African-built financial innovation at a scale nothing else here matches, and it has put light and phone charging into millions of houses the grid will not reach for twenty years. It has also conceded, by its own product evolution, that a solar home system is a consumer good rather than productive infrastructure. Ten million customers is a great many households. It is not a great many motors.
KenGen (Nairobi): the state generator that works
KenGen is the counter-example to the assumption that state generation is the problem. For the year to June 2025 it reported installed capacity of 1,786 MW and sales of 8,482 GWh, more than 90 percent of capacity renewable: 826 MW of hydro, 754 MW of geothermal and 25.5 MW of wind. Profit after tax rose 54 percent to KSh 10.48 billion (KenGen, 2025). Geothermal explains most of it: dispatchable, domestic, immune to drought, cheap once drilled, and developed at Olkaria since the 1980s. The rest is that KenGen sells to a single distributor at regulated prices, supplying 59 percent of the electricity for 40 percent of the payments (National Assembly of Kenya, 2024). It is a well-run generator that is also, on those numbers, cross-subsidizing the private producers in its own market, and whether that is a scandal or a sensible use of a state asset is the argument Kenya is currently having.
10. What the experiments say
Box 14.1: What the randomized evidence says about connecting a village
This is the sector where the experimental literature is most developed and least comfortable for its advocates.
Lee, Miguel and Wolfram (2020) randomized grid connections across rural Kenyan communities, offering subsidies from full price down to free. Demand fell steeply with price; consumption among the newly connected was very low, implying low consumer surplus; and there were substantial economies of scale in connecting. They found no meaningful medium-run effects on economic or non-economic outcomes. Stated plainly: at prevailing costs, rural household grid connection in Kenya was worth less than it cost.
Burlig and Preonas (2024) ask the same question of the largest electrification programme in history, India’s RGGVY, which reached over 400,000 villages. They find it substantially raised access and generated limited economic effects after three to five years, with full electrification reducing welfare in the smallest villages and larger ones plausibly gaining. Same answer, different continent, ten times the sample.
Grimm, Munyehirwe, Peters and Sievert (2017) randomized low-cost solar kits in rural Rwanda and found real gains in lighting and kerosene displaced, adoption strongly limited by affordability, and no transformation of household economics. Aklin, Bayer, Harish and Urpelainen (2017) ran a field experiment with off-grid solar microgrids across 1,281 Indian households: electrification rates up 29 to 36 percentage points, daily hours of access up only about one, kerosene spending down, few socioeconomic benefits.
What is missing is the mini-grid. Meeks and Pokhrel (2024), reviewing the field, note how little randomized evidence exists on mini-grids specifically, for operational reasons rather than intellectual ones: a village-scale asset a private operator must site commercially is hard to randomize. The best evidence on mini-grid economics is therefore observational and comes from the operators, which is exactly the evidence a sceptic should discount.
What this can and cannot tell a minister. It can tell her that household connection alone, by wire or by panel, will not by itself raise incomes, and that a programme evaluated on connections measures the input it can count rather than the output it wants. It can tell her the welfare case strengthens with village size and density, so grid-first is right in the dense places and wrong in the thin ones. What it cannot tell her is anything about industry. Every study above measures households; not one measures what happens when a reliable three-phase supply reaches a cluster of small manufacturers, which is the mechanism this chapter argues carries the third term. On that question there is diagnostic evidence, the diesel premium firms pay, and no experiment. A minister choosing between grid and off-grid on this literature alone would be choosing on the outcome the literature happened to measure.
11. Data sources and further reading
- World Bank, IEA, IRENA, UNSD and WHO, Tracking SDG7: The Energy Progress Report, and the World Bank’s access-to-electricity indicator: the access series, the deficit counts and the rural split. Access is a connection, not a service level.
- International Energy Agency: the Africa Energy Outlook, World Energy Investment and the clean-cooking work; the second access count this chapter reports.
- IRENA, Renewable Capacity Statistics, and the Global Solar Council, Africa Market Outlook: installed capacity, solar additions and the Chinese module trade.
- Ember, Global Electricity Review 2025 and The First Evidence of a Take-off in Solar in Africa: Chinese customs records of assembled photovoltaic modules, converted to megawatts, which is how this chapter dates Nigeria’s post-subsidy import surge. National Bureau of Statistics (Nigeria), Foreign Trade in Goods Statistics: the complementary naira series for photovoltaic cells.
- National regulators and utilities, cited by name: Eskom and the CSIR; the Energy and Petroleum Regulatory Authority and KenGen; the Nigerian Electricity Regulatory Commission; Ethiopian Electric Power; the Ghana Energy Commission; the Energy Regulation Board of Zambia.
- ESMAP, Mini Grids for Half a Billion People, and the Energy for Growth Hub: mini-grid economics and the modern-energy-minimum critique of access counts. Global Energy Monitor, Global Integrated Power Tracker: plant-level records for the map layer.
- Country cards: the identity terms, overlays and confidence flag in Section 1. The cards carry no sector fields, so every generation, capacity, access and price figure here comes from the sources above through the book’s claim register.
- Further reading: Lee, Miguel and Wolfram (2020) with Burlig and Preonas (2024), the two studies any electrification argument has to survive; Grimm, Munyehirwe, Peters and Sievert (2017) and Aklin, Bayer, Harish and Urpelainen (2017) for the off-grid half, with Meeks and Pokhrel (2024) on the mini-grid evidence gap; and The New Regional Economics, chapter 13 (Wilse-Samson, 2026).
12. Exercises
Connections to other chapters
- Chapter 1 names electricity as the binding constraint on compute in the labour-redundant world; Chapter 35 carries it as a scenario axis and Chapter 17 owns the digital demand side. Chapter 12 argues the gas-to-power case these generation numbers depend on, Chapter 13 the ores whose processing is itself an electricity problem, and Chapter 15 the assembly of panels.
- Chapters 24, 25, 27, 28, 29, 30 and 31 carry the pole-level material this chapter aggregates: Nigerian self-generation and the solar-import response after the 2023 fuel-subsidy removal, South African load-shedding, Egypt’s capacity surplus, Morocco’s renewable and hydrogen programme, Ethiopian hydro exports, the Kariba drought and the Inga question.
- Chapter 34 takes the transition financing this chapter hands on and Chapter 21 the cost of capital; Chapters 6, 10 and 23 supply the overlays Section 5 reads and the health accounting behind the clean-cooking gap.
Discussion questions
A household connection and an industrial connection both count as one connection, and Mission 300 is denominated in connections. Write the access statistic you would rather governments reported, say what it would cost to collect and how often, and whether it would have been achievable in 2015. Use Box 14.1 to argue that the denominator is not a technicality.
Utilities sell power below cost and are owed money by the state, which is both their shareholder and their largest defaulting customer. Whose balance sheet is that, and what does it do to the cost of capital for a new plant? Then take the other side: argue that a below-cost tariff is a rational transfer where 40 percent of the population is unconnected, and say what evidence would settle it.
Solar is the cheapest new generation almost everywhere, and Africa installed about 1 percent of the world’s 2025 additions. Explain the gap using storage, transmission and offtaker credit, in that order, defend the ordering, and say which of the three a government can fix in one parliamentary term.
Try it
Open the Growth Pole Map and switch on the power layer, which plots the plants this chapter names with their fuel, capacity and status. Compare Chapter 25’s Gauteng block, where the grid works badly and is measured well, against Chapter 31’s Kinshasa to Brazzaville writeup, where it barely exists and is measured worse. Turn the confidence toggle on and note which poles fade and which plants sit inside the hatching. Write one paragraph on the proposition that the places with the least power are the places with the weakest numbers about it, and say whether that is coincidence, common cause, or a measurement artefact of the sort Chapter 1 warns about.
Data exercise
First, download all fifty-four cards as cards.csv or cards.json with identity.output_per_worker_growth, identity.employment_to_wa_growth, overlays.wage_employment_share, scale.gdp_per_capita, scale.population and data_quality.confidence_flag. Reproduce the fourteen-country table in Section 1 and confirm its population and output shares of the continent, 63.5 and 64.0 percent.
Second, join that table to the chapter’s electricity-access file on the book site, which carries an access rate, a year and a source for each of twenty-one countries. Compute the correlation between the access rate and output-per-worker growth, with and without the four countries at universal access, and confirm the values of 0.24 and 0.27 quoted under Figure 14.2. Then drop every row whose access year precedes 2023 and recompute, and regress output-per-worker growth on the access rate and the logarithm of income per head together, reporting what happens to the access coefficient. Write three sentences on whether this chapter’s claim survives a cross-section that cannot see reliability or price. Treat nulls as missing, and note that the access years differ.