11. Agriculture and Agribusiness
Learning Objectives
After reading this chapter, you should be able to:
- State agriculture’s share of African employment and of African output, and explain why the two are so far apart.
- Trace how a crop reaches a buyer, through inputs, aggregation, storage, grading and credit, and say who takes the margin at each step.
- Separate the smallholder question from the agribusiness question, and say which identity term each moves.
- Explain why raw cashew leaves the continent and processed cashew does not, and what the same logic does to cocoa and cotton.
- Judge a yield or productivity claim against the survey behind it, using the card’s data-quality fields, and say what the gender-gap literature had to correct first.
Prior work: the cashew value chain, informal cross-border trade in food, and the consumption-city argument are set out in the companion volume, The New Regional Economics, chapters 13 and 14 (Wilse-Samson, 2026), and are cited here rather than repeated.
Sub-Saharan Africa’s food import bill is on the order of $65 billion in 2025, up from about $62.8 billion the year before, with cereals alone roughly $21.9 billion of it (FAO, 2025). That is a continent where farming is the largest single occupation, buying other people’s harvests on that scale every year, and, read the other way, the largest identified import-substitution opportunity anywhere.
1. Overview
Agriculture is where the identity is at its most awkward. It employs the largest share of the workforce and returns the lowest output per worker of any major sector, so a worker who leaves a farm raises the measured average by the act of leaving: the between-sector half of term three, argued over since McMillan, Rodrik and Verduzco-Gallo (2014). The counter-case is equally arithmetic. The countries whose farm productivity grew fastest are the ones whose workers moved fastest, which is why Studwell (2026) makes household farming the recipe’s first step rather than the thing to escape.
| Identity term | What this sector does to it | Value |
|---|---|---|
| One: working-age population | Nothing directly; it inherits the cohort and decides whether it stays rural | 3.39 against 2.63 |
| Two: employment-to-working-age ratio | The residual employer, absorbing entrants who find nothing else | minus 0.08 against minus 0.15 |
| Three: output per worker | The main channel, twice over: yields within, exit between | 0.41 against 1.04 |
Values are median annual growth rates in percent over 2014 to 2024, for the twelve cards with the smallest share of employment outside agriculture against the other forty-two; medians are taken column by column. Sources: UN World Population Prospects 2024 and ILOSTAT modelled estimates, November 2025, via the country cards.
Term three is the sector’s term, and it moves twice in opposite directions at once. Within agriculture, output per worker rises when a farmer gets more grain from the same hectare. Between sectors, it rises when she stops farming, because the activity she leaves is at the bottom of the productivity distribution. Chapter 6 owns the arithmetic of that split; Chapter 10 owns the non-agricultural overlay and its survey coverage. This chapter asks what happens in the fields and the warehouses to make each move.
The countries where this chapter is about everybody
The cards carry no sector fields: no production series, no crop area, no agricultural employment share, and the export-composition fields say what is shipped, not how it is grown. They do show how much rides on crops in a few places: cocoa is 39.9 percent of Côte d’Ivoire’s merchandise exports and coffee 43.9 percent of Ethiopia’s. Every crop number here comes from a named outside source. What the cards supply is the identity position of the countries where agriculture is the largest employer, and the way to pick them is the one overlay that measures it: employment outside agriculture, on fifty-three cards with a median of 59.0 percent. The twelve smallest are the continent’s farming economies.
| Country | Outside agriculture (%) | Term one | Term two | Term three | Wage employment (%) | Informal (%) | GDP per head ($) | Last survey | Confidence |
|---|---|---|---|---|---|---|---|---|---|
| Burundi | 14.6 | 2.94 | 0.06 | -1.87 | 15.1 | 98.0 | 478 | 2020 | low |
| Niger | 26.5 | 4.01 | 0.81 | 0.84 | 10.3 | 98.5 | 750 | 2022 | high |
| Mozambique | 26.9 | 3.25 | -0.47 | 0.57 | 14.5 | 95.5 | 623 | 2022 | medium |
| Chad | 28.1 | 4.14 | -0.43 | -1.31 | 8.5 | 97.6 | 1,165 | 2018 | low |
| Madagascar | 30.5 | 3.03 | -0.16 | -0.05 | 11.5 | 96.1 | 622 | 2012 | low |
| Central African Republic | 34.0 | 1.27 | 0.01 | 1.08 | 14.5 | none | 579 | none | not set |
| Uganda | 34.6 | 4.17 | 0.33 | 0.22 | 19.3 | 94.5 | 1,375 | 2021 | medium |
| Malawi | 34.8 | 3.75 | -1.03 | 0.25 | 38.7 | 92.6 | 625 | 2013 | low |
| Tanzania | 34.9 | 3.55 | 0.03 | 1.92 | 14.5 | 90.8 | 1,292 | 2024 | medium |
| South Sudan | 36.2 | 1.17 | -0.44 | -4.70 | 17.5 | none | 470 | none | not set |
| Mali | 36.5 | 3.54 | -0.72 | 1.33 | 23.1 | 92.8 | 1,190 | 2024 | medium |
| Guinea-Bissau | 38.3 | 2.97 | 0.34 | 1.41 | 24.3 | 94.8 | 1,311 | 2022 | low |
Table 11.1: The twelve cards with the smallest share of employment outside agriculture. The identity terms are annual percentage growth rates over 2014 to 2024 and sum to implied GDP growth; the overlay columns never enter that sum. Ethiopia is the thirteenth, at 39.0 percent. Sources: UN World Population Prospects 2024; ILOSTAT, November 2025; IMF World Economic Outlook, April 2026; the book’s data-quality table; via the country cards.
Three things follow. The twelve hold 20.6 percent of Africa’s population, some 312.2 million people, and produce 9.6 percent of its output. Wage employment barely exists in them: a median wage share of 14.8 percent against 42.3 for the other forty-two, a median informality rate of 95.1 percent against 85.0, and in Chad the continent’s lowest wage share at 8.5 percent. And the measurement is worst exactly here: only six of the twelve have surveyed their labour force since 2021, Madagascar and Malawi last did so in 2012 and 2013, the Central African Republic and South Sudan never have, five carry a low confidence flag and only Niger a high one. Chapter 10’s coverage rule applies with unusual force: the countries this chapter is most about are the ones whose numbers are worst, and they are the ones adding working-age people fastest.
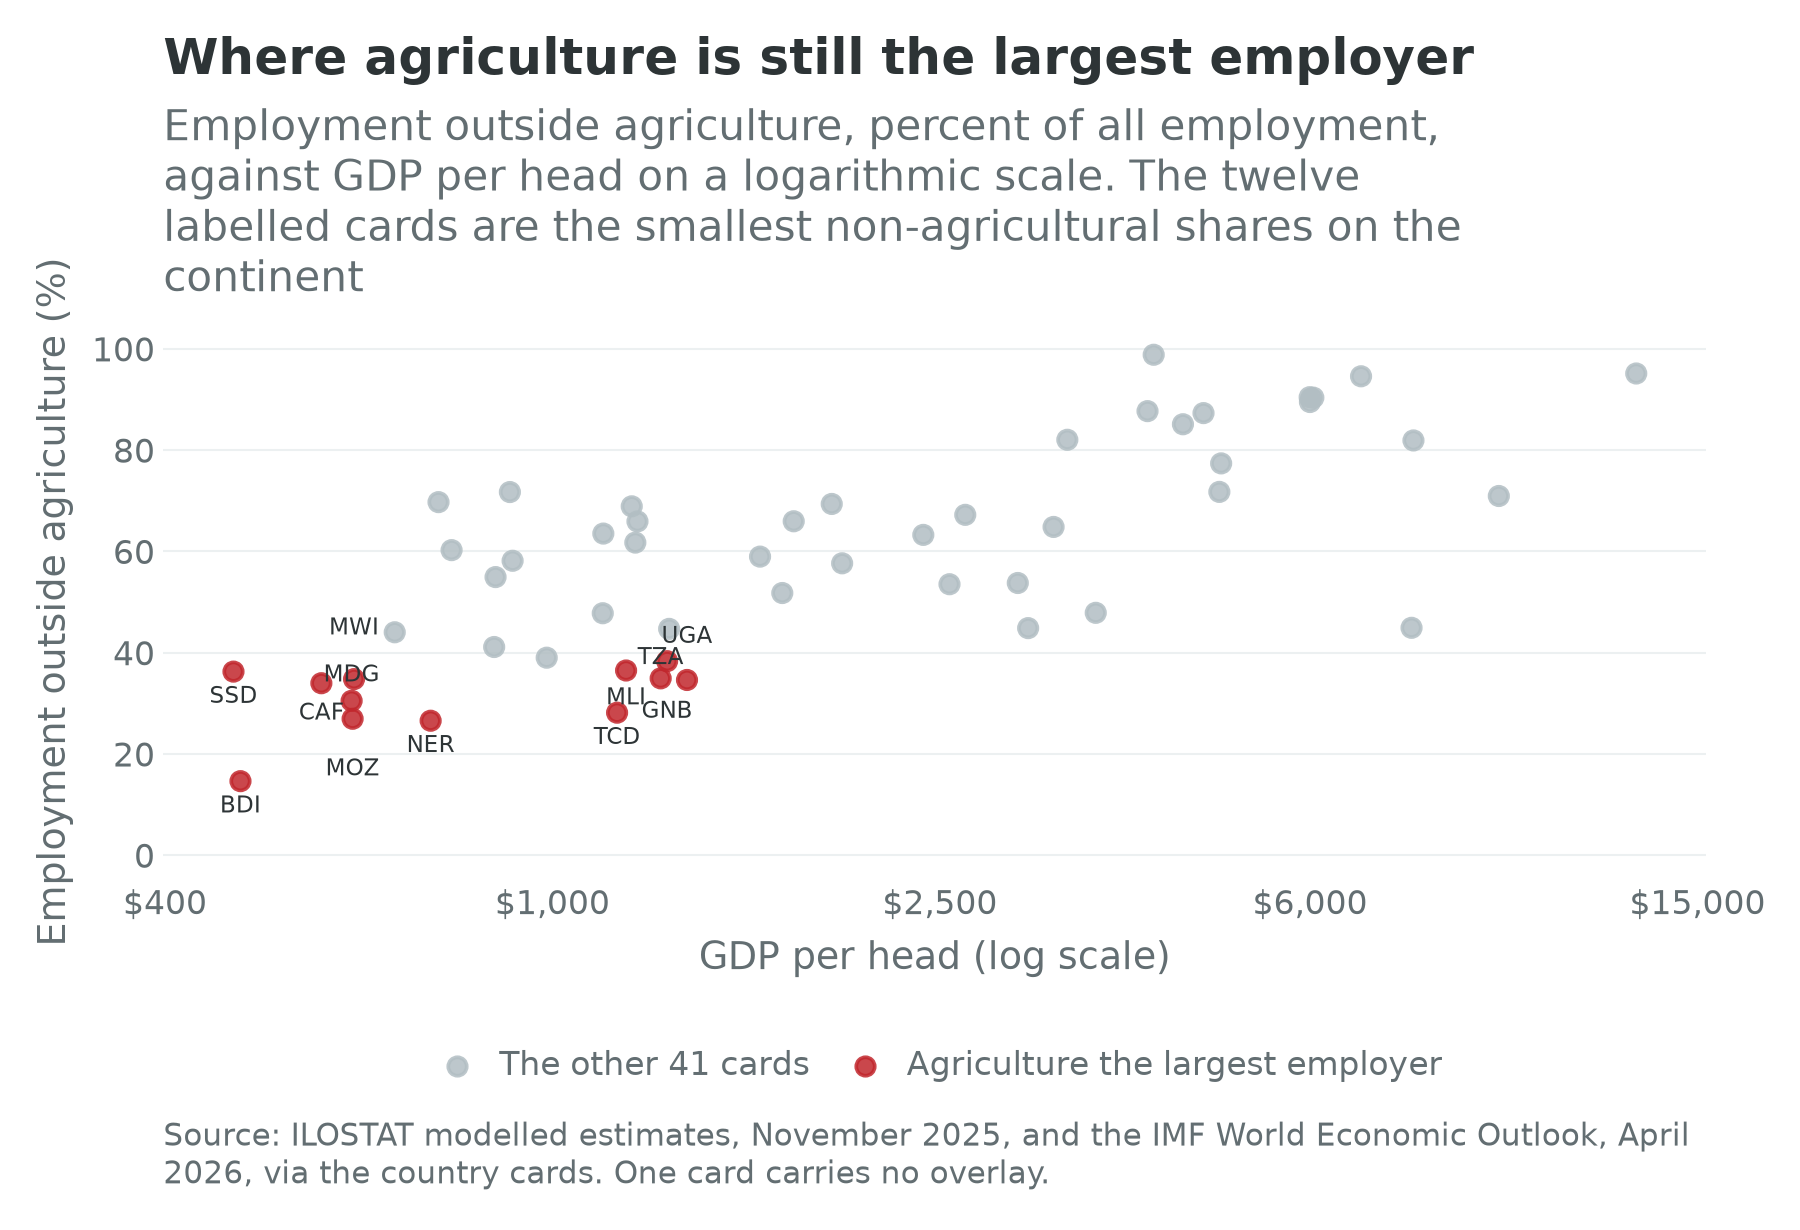
Figure 11.1 shows why the between-sector story is so seductive and so incomplete. The non-agricultural share correlates with the logarithm of income per head at 0.74 across the fifty-three cards, and with the decade’s growth of output per worker at 0.17, which is nearly nothing. Leaving the farm is what a rich country looks like; it is not, on this evidence, what a fast-growing one looks like. And only Mozambique, Uganda, Malawi and Tanzania of the twelve carry the within-and-between split, so for two thirds of the continent’s farming economies the decomposition this literature turns on cannot be computed.
The yield gap
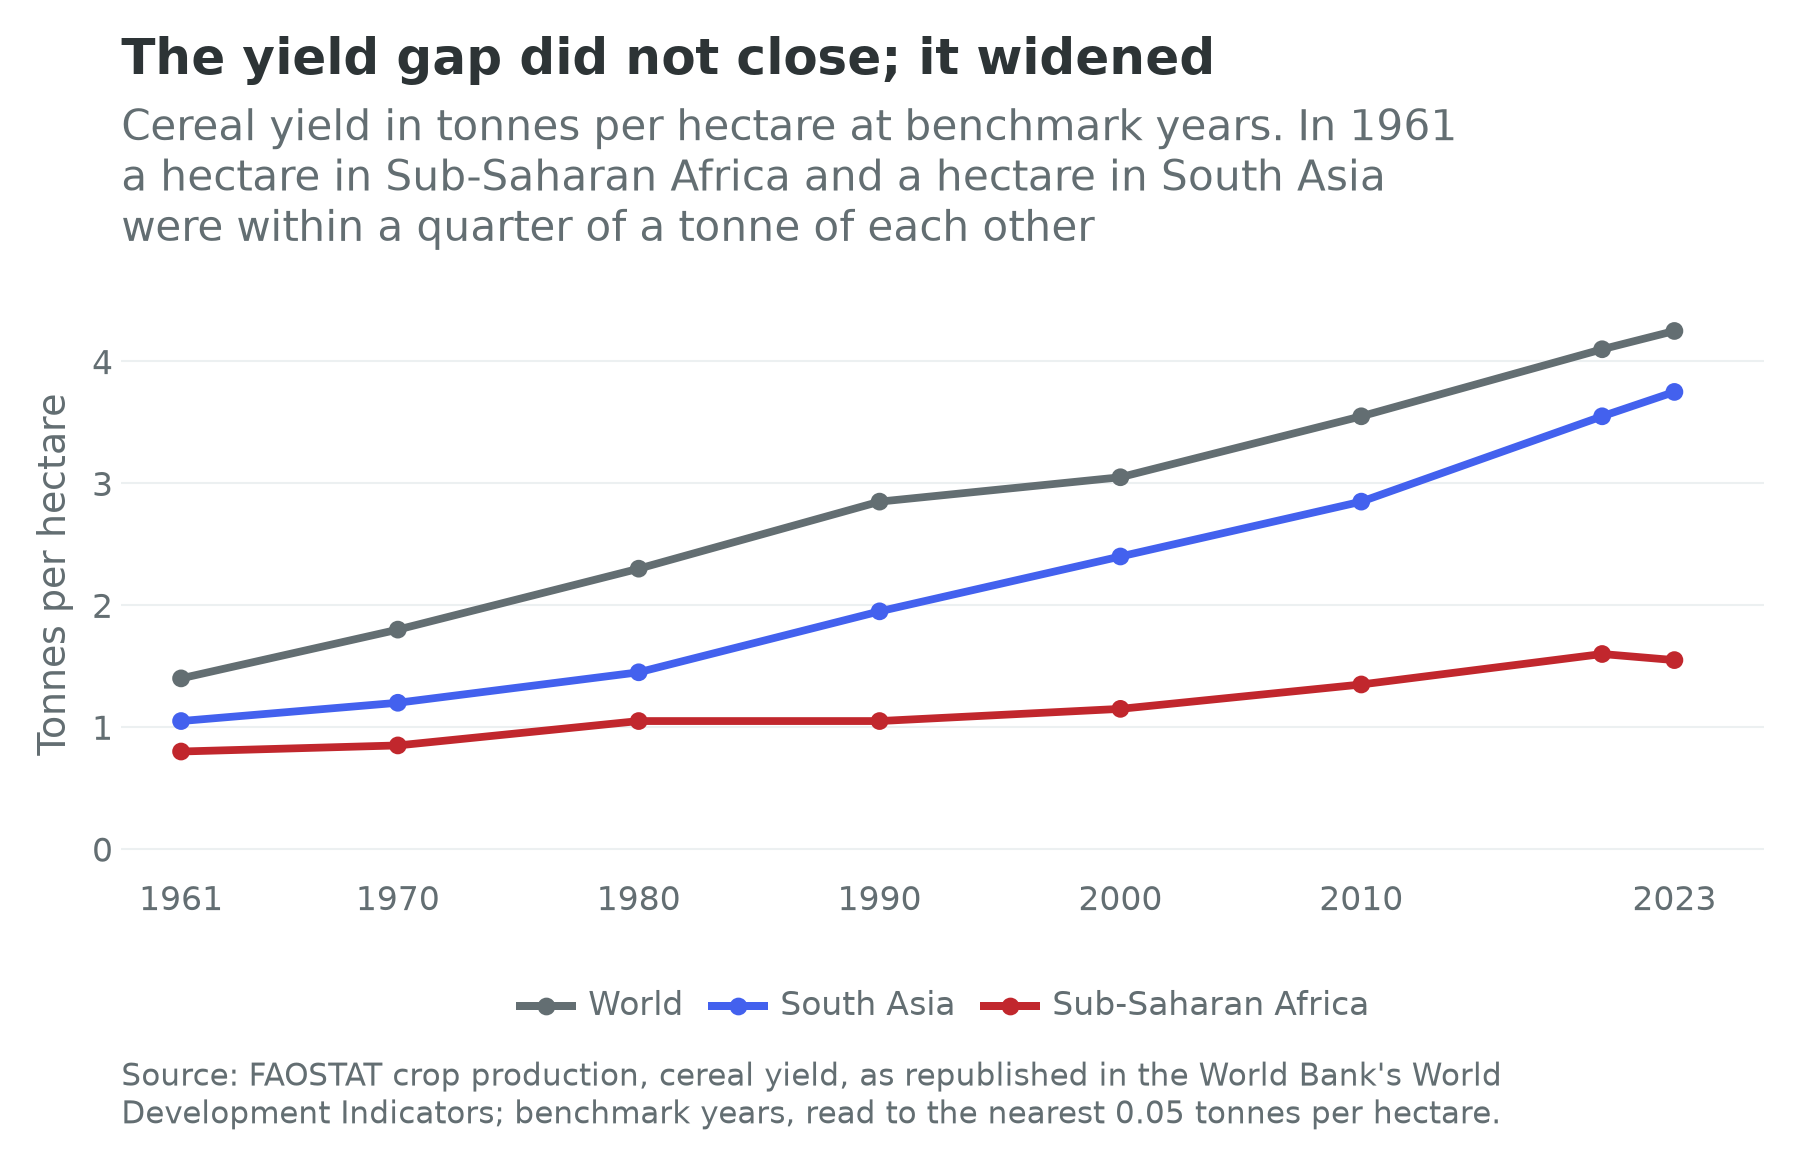
The single most important number in African agriculture is not an employment share; it is the weight of grain a hectare produces. In 1961 a hectare of cereals yielded about 0.80 tonnes in Sub-Saharan Africa and about 1.05 in South Asia, against a world average near 1.40 (FAO, 2026). By 2023 South Asia was at roughly 3.75 tonnes and the world at about 4.25, while Sub-Saharan Africa had reached roughly 1.55 (FAO, 2026). The African figure is now about a third of the world average rather than the nearly three fifths it was. The Green Revolution happened, and it happened to somebody else. African cereal output has grown substantially since 1961, but mostly by planting more hectares rather than getting more from each one, and extensive growth of that kind absorbs labour at constant productivity: more farmers, more land, the same output per worker. The rest of this chapter is an account of why that line is so flat.
2. How the Industry Works
Strip away the aggregates and an African farm is a cash-flow problem with a biological deadline. The farmer needs seed and fertiliser in the weeks before the rains, has no money then because the last harvest is eaten or sold, and will have none for four to six months. Everything below is an institution invented to bridge that gap, and most charge well for it.
Inputs
Fertiliser use in Sub-Saharan Africa runs at roughly 20 kilograms of nutrient per hectare of arable land against a world average near 140 (World Bank, 2026g). African heads of state have twice declared this a scandal: the Abuja Declaration of 2006 promised 50 kilograms per hectare by 2015, which was not achieved, and the Nairobi Declaration of May 2024 committed to tripling domestic fertiliser production and distribution by 2034 (African Union, 2024). The number is stubborn because at prevailing prices, transport costs and yield responses, fertiliser is frequently unprofitable for a smallholder in a dry year and very profitable in a wet one, which is a description of risk rather than of ignorance.
Seed is the other half. Formal seed systems reach a minority of farmers in most of the twelve; the rest save grain from the last harvest, which for maize means losing the hybrid vigour after one generation. Where improved seed does arrive, the question is whether it is what the bag says. Bold, Kaizzi, Svensson and Yanagizawa-Drott (2017) bought urea and hybrid maize seed from Ugandan retailers and had them assayed: the urea contained on average about a third less nitrogen than authentic urea, and the seed a large fraction of grain that would not germinate as an improved variety. A farmer who tries the recommended package once and gets nothing has therefore learned the correct lesson about her own market.
Three governments have tried to solve the input problem by paying for it. Malawi’s Farm Input Subsidy Programme, from 2005, distributed subsidised fertiliser and seed on a large scale, was relaunched as the Affordable Inputs Programme in 2020, and has since been cut back: the 2023/24 programme aimed at 1.5 million farmers on a budget about 30 percent smaller in real terms than the year before (Duchoslav and De Weerdt, 2023). Nigeria’s Growth Enhancement Support Scheme, from 2011, replaced physical distribution with electronic vouchers sent to farmers’ phones, cutting out the state distribution network (Olomola, 2015), and was followed by the Presidential Fertilizer Initiative of 2016, which revived moribund blending plants on raw material from Morocco’s OCP (News Agency of Nigeria, 2021). Ethiopia distributes through cooperative unions under a state plan. All three show that subsidies raise input use while they are paid for, and that the effect on the yield line survives withdrawal only where something else changed too.
Aggregation, storage and grading
Between the farm and the buyer sits the trader, the most misunderstood actor in African agriculture. He arrives with a motorcycle, scales the farmer cannot check, and cash on the day, which is the only one of the three she values. His margin looks extortionate and is mostly a return to bearing risk, holding inventory and knowing a price nobody else knows. Fafchamps (2004) explains why these relationships are personal rather than contractual, and why the answer to a thin market is a network rather than a court.
Storage is where the crop is lost, to insects, damp and aflatoxin. Losses between harvest and market run on the order of 10 to 20 percent of Sub-Saharan grain production, worth around $4 billion a year on the World Bank and FAO’s calculation, more than the region received in food aid over the same period (World Bank, FAO and Natural Resources Institute, 2011). That is a term-three loss with no policy owner: not a yield, trade or credit problem, and so nobody’s programme.
Grading turns a heap into a commodity and a commodity into collateral. The instrument is the warehouse receipt: deposit a graded lot in a certified store, take a document saying what is in it, and borrow against the document rather than against land you may not have title to. The Ethiopia Commodity Exchange, from 2008, built the second-largest exchange on the continent after Johannesburg’s, with a legal mandate that coffee and sesame exports pass through it, and Nigeria has a private one in AFEX (Baulch et al., 2019). Francophone West Africa runs the idea without an exchange, as warrantage: a village group locks its harvest in a joint store, borrows against it, and sells months later at a higher price. A receipt is only ever as good as the warehouse operator’s solvency.
The boards that survived
Most African marketing boards were dismantled under structural adjustment. Two of the largest were not, which is why cocoa behaves unlike every other African export crop. Ghana’s Cocoa Board, COCOBOD, buys the entire national crop through licensed companies at a producer price fixed for the season, and pays for extension and disease control out of the difference between the world and farmgate prices. For three decades it funded the purchase with an annual pre-export syndicated loan from international banks, and for the 2024/25 season, for the first time since 1992, it did not raise one (Adombila, 2024). Côte d’Ivoire’s Conseil du Café-Cacao auctions forward contracts covering most of the coming crop before the season opens and sets a prix garanti at a fixed share of the average price already achieved: for 2024/25, CFA 1,800 per kilogram for the main crop, raised to CFA 2,200 for the mid-crop (Conseil du Café-Cacao, 2025). Farmers therefore do not receive the world price in a spike, as in 2024, or in a collapse, and a board with guaranteed cash flow can fund replanting and disease control no individual farmer would finance.
Contracts, credit and extension
Contract farming is the private version of the same bridge: a processor supplies inputs on credit, provides an agronomist, and deducts the cost from the harvest price. It works where the crop cannot easily be sold elsewhere, which is why it is common in sugar, tobacco, cotton, tea and dairy and rare in maize; the chronic problem is side-selling to a passing trader for cash. Mobile money has changed the mechanics more than the totals, because a payment that once required carrying cash into a village now clears on a phone and leaves the first transaction record most farmers have had. Chapter 16 carries the finance; the agricultural verdict is that digital credit has been better at reaching farmers than at being repaid by them.
Extension is where the state should close the information gap, and it is thin nearly everywhere. Ratios of one agent to a thousand or more farming households are common against a frequently cited norm of one to four hundred, and in several of the twelve the service has effectively ceased outside donor projects (FAO, 2024). Ethiopia is the exception that makes the rule visible. Beside its extension service sits a delivery unit created in 2010 under Meles Zenawi, the Agricultural Transformation Agency, charged with unblocking bottlenecks rather than administering a sector, which became the Agricultural Transformation Institute under a 2021 proclamation (Tegegn, 2022). Its free agronomic hotline had taken about 65 million calls from about 6.5 million callers by August 2023 (Precision Development, 2024). Its best interventions were narrow: a seed-marketing reform letting companies sell direct rather than through cooperative unions, and soil-fertility mapping that replaced one national fertiliser blend with regional ones. Ethiopia also has the highest within-sector productivity growth of the twenty-one countries the transformation database covers. Whether the unit caused that is not identified; what it shows is that the binding constraint here is often administrative rather than agronomic.
Chapter 22 owns tenure, and one part of it belongs here: whether a farmer will plant a tree. Most African cropland is held customarily rather than by registered title, and the effect on annual crops is smaller than the property-rights literature once assumed. The effect on investment with a long payback, meaning trees, terraces, irrigation and soil amendment, is larger: Rwanda’s national land registration raised soil-conservation investment measurably, concentrated among female-headed households (Ali, Deininger and Goldstein, 2014).
3. Industry Structure
Smallholders. The overwhelming majority of African farms are under two hectares and worked by the household living on them. This is not a transitional condition; it is the structure Studwell’s first ingredient wants to make productive rather than consolidate away.
Commercial farms. Four countries have a large-scale commercial sector, each acquired differently. South Africa’s, the largest, is a few tens of thousands of units producing the bulk of national output and generating record agricultural exports of about $13.7 billion in 2024 (Spandiel, 2025). Zambia has perhaps fifteen hundred large farms along the line of rail, a settler legacy reinforced by Zimbabwean farmers who moved north after 2000; Kenya’s sector is highland tea estates and flower farms around Naivasha. Zimbabwe’s is the most instructive: fast-track land reform from 2000 moved roughly ten million hectares from about four thousand large farms to some hundred and fifty thousand smallholder and twenty thousand middle-scale households, and the careful field research found neither the collapse the international press reported nor the success the government claimed, but a redistributed sector producing differently and selling through different channels (Scoones et al., 2010).
Agribusiness. Above the farm sits a processing and trading layer more concentrated than the farming below it, much of it not African-owned. The largest players are commodity traders integrated backwards into origination and forwards into milling: Olam Agri, now majority-owned by Saudi state capital, and the Export Trading Group, founded in East Africa in the 1960s and now moving commodities across some fifty countries with its own warehouses, blending plants and vessels. Beside them are national champions built on the domestic market: Flour Mills of Nigeria, milling wheat since 1960; Dangote, whose refinery at Apapa is one of the world’s largest at about 1.44 million tonnes of annual sugar capacity and which has spent a decade mostly failing to replace imported raw sugar with Nigerian cane (Dangote Sugar Refinery, 2025); and Bidco in Kenyan edible oils. African agribusiness is strongest where an imported bulk commodity meets a domestic consumer and weakest where an African crop would have to become a branded export.
Input supply is the most concentrated layer of all: Morocco’s OCP, Yara as the largest importer of nitrogen into East and Southern Africa, and Seed Co, founded in Zimbabwe and now majority-held by a French seed group, the largest indigenous breeder, selling hybrid maize bred for African conditions across a dozen and more markets (Seed Co Limited, 2025). The counter-case writes itself: the most valuable positions in African agriculture sit outside the farm gate.
The informal fringe. Below all of this is the trade no ministry counts, which the companion volume puts at between thirty and seventy percent of exchange in the Great Lakes (Wilse-Samson, 2026): grain crossing the Kenya and Uganda border on bicycles, cattle walking from Chad into Nigeria. African food does cross borders, in defiance of the trade statistics, in the one commodity class where the tariff schedule is least relevant and the roadblock most.
4. Geographic Distribution
African agriculture is a set of belts older than the states. Cocoa runs along the forest zone from Côte d’Ivoire through Ghana into Nigeria and Cameroon; Chapter 24 carries its pole. The coffee highlands are Ethiopian, Ugandan, Kenyan, Rwandan and Burundian, above about 1,200 metres. The cotton zone is Sahelian, through Benin, Mali, Burkina Faso and Chad, where cotton is the only cash crop that has ever worked at scale. Horticulture is peri-urban and airport-adjacent by necessity: flowers around Naivasha and Debre Zeit, green beans around Nairobi and Dakar, citrus in the Eastern Cape, tomatoes in the Souss and the Nile Delta.
| Crop | Leading African producers | Export earnings ($ billion a year) | Africa’s share of world output (%) |
|---|---|---|---|
| Cocoa | Côte d’Ivoire, Ghana, Nigeria, Cameroon | about 12 | about 70 |
| Horticulture | Morocco, South Africa, Egypt, Kenya, Ethiopia | about 10 | not meaningful |
| Coffee | Ethiopia, Uganda, Côte d’Ivoire, Tanzania, Kenya | about 6 | about 12 |
| Cashew | Côte d’Ivoire, Tanzania, Nigeria, Benin, Guinea-Bissau | about 2.5 | about 55 |
| Cotton | Benin, Mali, Burkina Faso, Côte d’Ivoire | about 2 | about 7 |
| Tea | Kenya, Malawi, Uganda, Rwanda, Tanzania | about 2 | about 13 |
| Sesame | Sudan, Ethiopia, Nigeria, Tanzania | about 1.5 | about 52 |
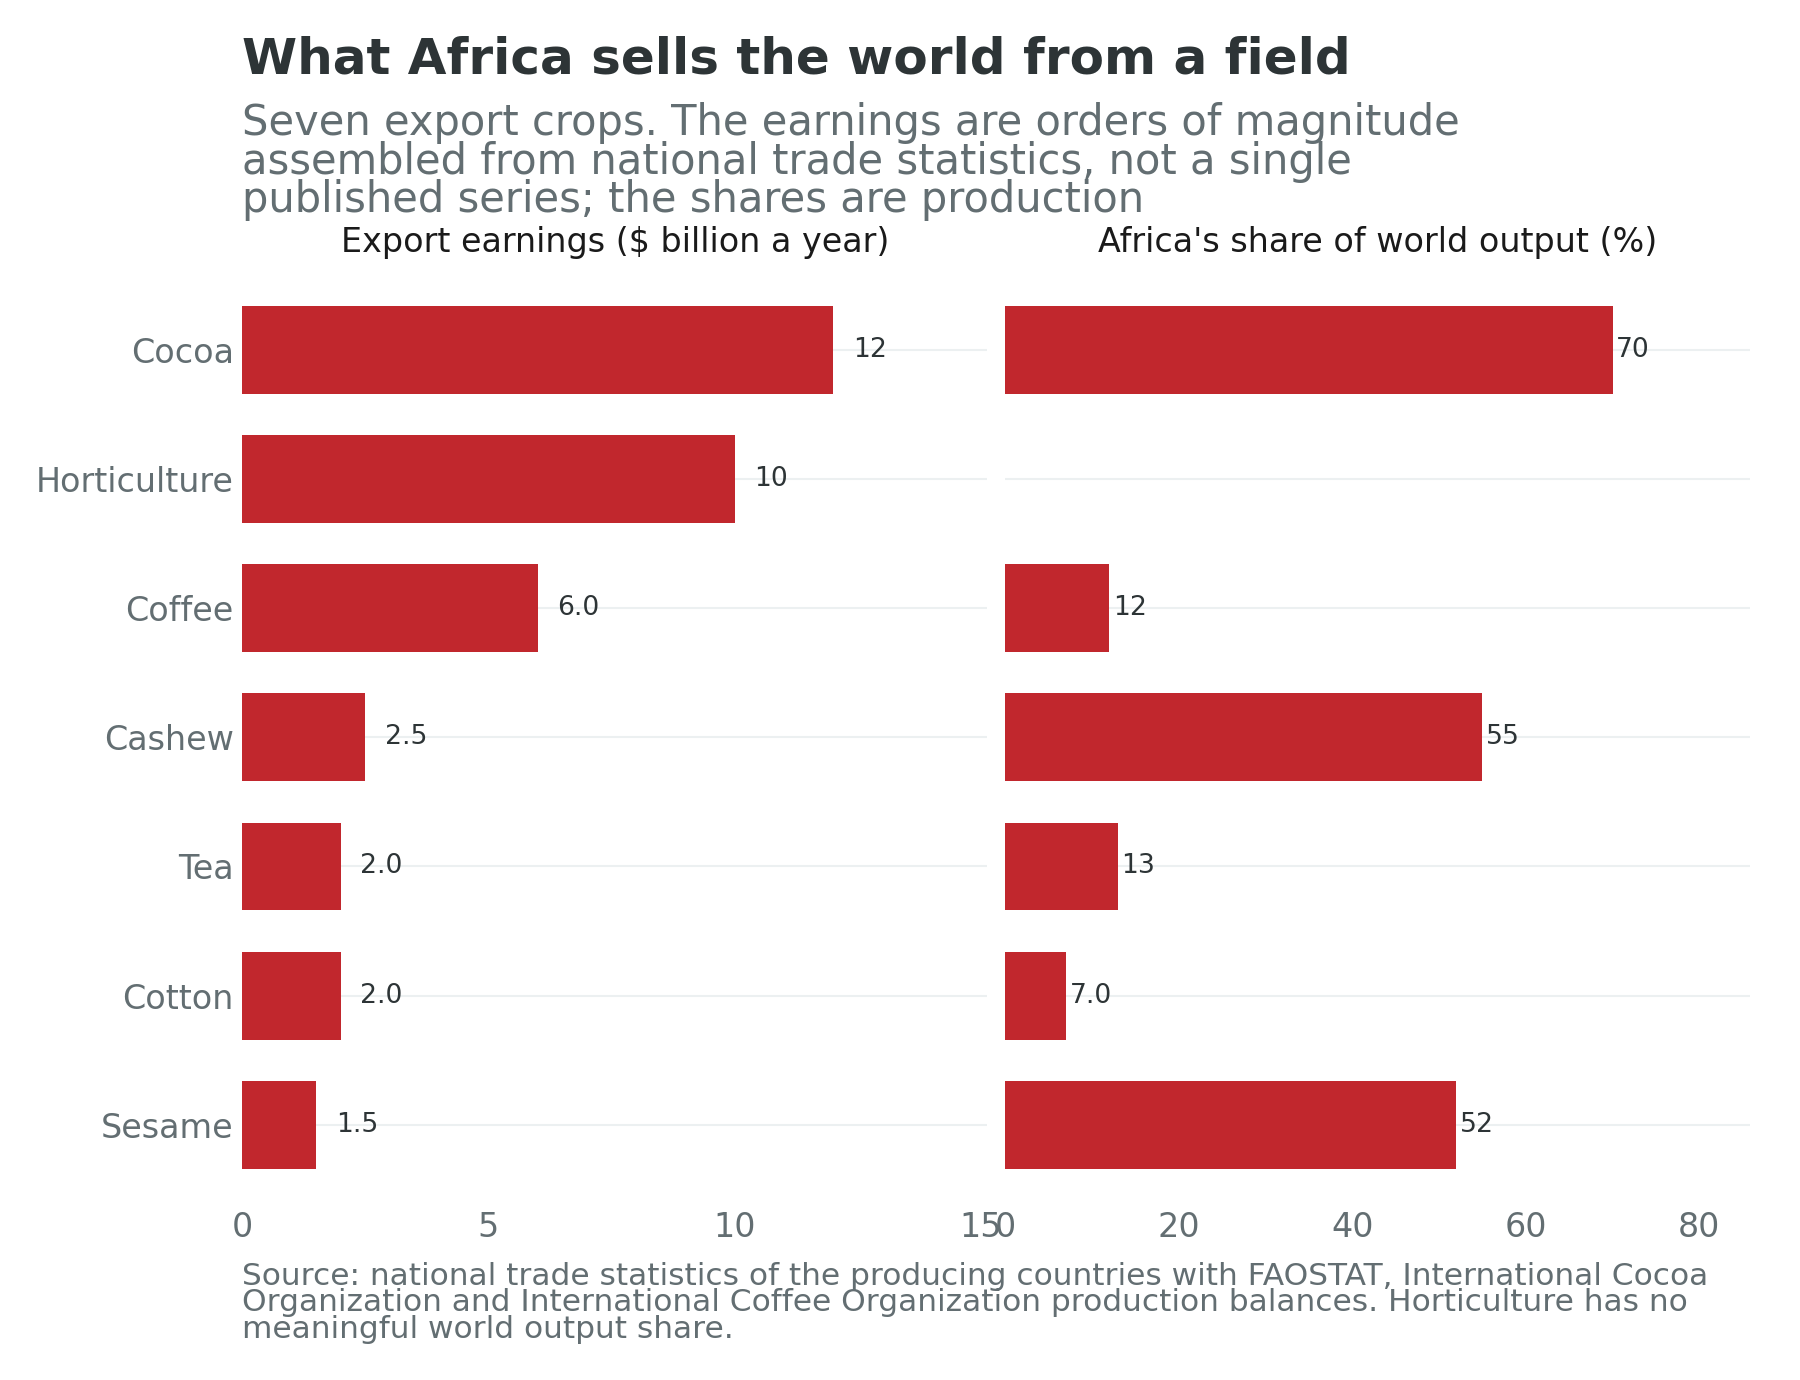
Table 11.2: The earnings column is an order of magnitude assembled from the producing countries’ trade statistics rather than a published aggregate, and is quoted to one significant figure for that reason. The cocoa figure reflects the extraordinary prices of 2023/24 and 2024/25 rather than a larger crop. Sources: national trade statistics of the producing countries, FAOSTAT, and the International Cocoa and International Coffee Organizations.
Two features carry the argument. Africa’s share of world output is high in exactly the crops whose earnings are lowest: the continent grows about seventy percent of the world’s cocoa and about fifty-five percent of its raw cashew and captures a small fraction of the value of either, while the crops where its share is modest, horticulture and coffee, pay best per tonne. Chapter 15 makes the same observation about garments and Chapter 13 about cobalt. The second feature is geography as cost. Côte d’Ivoire’s cocoa travels 300 kilometres to San Pédro or Abidjan; Ethiopia’s coffee travels 900 kilometres to Djibouti over the corridor Chapter 29 describes; Zambia’s maize and Malawi’s tobacco travel to Beira, Nacala or Durban, and Chapter 30 carries that arithmetic. For a crop worth $200 a tonne the corridor decides whether it is exportable at all, which is why the landlocked members of Table 11.1 grow food they eat and the coastal ones grow crops they sell.
The cashew exhibit
Cashew is the clean case, and the companion volume has worked it through: about ninety percent of Africa’s raw nuts are shipped to India and Vietnam to be shelled and return to Europe and North America as kernel at several times the price (Wilse-Samson, 2026). Shelling is labour-intensive, the shell liquid is caustic, the equipment is cheap and the Asian industry has forty years of learning and a working-capital advantage. The policy response, tried in Tanzania in 2018 by buying the entire crop and in Côte d’Ivoire since 2013 by taxing raw exports and subsidising processors, has moved the domestic processing share of the Ivorian crop from about 6 percent in 2016 to about 21 percent in 2023 (Conseil du Coton et de l’Anacarde, 2024). That is a real gain and a slow one, and in its first decade it cost more than the value it added. A raw-export ban is a tax on farmers paid to processors, and it works only if the processors get better fast enough to pay it back.
5. Workforce
Agriculture is the largest employer on the continent and the one whose employment is least like a job. The people in it count as employed because they worked for profit on their own account, the wrinkle Chapter 1 warned about and Chapter 10 measures. Table 11.1’s wage column is the honest summary: in the median farming economy roughly one worker in seven is paid a wage by somebody else.
Women
The most repeated statistic about African agriculture is that women produce between sixty and eighty percent of the continent’s food. It is not true. Palacios-López, Christiaensen and Kilic (2017) went to the household-survey microdata for Ethiopia, Malawi, Niger, Nigeria, Tanzania and Uganda and computed the share of crop labour actually provided by women: about forty percent, with wide variation and no country near eighty. A figure cited in policy documents for three decades turned out to have no measurement behind it, which is worth remembering about every other confidently quoted agricultural share, including some here.
The real finding is the productivity gap. Kilic, Palacios-López and Goldstein (2015) found that plots managed by women in Malawi produced about twenty-five percent less per hectare than plots managed by men, and, decomposing across the distribution, that most of the gap came from differences in the quantity of inputs and in the returns women obtained from them rather than from anything about the farmers. Ali, Bowen, Deininger and Duponchel (2016) found a gap of similar order in Uganda and traced it substantially to labour supply, particularly the childcare burden that keeps women off the plot when weeding matters most. Both point the same way: the gap is an allocation problem with identifiable causes, and closing it is one of the few interventions in this chapter that raises output and welfare together.
The cards give the backdrop. In the farming economies women work at rates close to men’s: Tanzania records 78.5 percent of working-age women employed against 86.6 percent of men, Niger 72.6 against 85.7, and Burundi 79.1 against 76.4, the only card where the female ratio exceeds the male. Where agriculture employs a minority the pattern inverts: Morocco records 17.7 percent of women employed against 62.4 percent of men, Egypt 15.6 against 67.3. Subsistence agriculture is the largest employer of African women, and leaving it has historically meant leaving the labour force.
Wage labour, and youth
Cramer, Sender and Oqubay (2020) argue, against most of the canon, that agricultural wage labour is the underrated engine of rural income change: the poorest rural households are typically not farmers with small plots but households dependent on casual work on other people’s farms. If so, raising smallholder productivity and raising rural wages are different policies, and the sector’s contribution to term two runs through the second. Meanwhile ten to twelve million young Africans enter the labour market each year and the formal economy creates roughly three million jobs (AfDB, 2016). The countries of Table 11.1 supply many of the entrants and almost none of the formal jobs, so agriculture absorbs them by default: a flat or falling employment ratio, and nothing in term three.
6. Regulation and Policy
The continental commitment
Africa has a continental agricultural policy, older and more specific than most people realise. The Comprehensive Africa Agriculture Development Programme was adopted at the African Union summit in Maputo in 2003 with two commitments: at least ten percent of public expenditure to agriculture, and six percent annual agricultural growth (African Union, 2003). The Malabo Declaration of 2014 renewed both to 2025 and created a Biennial Review scoring every member state (African Union, 2014). The Review is the most useful thing in the architecture, because it produced an answer nobody wanted: in the third round, reporting in 2022, only Rwanda was assessed as on track against the full set of Malabo commitments out of fifty-one reporting states (African Union Commission, 2022). A handful meet the ten-percent line in a given year, generally Ethiopia, Malawi, Mali, Burkina Faso and Rwanda; most of the rest are nearer three to five percent. In January 2025 the Union adopted the Kampala Declaration and a new ten-year strategy to 2035, which is what happens when a set of targets expires unmet (African Union, 2025b).
Bans, floors and ceilings
The instruments that bind are cruder. Tanzania, Zambia, Malawi and others ban staple-grain exports whenever a domestic price rises: the bans lower that price by transferring income from farmers to urban consumers, and teach traders that stored grain is a political liability. Import bans run the other way. Nigeria closed its land borders to rice in 2019 to protect domestic milling, then opened a duty-free window for maize and wheat in 2024 when food inflation became intolerable. Price controls on bread and cooking oil are near-universal in North Africa; Chapter 27 carries Egypt’s baladi loaf, a subsidy fiscally indefensible and politically immovable.
The cocoa cartel that nearly worked
In 2018 Ghana and Côte d’Ivoire, which between them grow well over half the world’s cocoa, signed the Abidjan Declaration and began coordinating. In 2019 they announced the Living Income Differential, a premium of $400 per tonne payable on every contract from the 2020/21 crop, on the argument that a duopoly of that size could set a floor. Traders and grinders did not refuse to pay it. They paid the differential and simultaneously pushed the country differential, the origin premium negotiated on top of the futures price, deeply negative, so the farmgate effect was a fraction of the headline (COCOBOD and Conseil du Café-Cacao, 2019). Two producers holding two thirds of world supply found that the binding constraint was not their share of the crop but the number of buyers, and there were about five.
The European rule that redefines the crop
Regulation (EU) 2023/1115 on deforestation-free products, adopted in June 2023, prohibits placing cocoa, coffee, palm oil, soy, rubber, cattle products and timber on the European market unless the operator can show, with geolocation data for the plot of production, that the land was not deforested after the end of 2020; application has been postponed more than once as European operators and producing countries alike proved unready (European Union, 2023a). For West African cocoa this is the most consequential regulation of the decade, converting a supply chain that ran on sacks and trust into one requiring several million smallholdings to be mapped. Côte d’Ivoire and Ghana are further along than anyone expected, because their boards already knew who their farmers were, an unanticipated dividend of not having dismantled them.
Agricultural goods otherwise sit inside the continental agreement’s general architecture: state parties liberalise ninety percent of tariff lines, may designate seven percent as sensitive and may exclude three percent, and the sensitive and excluded lists are, country after country, largely food (tralac, 2025). Chapters 7 and 19 carry the architecture and the flows. Tariffs were never the main barrier to African food trade, and the sanitary and phytosanitary annex, which is the barrier, is the least advanced part of the agreement. A continent that cannot agree on maize aflatoxin limits will not trade maize whatever its tariff schedule says.
7. Recent Trends
The cocoa spike. Cocoa moved from around $2,500 a tonne in 2022 to above $10,000 in 2024, peaking near $12,000 that December, on a West African crop cut by black pod disease, swollen shoot virus, ageing trees, a harsh harmattan and rain at the wrong time (International Cocoa Organization, 2025). The rise did not reach farmers in proportion, because the boards had forward-sold at the old prices: the smoothing mechanism working as designed and being hated for it. Ghana’s board struggled to fund its purchases and its syndicated loan model came under strain.
The fertiliser shock. The 2022 disruption of gas and potash markets roughly doubled the delivered price of nitrogen into African ports and cut application in a region already applying too little, with a lagged effect on harvests through 2023 (AfDB, 2023). It is why the Nairobi Declaration exists.
Ethiopian wheat. Ethiopia has run the continent’s most ambitious cereal-import-substitution campaign, expanding irrigated lowland wheat, and in 2022 the United States agricultural attaché expected the country to export wheat for the first time (United States Department of Agriculture, 2022). The government’s claim of self-sufficiency is contested and the underlying series is not independently verifiable, which is why the country’s low confidence flag matters. Something real happened in the Ethiopian lowlands; how much of it is what the government says is not settled.
Digital agriculture retrenches. The venture wave of 2018 to 2022 funded dozens of firms promising to disintermediate the trader; most have retrenched, and Safaricom closed its own farmer platform in 2023. Section 9 profiles the most instructive failure.
What agriculture is in the book’s two worlds
Chapter 1 set out the assumption underneath the identity and Chapter 9 sketched what the recipe’s first ingredient becomes if it fails. Agriculture is the one sector whose case survives the labour-redundant world intact and whose employment does not. Food is a physical need no model satisfies: in a world where the frontier of production is compute and the marginal worker is not needed, people still eat, and the land, water and sun that grow the food hold their value or gain it. Africa’s endowment in that world is not its workforce but its arable margin and its solar resource, which is what desalination and pumped irrigation would run on. A continent exporting calories to a world with more mouths and fewer farm workers would be running a genuinely good business.
The difficulty is that it would run it with very few people. High-yield agriculture in the second world looks like the Souss, the Nile Delta and Naivasha rather than a Malawian household on a hectare of maize: irrigated, mechanised, sensor-managed, employing a fraction of the labour per tonne. The between-sector term keeps working, because workers still leave the farm, and the within-sector term works better than ever, because capital replaces them. But the destination structural transformation assumed, the factory that would hire them, is what the second world removes. Agriculture then becomes a rent on land and sun collected by whoever owns them, and the sector’s central question moves to the one Chapter 22 asks about title and Chapter 23 about distribution. In the first world Africa’s farmers are the problem to be solved; in the second, Africa’s farmland is the asset to be owned, and it is not obvious that the same people are on both sides of that transition.
8. Climate Exposure
Roughly ninety-five percent of Sub-Saharan African cropland is rain-fed, and irrigated land is on the order of five percent of cultivated area against about twenty percent worldwide and forty percent in South Asia (FAO, 2024). That asymmetry explains more about African agricultural volatility than every policy in section 6: a South Asian farmer with a tubewell has turned a weather event into a pumping cost, and a Sahelian farmer without one has not.
The consequences are the continent’s largest recent shocks. Between late 2020 and 2023 the Horn of Africa recorded five consecutive failed rainy seasons, the worst drought in forty years, an event an attribution study found roughly a hundred times more likely because of human-caused warming (World Weather Attribution, 2023); Chapter 29 carries what it did to the Ethiopian and Kenyan labour force and Chapter 23 the safety net built to absorb it. The Sahel’s drying is longer and slower and is the subject of a section of Chapter 36. Between 2019 and 2021 the worst desert locust upsurge in decades moved through the Horn into East Africa and was contained by an operation across ten countries which, on the FAO’s own estimate, averted cereal losses worth on the order of a billion dollars and more (FAO, 2021).
Two export crops face a slower threat. Cocoa grows in a narrow band of temperature and humidity that the models move: suitable area in Côte d’Ivoire and Ghana is projected to contract and shift upslope this century, and there is not much upslope in either country (Schroth et al., 2016). Arabica coffee is worse. A large share of Ethiopia’s current growing area, in the central scenarios between about forty and sixty percent, could become unsuitable by the end of the century, while relocation to higher ground could in principle multiply the suitable area several times over (Moat et al., 2017). Both halves matter: the crop is threatened where it is grown and not threatened as an activity, and the difference is whether farmers can move, replant and wait five years for a tree to bear. Adaptation is not hypothetical: in south-eastern Zimbabwe, households growing drought-tolerant maize harvested about 617 kilograms a hectare more than comparable households that did not (Lunduka et al., 2019).
9. Firm Profiles
OCP Group, Morocco
Morocco and Western Sahara hold about 50 billion tonnes of the world’s roughly 73 billion tonnes of identified phosphate rock reserves, close to seventy percent (USGS, 2026). The state-owned OCP Group mines them and, unusually for an African resource holder, does not mainly sell rock: it converts it into phosphoric acid and finished fertiliser (United States Geological Survey, 2025). Chapter 28 profiles the group in full as the anchor firm of the Casablanca to Tangier platform; it appears here for its African strategy. OCP Africa formulates soil-specific blends for markets south of the Sahara, on the bet that the yield gap of Figure 11.2 is a demand problem it can create and then serve. The counter-case is that a blending plant is a distribution asset rather than an industrial one. What OCP settles is that the largest input position in African agriculture is African-owned, which is not true of seed, machinery or nitrogen.
Olam Agri
Olam Agri is what the trading layer looks like from inside. Originally the agricultural arm of a Singapore-listed trader built on Nigerian cashew, it originates grain, cotton, rice, edible oils and cocoa across Africa and mills wheat, and has been progressively acquired by the Saudi Agricultural and Livestock Investment Company, which took a minority stake in 2022 and agreed to buy the balance in a transaction valuing the business in the billions (Olam Group, 2025). Its Nigerian operations include an irrigated, mechanised rice farm in Nasarawa State with a mill of 36,000 tonnes a year, commissioned in 2014 (World Grain, 2014), the closest thing in West Africa to a demonstration that a large mechanised farm can compete with imported Asian rice. The ownership matters as much as the assets: the trading layer of African agriculture is being bought by Gulf sovereign capital for reasons about Gulf food security rather than African development, a balance-sheet fact of the kind Chapter 33 takes up. The crop stays African and the margin does not.
Twiga Foods, Kenya
Twiga is here because it failed instructively. Founded in Nairobi in 2014 (Fakiya, 2024), it proposed to fix the produce supply chain by buying directly from farmers and delivering to the informal kiosks that sell most Kenyan food, cutting out the traders of section 2. Investors found this irresistible. By August 2023 the firm was making a third of its 850 permanent staff redundant and handing its sales to independent contractors (TechCabal, 2023), and in January 2024, after a $35 million round that cleared its debts, its co-founder and chief executive left the board (Fakiya, 2024). The post-mortem matters more than the obituary. The traders Twiga was disintermediating were not extracting a rent. They were performing a function, at a cost a venture-funded firm with trucks, warehouses and a payroll could not match, on working capital from their own networks rather than a Series C.
10. What the Experiments Say
What the experiments say: is the constraint agronomic, financial, or informational?
Agriculture is the most heavily experimented-upon sector in development economics, and the trials converge on an unexpected answer. The agronomy is largely known. What is not known, to the farmer, is whether the input in the bag is real, whether the rain will come, and whether she will still have money in March.
The multiplier. Egger, Haushofer, Miguel, Niehaus and Walker (2022) randomised large unconditional cash transfers across 653 villages in Siaya County, Kenya, at a scale worth roughly fifteen percent of local annual GDP, and measured the whole local economy rather than only recipients. They found a local fiscal multiplier of about 2.5 with minimal local inflation. Its agricultural content is that the output response was not on the farm. Revenue gains were concentrated in retail and manufacturing, where firms had idle capacity and sold more when customers appeared.
Timing, not price. Duflo, Kremer and Robinson (2011) offered western Kenyan maize farmers free delivery of fertiliser immediately after harvest, when they had cash, rather than a discount at planting time, when they did not. The nudge raised fertiliser use by about eleven to fourteen percentage points in the first season and about sixteen to eighteen in the second, an effect in the first season comparable to the thirteen to fourteen points from a fifty percent subsidy offered later, at a fraction of the cost. The constraint was a savings problem sitting inside what looked like a price problem.
Who you tell. Beaman, BenYishay, Magruder and Mobarak (2021) worked in two hundred Malawian villages on a soil and water conservation technique, varying whether the farmers trained first were chosen the usual way or by network theory, which picks seeds who between them reach the most people. Theory-based targeting raised adoption measurably: the constraint was informational, and it lay in the structure of the network rather than the message.
Insurance, not credit. Karlan, Osei, Osei-Akoto and Udry (2014) gave northern Ghanaian farmers cash grants, rainfall index insurance, or both. Insurance changed behaviour and cash alone largely did not: insured farmers cultivated more land and spent more on inputs. The binding constraint was uninsured risk rather than a lack of capital.
When you pay for it. Casaburi and Willis (2018) then asked why nobody buys the insurance. Working with Kenyan contract sugar farmers, they offered an identical policy either paid up front or deducted from the harvest payment. Take-up went from a few percent to the large majority. The product was fine; the payment date was the problem, and it is the same date that breaks fertiliser adoption.
What is in the bag. Bold, Kaizzi, Svensson and Yanagizawa-Drott (2017) closed the circle by assaying inputs in Ugandan markets: returns to authentic inputs were high, and returns to inputs bought at a village shop were not.
The systems reading. Put the six together and the constraint is almost never agronomic. It is a chain of financial and informational failures, each occurring at a specific date in the calendar, each fixed cheaply in a trial and rarely at scale. That gap is this literature’s honest verdict, and it is why the next thing this chapter wants is not another experiment but a market in which the urea is real.
11. Data Sources
- FAOSTAT and FAO Food Outlook: yield, production, crop trade and the food import bill.
- ILOSTAT and the GGDC Economic Transformation Database: employment shares and the within-versus-between split, which exists for 21 countries and four of this chapter’s twelve.
- AGRA, the Ethiopian Agricultural Transformation Institute, and the African Union Biennial Review of the Malabo commitments (AGRA, 2025).
- UN Comtrade and the producing countries’ trade statistics, for the export-crop table and the cashew comparison; company reports for the firms named.
- Country cards:
overlays.nonag_employment_share,overlays.wage_employment_share,overlays.employment_female,overlays.employment_male,scale.informal_employment_shareanddata_quality.last_lfs_year. No crop, production or export-composition fields exist.
Connections to Other Chapters
- Chapter 6 (The Informal Economy) owns the within-sector and between-sector split of term three; Chapter 10 (Labor, Youth, and Migration) owns the non-agricultural and wage-employment overlays and the survey-coverage rule used here.
- Chapter 9 (The Studwell Recipe) tests the first ingredient, household-scale agriculture after land reform; this chapter supplies the yields, inputs and extension it consists of.
- Chapter 13 (Critical Minerals) and Chapter 15 (Manufacturing) run the same raw-against-processed argument on cobalt and garments; the cashew exhibit is its cleanest agricultural case.
- Chapter 14 (Energy) carries irrigation’s electricity requirement, Chapter 16 (Finance and Fintech) the rails input credit runs on, Chapter 19 (Trade and Logistics) the corridors that decide whether a $200 crop is exportable, and Chapter 34 the adaptation finance section 8 would be paid for out of.
- Chapter 22 (Land) owns tenure and registration, of which this chapter borrows only the investment margin; Chapter 23 carries the safety nets that absorb a failed harvest.
- Chapter 24 (Lagos to Abidjan) carries the cocoa belt’s pole, Chapter 26 (Nairobi to Mombasa) the tea and horticulture economy, Chapter 28 (Casablanca to Tangier) the OCP group in full, Chapter 29 (Addis to Djibouti) Ethiopian coffee and the Horn drought, and Chapter 30 (Copperbelt to Lobito) the landlocked freight problem.
Discussion Questions
Moving a worker off a low-productivity farm raises measured output per worker even if nothing about the worker changes. Using Table 11.1, say which of the twelve could raise it fastest by this mechanism alone, then say when arithmetic and welfare move together and when they do not.
A minister facing a rising food import bill can subsidise inputs, ban raw exports, or build roads. Rank the three against the identity’s third term and against the traders who carry the crop, then say which of the six experiments in section 10 would change your ranking if it replicated at national scale.
Ghana and Côte d’Ivoire hold about two thirds of the world’s cocoa and could not make a $400 per tonne premium stick; Sub-Saharan Africa holds a comparable share of world raw cashew and has not tried. Set out what a producer cartel needs to work, say which conditions cocoa met and which it did not, and decide whether the European deforestation regulation makes such an arrangement more or less likely.
Try It
Open the three cards side by side: Malawi, Tanzania and South Africa. The first two are in this chapter’s twelve; the third has the continent’s largest commercial farming sector and its highest non-agricultural employment share. For each, read overlays.nonag_employment_share, overlays.wage_employment_share, the three identity terms and the data-quality block. Then switch on the confidence toggle on the Growth Pole Map. The map has no agriculture layer, because the farms and schemes this chapter names have no coordinates the book can source, so the poles and the hatching are what it can show you. Write one paragraph: Malawi last measured its labour force in 2013 and Tanzania in 2024, so which productivity story would you put in a policy note, and what exactly would you say about the other?
Data Exercise
Download all fifty-four cards from the country cards page on this site, as cards.csv or as cards.json if you want the release each number came from travelling beside it, and take the chapter’s cereal-yield data file from the same page. Then do four things. First, rank the 54 on overlays.nonag_employment_share, reproduce the twelve of Table 11.1, and check the population and output shares in section 1 against scale.population and scale.gdp_usd. Second, compute the correlation of overlays.nonag_employment_share with the logarithm of scale.gdp_per_capita and with identity.output_per_worker_growth, and explain in two sentences why the first is large and the second is not. Third, using overlays.employment_female and overlays.employment_male, compute the female-to-male employment ratio for the twelve and for the six countries of the African Union’s Northern region, and say what the two distributions imply about what leaving agriculture has meant for African women. Fourth, from the yield file, say how many extra hectares Sub-Saharan Africa would have needed in 2023 to produce its actual cereal output at its 1961 yield, and what that implies for Chapter 22. Note which fields are null rather than zero, and never impute a null as a zero.
Data Sources and Further Reading
Key data sources
- FAOSTAT (fao.org/faostat): production, area harvested, yield and trade by crop and country from 1961, the source of the yield series here through the World Bank’s republication of it; FAO Food Outlook for the food import bill, a forecast revised twice a year rather than an outturn.
- ILOSTAT modelled estimates (November 2025) for the identity’s second and third terms and the non-agricultural, wage-employment and sex-disaggregated overlays; the GGDC Economic Transformation Database for the within-and-between split on the 21 countries it covers.
- African Union Commission, Biennial Review reports on the Malabo Declaration: the only continental scorecard of agricultural policy performance, useful precisely because it reports failure.
- National marketing boards: the Ghana Cocoa Board and Côte d’Ivoire’s Conseil du Café-Cacao publish producer prices and forward-sale arrangements no international database carries. Company reports: OCP Group, Olam Group, Dangote Sugar Refinery, Flour Mills of Nigeria and Seed Co, each for its own figures and none for its market.
Further reading
- Christopher Cramer, John Sender and Arkebe Oqubay, African Economic Development: Evidence, Theory, Policy (2020), for the argument that rural wage labour rather than the smallholder household is the engine, and Marcel Fafchamps, Market Institutions in Sub-Saharan Africa (2004), for why African agricultural trade runs on relationships.
- Amparo Palacios-López, Luc Christiaensen and Talip Kilic (2017), for the correction of the most-repeated statistic in the field, and Ian Scoones and co-authors, Zimbabwe’s Land Reform: Myths and Realities (2010), for what happens when a commercial sector is redistributed and somebody goes to look.
- Joe Studwell, How Africa Works (2026), for the case that this sector is the first stage of everything, and Chapter 9 for the test of it; Raphael Kaplinsky and Mike Morris (2019) for the value-chain framing behind the cashew exhibit, and The New Regional Economics, chapter 14, for the exhibit itself.