13. Critical Minerals
The Democratic Republic of the Congo supplies about 73 percent of the world’s mined cobalt, some 230,000 tonnes of a world total near 310,000; the next largest producer, Indonesia, supplies 14 percent (USGS, 2026). No country holds a share like that in any other input the energy transition needs. The Congolese card records output of $92.8 billion and $871 a head, and a census taken in 1984. The most strategic mineral position on earth sits on one of the weakest statistical systems on earth, and that conjunction is the chapter.
Learning objectives
After reading this chapter, you should be able to:
- Place mining in the identity, and explain why a mine can raise output per worker sharply and employ almost nobody while the artisanal sector employs very large numbers and raises nothing.
- Describe how an ore body becomes a payment: licence, concentrate, offtake, price, refinery, royalty and the free-carried state stake.
- Set out Africa’s position in world mine production mineral by mineral, distinguishing the chokepoints from the ordinary positions.
- Assess an export ban or a beneficiation mandate against the evidence, including the Indonesian nickel precedent and the African attempts of the 2020s, and say what would have to be true for one to work.
- Read a mineral exporter’s card against its data-quality fields, and say which claims about the sector its numbers will and will not bear.
Prior work: the battery value chain, the Zambian cobalt-import tariff episode and the Kasumbalesa border research are set out in the companion volume, The New Regional Economics, chapter 14 (Wilse-Samson, 2026). This chapter cites that account rather than repeating it.
1. Overview
Chapter 30 owns the Copperbelt as a place: the corridors to Lobito and Dar es Salaam, the Kamoa mine, the Sicomines contract, the Kasumbalesa border and the settlements of the four countries the ore crosses. Chapter 31 owns the eastern Congolese coltan economy. This chapter owns the sector: which minerals, in what quantities, sold into which world market, refined where, taxed how, and with what claim on the income.
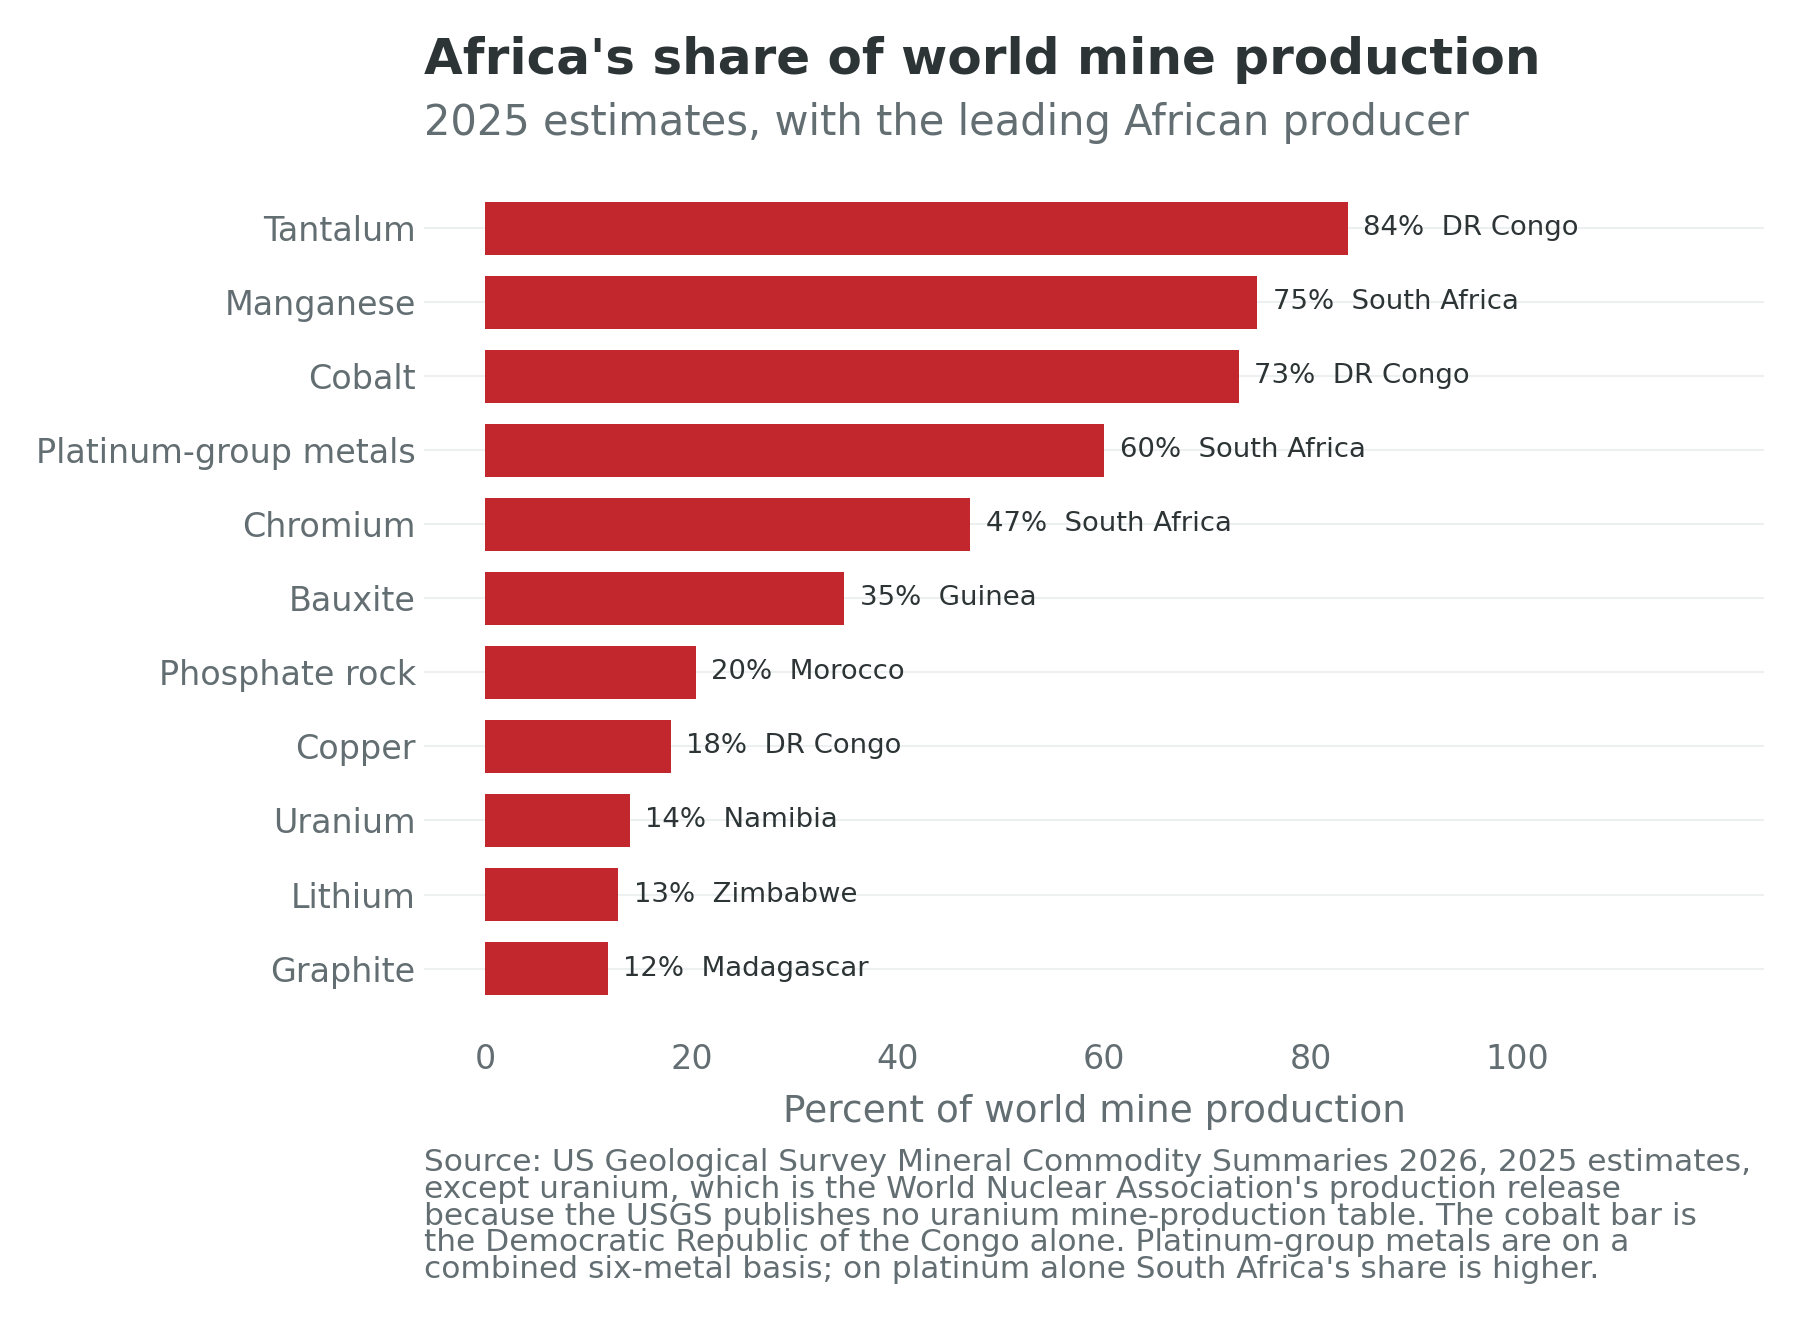
The scale first, because the phrase “critical minerals” invites the reader to imagine a continent that supplies everything. On four of the eleven minerals in the chapter’s table Africa is a genuine chokepoint: tantalum at about 84 percent of world mine production, manganese at about 75, cobalt at about 73 for the Democratic Republic of the Congo alone, and platinum-group metals at about 60 (USGS, 2026). On chromium it is about 47 percent and on bauxite about 35, both dominated by a single country. On the rest it is a supplier among others: about 20 percent of phosphate rock, 18 of copper, 14 of uranium, 13 of lithium and 12 of graphite (USGS, 2026; World Nuclear Association, 2026). The position is deep rather than broad, and the deepest holdings are in the metals that go into steel and batteries rather than into semiconductors.
Where the sector sits in the identity
Recall the arithmetic of Chapter 1: GDP growth is approximately the growth of output per worker, plus the growth of the employment-to-working-age ratio, plus the growth of the working-age population, all three as growth rates. Mining is the book’s purest case of a sector that moves the third term and leaves the second alone. Chapter 30 puts the mechanism in a sentence worth borrowing: a large modern mine is a capital stock with a small crew attached, so a boom lifts the national average of output per worker without lifting anybody’s employment, and the same average falls when the price does, again without anybody being hired or fired.
| Identity term | What this sector does to it | Where the number is |
|---|---|---|
| One: working-age population | Nothing. The cohort arrives whether the mine does or not, and fastest in the largest producer | Table 13.1 |
| Two: employment-to-working-age ratio | Almost nothing formally. The artisanal sector moves it, badly counted, on a definition Chapter 10 shows is generous | Table 13.1, with the wage overlay |
| Three: output per worker | Sharply, in both directions, and almost entirely as rent until processing arrives | Table 13.1 and Figure 13.2 |
The three terms are annual growth rates throughout, as Chapter 1 requires; the numbers behind each row are in Table 13.1. Sources: UN World Population Prospects 2024, ILOSTAT modelled estimates (November 2025), and the IMF World Economic Outlook (April 2026), via the country cards.
Table 13.1 puts the thirteen countries this chapter is mostly about beside each other. They hold 452.7 million people, 29.9 percent of the continent’s, and produce $961.8 billion, 30.7 percent of its output.
| Country | Term one | Term two | Term three | Observed growth | Wage employment (percent) | Informal employment (percent) | Confidence |
|---|---|---|---|---|---|---|---|
| Democratic Republic of the Congo | 3.38 | -0.18 | 1.81 | 4.83 | 14.7 | 97.3 | low |
| Zambia | 3.70 | 0.59 | -0.93 | 3.32 | 27.9 | 82.7 | medium |
| South Africa | 1.61 | -0.45 | -0.48 | 0.67 | 82.7 | 34.8 | high |
| Guinea | 3.06 | -0.71 | 3.90 | 6.33 | 17.8 | not recorded | low |
| Zimbabwe | 2.08 | -0.22 | -0.00 | 1.91 | 29.1 | 85.0 | medium |
| Namibia | 2.64 | -0.37 | -1.05 | 1.18 | 63.2 | 55.6 | low |
| Mozambique | 3.25 | -0.47 | 0.57 | 3.35 | 14.5 | 95.5 | medium |
| Madagascar | 3.03 | -0.16 | -0.06 | 2.83 | 11.5 | 96.1 | low |
| Gabon | 2.55 | 0.20 | -0.78 | 1.96 | 67.6 | 86.1 | medium |
| Niger | 4.01 | 0.81 | 0.84 | 5.73 | 10.3 | 98.5 | high |
| Ghana | 2.52 | -1.56 | 3.48 | 4.45 | 32.2 | 78.1 | medium |
| Mali | 3.54 | -0.72 | 1.33 | 4.27 | 23.1 | 92.8 | medium |
| Tanzania | 3.55 | 0.03 | 1.92 | 5.83 | 14.5 | 90.8 | medium |
Table 13.1. The identity’s three terms as annual growth rates in percentage points over 2014 to 2024, with observed GDP growth for comparison; the last three columns are shares of employment and a flag. Term one is the working-age population aged 15 to 64; term two is modelled employment aged 15 and over divided by that population. Sources: UN World Population Prospects 2024, ILOSTAT modelled estimates (November 2025), and the IMF World Economic Outlook (April 2026), via the country cards.
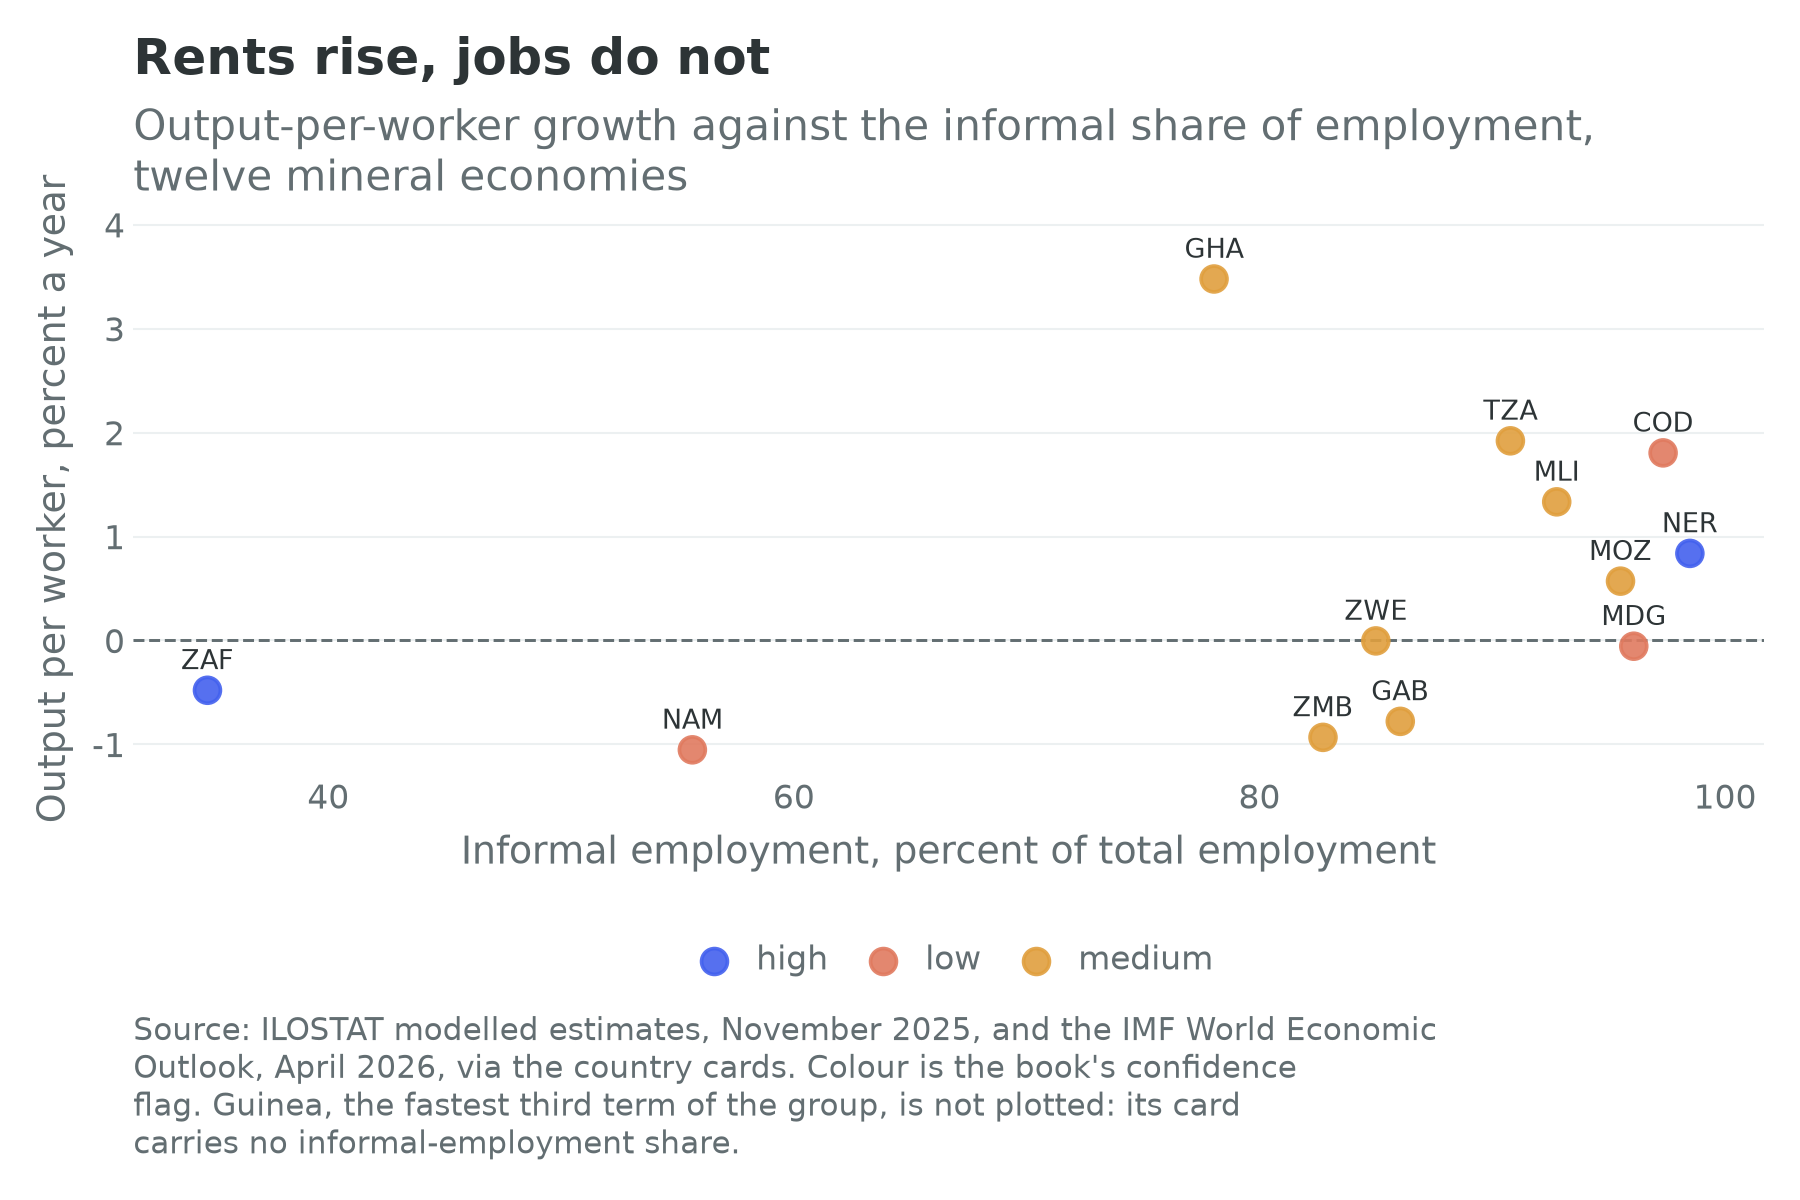
Ten of the thirteen have a falling employment ratio, but since the continental median is itself minus 0.15 percent a year, a mineral economy is not obviously worse than the average in that respect. What is distinctive is the third column, which does not behave like a productivity series at all. Guinea posts 3.90 percent a year, the second highest of the 53 cards carrying the term, and observed growth of 6.33 percent, the third highest on the continent, on a bauxite boom. Zambia posts minus 0.93 percent, Namibia minus 1.05 and Gabon minus 0.78, and none of those is a story about African workers becoming worse at their jobs. It is a story about prices and volumes.
Ghana is the sharpest row. Its output per worker grew at 3.48 percent a year, third highest of the 53, while its employment ratio fell at 1.56 percent, second worst. Chapter 10 reads that as the West African hub problem; here it is a gold economy in which the industrial mines expanded and galamsey, the informal small-scale mining Ghanaians name in one word, absorbed people who appear in the identity as employed and in nobody’s payroll.
What the sector becomes in each of the two worlds
Chapter 1 set out a labour-abundant world in which the marginal worker still matters, and a labour-redundant one in which the frontier of production is a stock of machines whose binding inputs are energy and metal. Almost every sector in Part III is worse off in the second world; this one is better off, and Chapter 30 says so for the Copperbelt. If the machines are the growth, the copper, cobalt and manganese they are made of become the scarce factor, and the continent holding them in concentrations nobody can match is holding an asset the century needs.
The catch is exact, and it is the whole of this chapter. An asset is not an income. For the region on top of the ore to receive that income rather than a fee for letting somebody else take it, four things would have to hold at once: the state would collect a real share of the rent rather than a free-carried stake it did not pay for; the corridor and the grid would be good enough that processing at the mine beat processing in Guangdong; the buyers would be numerous enough that no single refining bloc set the terms; and the money would go to schools, power and a working port rather than a stadium. Not one of the four has held for sixty years. Chapter 35 carries the compute-inputs case as the upside branch of its labour-redundant scenario, and this chapter is why that branch is drawn with a dotted line.
2. How the industry works
A mineral becomes money through a chain of steps, and almost every African policy argument in the sector is about which step the value is captured at.
The ore body and the licence. A deposit is an exploration licence drilled into a resource statement and then into a reserve, the part a bank will lend against. The licence comes from a mines ministry under a mining code, with a relinquishment obligation, a work programme and a state participation attached. Exploration is a decade of spending before a dollar of revenue, which is why the discovery half of the industry is listed juniors with no other assets and the production half is majors with balance sheets.
The mine and the concentrate. What comes out of the ground is rock. Copperbelt ore runs at a few percent metal; a flotation plant turns it into a concentrate of perhaps 25 to 40 percent copper, and a hydrometallurgical plant turns oxide ore into cathode directly. Congolese cobalt is a by-product of copper, produced as a hydroxide of about 30 percent cobalt. Everything downstream follows from one fact: concentrate is mostly not metal, so shipping it 2,000 kilometres to a port is shipping rock, and any step that removes weight near the mine is worth a great deal per tonne saved. That is the honest engineering case for local processing, and it is stronger than the political case usually made for it.
The offtake and the trader. Almost no African mine sells to a final consumer. It sells forward under an offtake agreement, often signed before the mine is built and often with the party that financed it, at a formula price: an exchange reference less treatment and refining charges, less deductions for impurities, less freight. Where the buyer is also the lender the offtake is the security, and the interesting question is not the headline price but the size of the deductions. Where the buyer is a trading house, one firm may own the warehouse, the barge, the smelter and, on the Atlantic route, a share of the railway, which is the conflict Chapter 30 raises about the Lobito concession.
The price. Copper is a listed metal: the London Metal Exchange contract sets the reference, the whole world sees it, and a Zambian finance minister can read tomorrow’s revenue on a screen. Cobalt is not. Its market is thin, its trade is dominated by a handful of buyers, and its price is an assessment published by price-reporting agencies rather than an exchange settlement. Cobalt reached four-year highs in the first quarter of 2022 (Bird, 2022) and then fell for nearly three years, to a nine-year low of about $24,300 a tonne for the metal in January 2025 (Williams, 2026). Then the Congolese state did something no African mineral producer had done at this scale: it stopped the exports.
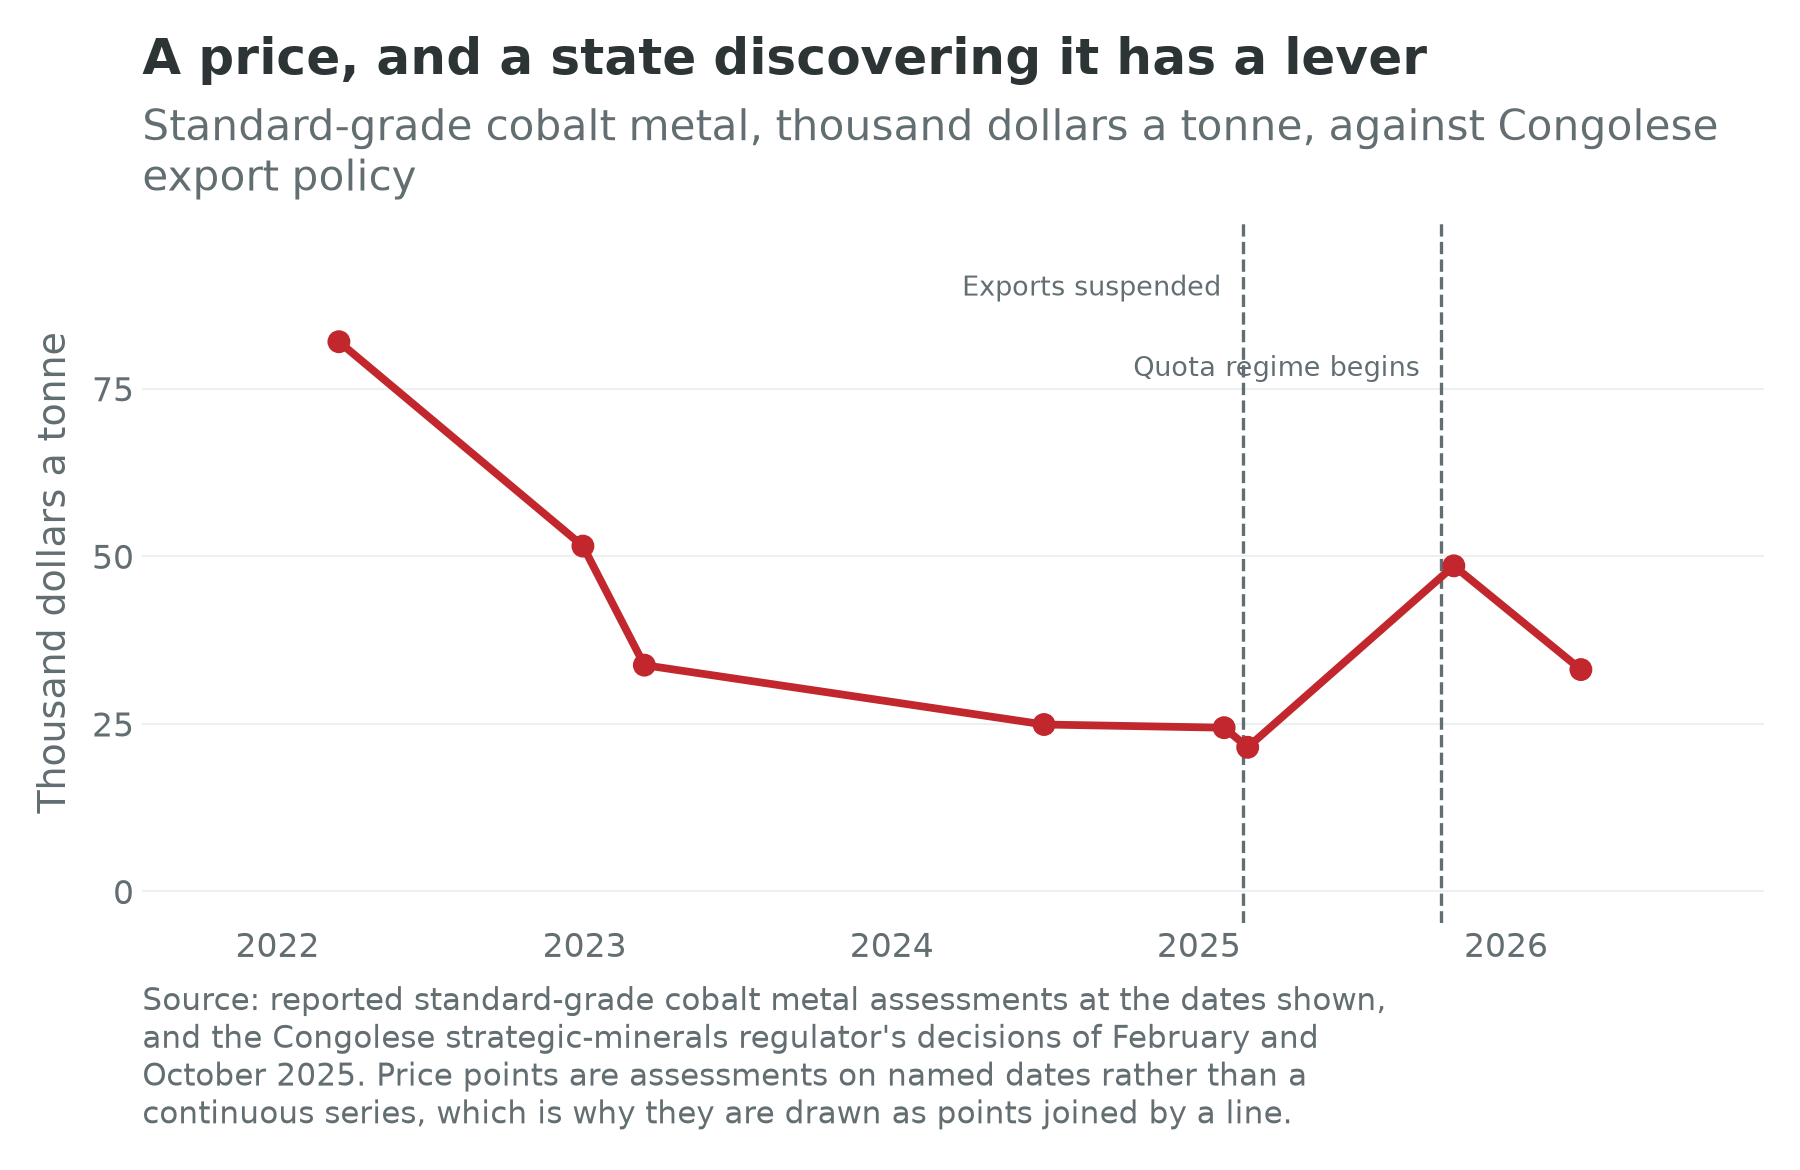
The suspension of 22 February 2025 halted all cobalt exports (Bloomberg, 2025); it was extended twice and replaced from 16 October 2025 by a quota allowing 18,125 tonnes for the remainder of that year and 96,600 tonnes a year for 2026 and 2027 (Bird, 2025), a regime Chapter 30 dates and reads politically. The cobalt metal price, about $24,300 a tonne at the start of 2025, was above $47,000 by late October and about $53,000 at the end of December (Williams, 2026). Two lessons sit in that curve. The chokepoint is real: a single government more than doubled a world price within a year, which no African producer of any other commodity has managed in living memory. And moving a price is not the same as collecting the difference, because the tonnes inside the quota belong to the same operators as before, so whether a producer whose volumes are capped and whose price has doubled earns more depends on where in the cap it sits.
The royalty, the tax and the state stake. The public claim on a mine has three parts and they behave differently. A royalty is a percentage of gross revenue, collected whether or not the mine makes a profit, which is why revenue authorities like it and investors do not; the Congolese mining code of 9 March 2018 raised it from 2 percent to 10 percent on cobalt and other minerals designated strategic, against 3.5 percent for ordinary metals (DRC, 2018). Corporate tax is a claim on an accounting number, in an industry where the miner, the smelter, the trader and sometimes the railway belong to one group, so the price at which the concentrate leaves the country is an internal price. That is a description rather than an accusation, and it is why the region’s revenue authorities have moved towards taxing volume and gross value, with export reference pricing and pre-shipment assay verification: the assay decides how much metal the state is paid for, and until recently very few could run their own. The third part is the free-carried state stake, typically 10 to 20 percent, equity the government did not pay for and cannot sell, which pays a dividend only after the mine has serviced its debt and is worth nothing at all in the years a mine is being built.
The refinery, and where it is. The last step is the one the continent does not have. China refines the large majority of the world’s cobalt, on the order of four fifths of refined output in 2025, a large share of its copper, and the lithium chemicals that go into a battery cell (Cobalt Institute, 2026). A Congolese cobalt hydroxide cargo goes to a Chinese refinery; a Zimbabwean spodumene concentrate to a Chinese converter; a Guinean bauxite cargo to a Chinese alumina refinery. This is what every beneficiation policy in Sections 6 and 7 is aimed at, and it is a hard fact rather than a scandal: refining is capital-intensive, energy-intensive and scale-hungry, earns a thin margin on a large throughput, and is built where power is cheap and the customer already is. Chapter 14 is the energy chapter for a reason.
3. Industry structure
Ownership divides into five groups, and the balance-sheet lens of Chapters 21 and 32 asks the same question of each: who holds the asset, and where do the returns land. The list is written from the African pit looking out. The Gold Fields profile in Section 9 turns the question around: an African-listed miner holding most of its ounces outside the country that lists it.
The Western majors hold the largest assets outside the Copperbelt’s Congolese half: Anglo American’s platinum business beside Sibanye-Stillwater and Impala on the South African reefs; Rio Tinto at Simandou; Glencore as both a major producer at Kamoto and Mutanda and one of the world’s largest metals traders, a combination with no equivalent in oil; First Quantum, Canadian, as the largest miner in Zambia; Barrick at Lumwana; Vedanta, Indian-owned and London-listed, at Konkola.
The Chinese majors hold the Congolese cobalt position almost outright. CMOC operates Tenke Fungurume and Kisanfu; Zijin is half of Kamoa with Ivanhoe; Sinomine and Huayou hold the Zimbabwean lithium mines; China General Nuclear and China National Uranium hold the two largest Namibian uranium mines. Chinese firms have bought into the assets whose output feeds Chinese refineries, which is vertical integration rather than portfolio investment, so the offtake question and the ownership question are one question.
The state companies are the weakest link and the most consequential. Gécamines in the Democratic Republic of the Congo and ZCCM Investments Holdings in Zambia hold minority stakes in most of their countries’ mines and operate almost nothing at scale, collecting dividends, royalties on their own account and settlement payments; Chapter 30 covers the ownership settlements they were party to. The sector point is that a state holding company that does not operate has no independent source of technical information about the assets it owns, which is the deepest form of the appropriability problem.
The Gulf entrants matter because they change the number of bidders: International Resources Holding of Abu Dhabi took 51 percent of Mopani Copper Mines in March 2024 with ZCCM-IH retaining the balance, a transaction Chapter 30 describes. A landlocked producer with three sets of potential buyers bargains better than one with two.
The artisanal fringe and the cooperatives are the sector’s largest employer and its smallest share of value. More than 100,000 people work artisanally in the Congolese copper and cobalt provinces (BGR, 2026), organised into cooperatives that in principle sell through licensed traders and in practice sell to whoever is at the pit gate, and by 2024 they supplied only about 2 percent of Congolese cobalt (Cobalt Institute, 2025).
4. Geographic distribution
The map is short. Four clusters carry almost everything.
The Central African copper and cobalt arc runs from Kolwezi through Lubumbashi across the Kasumbalesa border to Ndola and Kitwe. Chapter 30 owns it: the mines, the two railways, the border, the smelters and the power. The chapter’s data file lists the operations, from Kamoa-Kakula and Tenke Fungurume on the Congolese side to Kansanshi, Sentinel, Lumwana, Mopani and Konkola on the Zambian.
The Bushveld complex and the Kalahari manganese field in South Africa hold the platinum-group metals, the chromium and the manganese; Chapter 25 owns the pole they sit in. What belongs here is that chromite and manganese are ferroalloy inputs smelted with enormous quantities of electricity, and South Africa’s ferrochrome industry has been closing furnaces for a decade because its electricity is no longer cheap. That is the beneficiation argument running in reverse, in the one African country that had already won it.
The West African bauxite and iron belt runs from Boké on the Guinean coast into the Simandou range near the Liberian border, with Ghanaian bauxite at Awaso and Malian and Ghanaian lithium at the southern edge. Guinea is the world’s largest bauxite exporter and, since November 2025, an iron-ore exporter too. The Southern and Indian Ocean minor clusters are the uranium of the Namib desert, the graphite of northern Mozambique and eastern Madagascar, and the lithium of the Zimbabwean pegmatites: single-commodity, single-corridor economies in miniature, each with a card in Table 13.1 whose third term is set by one price.
Two absences are as instructive as the clusters. The Sahel’s mineral economy is gold, much of it orpaillage, and Chapter 36 carries it because its economics are inseparable from its security. And there is no African semiconductor-mineral cluster: rare-earth production is negligible, and the tantalum position, the closest thing to an electronics chokepoint, sits in the one place where nobody can measure it (Chapter 31).
5. Workforce
Mining employment in Africa is two labour markets that share a commodity price and nothing else.
The industrial market is small, formal, well paid by local standards, heavily unionised in Southern Africa, and shrinking per tonne. It is why South Africa’s card looks unlike any other in Table 13.1: a wage-employment share of 82.7 percent, the highest of the 53 cards carrying it, and an informal share of 34.8 percent, both artefacts of a century of industrial mining and the migrant-labour system that built it. Namibia at 63.2 percent and Gabon at 67.6 are the same pattern in smaller economies. Set those against the Congolese 14.7 percent, the Tanzanian and Mozambican 14.5, the Madagascan 11.5 and the Nigerien 10.3, and the point is made: a mineral endowment does not produce a wage economy, and the countries here that have one got it from something else.
The artisanal market is the opposite on every axis: large, informal, dangerous, paid by the sack, quicker to move with the price than any formal employer. The Congolese creuseur digging cobalt at Kasulo, the Ghanaian galamsey operator working a licensed concession’s margins, the Zimbabwean gold panner and the Tanzanian small-scale miner are one economic actor, a worker with no capital entering an activity whose only entry requirement is a shovel and a buyer. Nobody knows how many there are. A 2025 field survey counted 112,351 artisanal miners at 75 copper and cobalt sites in two Congolese provinces, a floor rather than a census (BGR, 2026); Ghanaian estimates of galamsey run from tens of thousands to several hundred thousand miners, a disagreement of a factor of ten (Africa Center for Strategic Studies, 2025a). Chapter 6 explains why that range is what it is rather than a failure of somebody’s arithmetic.
Two consequences follow for the identity. Artisanal mining is the only channel through which this sector touches term two at all, and it touches it in the way Chapter 10 warns about: everyone digging is employed on the international definition, and nobody digging has a wage, a contract or a payslip. And the two markets are substitutes at the margin in a way that flatters the statistics. When the price falls, industrial mines cut capital spending and artisanal production rises, because the digger has no alternative and no fixed cost, so measured employment goes up and measured output per worker goes down. When the price rises, the mines expand, the state tries to formalise the diggers, and output per worker rises without a job being created. Term three in these economies is a price index wearing a productivity series’ clothes.
The gender split matters and the standard claim is wrong in an interesting way. Industrial mining is overwhelmingly male at the face and materially less so in the plant and the offices, while the surrounding service economy of a mining town is heavily female and largely informal, which is where Section 10 finds a mine’s employment effect actually living.
6. Regulation and policy
Five instruments do most of the work, and their track records differ sharply.
The mining code sets the royalty, the tax, the state share and the stability period. The Congolese code of March 2018 is the model of a successful renegotiation: it raised royalties, designated cobalt strategic, shortened the stability clause, and passed over the objection of every major operator in the country, evidence that a state with a genuine chokepoint has more room than the investment-climate literature allows (DRC, 2018). Zambia is the counter-model, and Chapter 30 tells it: a royalty and tax regime rewritten repeatedly in both directions over twenty years, in an industry whose payback runs to thirty. The lesson is not that a higher take is bad but that the variance of the take is what deters investment, and the two are easy to confuse.
Export restrictions are the instrument of the decade, and Africa now has a natural experiment running. Zimbabwe banned the export of unprocessed lithium ore in December 2022 while continuing to allow concentrate out; in June 2025 it announced that concentrate exports too would end from January 2027, to force production of lithium sulphate at home; and in February 2026 it suspended exports of all unprocessed minerals, including lithium concentrate, ahead of its own schedule (Government of Zimbabwe, 2026). Namibia banned exports of unprocessed lithium, cobalt, manganese, graphite and rare-earth ores in June 2023 (Government of Namibia, 2023). Guinea revoked the bauxite concession of an Emirates Global Aluminium unit in August 2025, a step its mines minister tied to the firm’s failure to build a promised alumina refinery, and the government aims to have five or six refineries by 2030 (Reuters, 2025). The Congolese cobalt suspension and quota are a restriction of a different kind, aimed at the price rather than the processing step.
Local content and beneficiation mandates are the softer version: obligations to buy inputs and services locally, to employ and train nationals, and in some codes to process a stated share at home. Gabon’s answer to the manganese question has been a plant rather than a ban, the metallurgical complex at Moanda, launched in 2015 with a 65,000 tonne-a-year silicomanganese plant and a 20,000 tonne-a-year manganese-metal plant, which turn ore that would otherwise ship as rock into alloy and refined metal (Kilian, 2015); in 2025 the government announced that raw manganese exports would end by 2029 (Africanews, 2025).
The international regimes are written elsewhere and least discussed by African governments. The OECD’s due-diligence guidance for minerals from conflict-affected and high-risk areas, in its third edition, is the standard every downstream buyer points at; the European Union’s battery regulation of 2023 imposes due-diligence and carbon-footprint obligations on batteries placed on the European market, which reach back up the chain to the mine; and the European deforestation regulation, often lumped in with them, does not list minerals among its commodities and touches mining only through land clearance and the precedent of a mandatory traceability system (European Union, 2023b). The Dodd-Frank Act’s section 1502, passed in 2010 and implemented from 2012, is the oldest of these and the only one with a serious evaluation attached; Section 10 reports what it found.
The partnership diplomacy of the 2020s belongs here rather than under external relations, because it is aimed at the processing question. The European Union signed strategic partnerships on raw-material value chains with Namibia in November 2022, with the Democratic Republic of the Congo and Zambia in October 2023 and with Rwanda in February 2024 (European Commission, 2024). The Minerals Security Partnership, a grouping of fifteen founding partners, opened a forum in 2024 whose members now include Namibia, the Democratic Republic of the Congo and Zambia (United States Department of State, 2024). And on 4 December 2025 the United States and the Democratic Republic of the Congo signed a strategic partnership agreement creating a designated reserve of critical-mineral and gold assets alongside cooperation on infrastructure and governance, contested inside the country and worth watching for its implementation (United States Department of State, 2025). Chapter 30 describes the Lobito financing that is the physical half of the same policy, and Chapter 32 the Chinese position it responds to.
7. Recent trends
The onshoring argument, and what it has actually produced. The case for processing at home deserves its strongest statement. Concentrate is mostly rock, so smelting near the mine saves freight on the discarded fraction. A refinery is a wage bill, a skills base and a tax base that a mine is not. And a country selling a chemical rather than an ore sells into a market with more buyers and a less volatile price. The Indonesian nickel case is the exhibit: a ban on unprocessed nickel ore, partial from 2014 and complete from 2020, coincided with a large domestic smelting industry and a collapse in the world nickel price as that capacity came on (Lebdioui, 2024).
Now the counter-case. Indonesia had four things the African cases mostly do not: a domestic market large enough to matter to the buyers, electricity at a price a smelter can pay, a stainless-steel industry to sell into, and Chinese nickel processing capital that wanted to build there anyway. Where those hold, a mandate accelerates something already happening. Where they do not, an export ban is a tax on the only activity the country has.
The African record is thin and instructive. Zimbabwe’s ban on raw lithium ore in December 2022 did produce concentrators, because concentration is cheap and the Chinese owners of the mines were building them anyway; it has not yet produced a lithium sulphate plant at scale, which is why the deadline moved and moved again (Government of Zimbabwe, 2026). Namibia’s 2023 ban applies to commodities the country barely produces, so its bite is prospective (Government of Namibia, 2023). The Congolese battery-precursor ambition and the joint special economic zone agreed with Zambia have produced documents and, as Chapter 30 records, almost no construction; the companion volume’s account of the Zambian cobalt-import tariff shows how easily two neighbours can tax each other out of a value chain they had agreed to share (Wilse-Samson, 2026). Ghana granted a mining lease over the Ewoyaa lithium deposit in October 2023, and its parliament ratified it only in March 2026, with the royalty moved to a sliding scale of 5 to 12 percent that rises with the spodumene price (Atlantic Lithium, 2026). The pattern is that the step a mandate can force, concentration, is cheap, and the step it cannot force, refining, is the one that needs power.
Simandou shows how expensive the exception is. Operations began in November 2025 at the Simandou iron-ore project in south-eastern Guinea, developed by Rio Tinto with Chinalco and the Guinean state on two blocks and by the Winning Consortium Simandou on the other two, with more than 600 kilometres of new trans-Guinean railway and new port facilities and a combined design capacity of up to 120 million tonnes of ore a year (Rio Tinto, 2025). It is the largest greenfield mine and infrastructure project on the continent, it took nearly thirty years from discovery, and its rail line is multi-use by obligation, the single most consequential clause in the agreement.
The price cycle has turned. Copper traded above $10,000 a tonne through much of 2025 on demand from electrification and data-centre construction, cobalt did what Figure 13.3 shows, and lithium collapsed and stayed low. A commodity boom is the moment when a producing state’s bargaining power is highest and its incentive to think about the next thirty years is lowest. That is the tension Chapter 30’s diagnostic names as appropriability, and it is being tested now on the Lobito corridor.
8. Climate exposure
The sector’s climate exposure runs through water and power rather than through weather at the pit, and it runs in both directions. Copper and cobalt processing is water- and electricity-intensive, and the electricity in the two Copperbelt countries comes from rivers: Chapter 30 records what the 2024 drought at Lake Kariba did to Zambian generation and therefore to the mines, and what the failure of a tailings dam at Chambishi in February 2025 did to the Kafue basin on which much of Zambia’s non-mining employment depends. A mining sector that needs hydropower is betting on rainfall, and every processing plant the beneficiation policies of Section 6 would build adds load to a grid already short; a mining sector that stores acidic, metal-bearing waste behind embankments designed against a rainfall distribution that is changing is exporting its risk to the agricultural economy next door. Cobalt adds a third exposure, being toxic in the dust and the effluent, and the artisanal pits where it is handled without protection are exactly the places with no environmental monitoring. The identity connection is uncomfortable: the sector that carries term three in these economies subtracts from the base that would have to carry term two.
9. Firm profiles
CMOC Group, Tenke Fungurume and Kisanfu, Democratic Republic of the Congo
CMOC is here because it made the Congolese cobalt position a Chinese asset, and because its behaviour in 2025 shows what a producer does when a government pulls the lever of Section 2. It operates two of the largest copper and cobalt mines in the world, Tenke Fungurume, acquired from an American major in 2016, and Kisanfu, acquired in 2020, both in joint venture with Gécamines. It produced about 117,000 tonnes of cobalt from the two in 2025, having lifted first-half output by 13 percent against 2024 even as the export suspension bit, while its trading arm declared force majeure on cobalt deliveries (CMOC, 2026). A single company thus accounts for close to half of the world’s mined cobalt, a corporate concentration to set beside the geological one. The lesson is about sequencing: the mine kept producing through an export ban because ore does not stop coming out of the ground when the border closes, so the stock built at the mine and the first cost of the policy fell on the state’s own royalty receipts.
Rio Tinto and the Simandou venture, Guinea
Simandou earns a profile because it is the largest test in a generation of whether a mineral megaproject can be made to build something other than a mine. Its infrastructure is shared: the railway and port were built as a joint undertaking of two competing consortia with the Guinean state holding an interest, and they are multi-use by obligation rather than a private haul road. Its ownership is deliberately plural, with Rio Tinto, Chinalco, the Winning consortium’s Singaporean, Chinese and Guinean shareholders, and the state on the same asset. And its timing, first ore in November 2025 after nearly three decades of litigation, expropriation and re-award, is a reminder of what a world-class deposit is worth to a government that can wait (Rio Tinto, 2025). What it demonstrates is the corridor point Chapter 30 makes from the other end: the railway is the part of a mining project that can carry somebody else’s cargo, and whether it does is a contract term rather than an engineering fact.
Sibanye-Stillwater, South Africa
Sibanye shows what a mature African mining economy looks like from the inside, which is not a boom. It is one of the world’s largest platinum-group-metal producers, built by acquiring the deep, old, labour-intensive gold and platinum shafts the previous majors wanted off their books, and it employs tens of thousands of people underground in the most labour-intensive form of large-scale mining that still exists. Its South African platinum-group-metal operations produced 1,797,928 ounces on the four-metal basis in 2025, about 2 percent below 2024, while the group reported adjusted earnings before interest, tax, depreciation and amortisation of R37.8 billion, a rise of 189 percent, the rand being written R (Sibanye-Stillwater, 2026). Output fell and earnings tripled, the price mechanism doing all the work again. And a company of this size employing this many people is the exception rather than the rule: South Africa’s wage-employment share in Table 13.1 is what a century of it produces, and no new mine on the continent will be built that way.
Gold Fields, South Deep and the mines abroad
Gold Fields is here because it is the outward half of the ownership story this chapter otherwise tells from the pit. It is Johannesburg-listed; South Deep, a 93.1 percent economic interest, is its only South African mine; and in 2025 South Africa supplied 12 percent of managed gold-equivalent production, Australia 42, Ghana 23, Chile 16 and Peru 7 (Gold Fields, 2026a). Salares Norte in Chile reached commercial production in August 2025, Windfall in Canada is still a project, and Damang in Ghana transferred to the state after April 2026. The ounces that once sat in South Africa’s third term now sit in other countries’ accounts.
In mid-September 2026 it put a confidential, non-binding, conditional proposal to acquire all of Northern Star Resources by scheme of arrangement: 0.3125 new Gold Fields shares plus A$7.25 cash per share, Australian dollars written A$, implying A$27.00 and A$38.7 billion on 11 September closing prices, about 73 percent of it scrip (Northern Star, 2026; Gold Fields, 2026b). Northern Star’s board unanimously refused further talks around 25 September: undervaluation, opportunistic timing, a scrip that would expose its holders to higher jurisdictional risk than their present portfolio, and completion risk including South African Reserve Bank approval, Gold Fields shareholder approval and a request for hard exclusivity (Northern Star, 2026). Gold Fields called the approach consistent with adding quality long-life assets, presented the Western Australian position as complementary, put synergies at US$4 to 5 billion on its own preliminary post-tax estimate made without due diligence, and said it remained open while remaining disciplined (Gold Fields, 2026b). The proposal was rejected, not completed. The rejected scrip priced a Johannesburg listing and a South African approval path as a discount, even when most of the ounces are already somewhere else.
10. What the evidence says
Mines change the places they are in, and the effects are not the ones the enclave story predicts
Mining cannot be randomised, so this box is quasi-experimental throughout and is labelled accordingly.
Mineral prices cause conflict, and the mechanism is local. Berman, Couttenier, Rohner and Thoenig (2017) matched a global grid of mineral deposits to conflict events across Africa from 1997 to 2010, using world price movements as the source of variation. A rise in the price of a mineral raised the probability of conflict in the cells where it was mined, and the effect spread outward through the fighting groups’ territories, accounting for a substantial share of the rise in African conflict over the period. This is the general version of the mechanism Chapter 31 develops from Sánchez de la Sierra (2020), that the physical characteristics of an ore shape the institutions that form around it.
A conflict-minerals regulation written in Washington raised violence in eastern Congo. Parker and Vadheim (2017) evaluated section 1502 of the Dodd-Frank Act, which required American-listed firms to report on tantalum, tin, tungsten and gold sourced from the region. Using the differential exposure of territories mining the regulated minerals, they found that the rule shifted armed groups towards gold, which is easy to conceal, and raised looting and violence against civilians. Its identification is debated, but no evaluation has found the intended effect, which is the more important fact about it.
A large mine raises local incomes and lowers local welfare at the same time. Aragón and Rud (2013) is the comparison case, from Peru: the expansion of the Yanacocha gold mine raised real incomes in the districts that supplied it, through a demand linkage for local goods and labour rather than through mine employment. Kotsadam and Tolonen (2016) ran the African version on twenty-nine countries, matching household surveys to mine openings and closings, and found that an opening shifted women out of agriculture into services and raised male employment in mining, while a closure reversed the service gains and did not return women to agriculture. Von der Goltz and Barnwal (2019) matched the same kind of data to health outcomes across forty-four developing countries and found households near mines wealthier and, at the same time, carrying higher rates of anaemia among women and stunting among children, consistent with pollution offsetting income.
Put them together and the enclave story is half right. A mine is not a fenced compound with no local effect; it creates a real local demand shock, and that shock is where its employment effect lives. It is also a source of pollution, a magnet for armed actors when the price rises, and an asset whose regulation from outside has at least once made things worse. None of this argues against mining. It argues that the interesting policy variable is what happens in the fifty kilometres around the pit, which is not where mineral policy is usually made.
11. Data sources
- US Geological Survey, Mineral Commodity Summaries 2026: mine production, world totals and country shares for ten of the eleven minerals in the chapter’s own table, on 2025 estimates; the World Nuclear Association’s production release supplies the uranium row, because the USGS publishes no uranium mine-production table.
- International Energy Agency, Global Critical Minerals Outlook for demand and refining shares; Cobalt Institute, Cobalt Market Report for refined production, artisanal estimates and market balances; UN Comtrade for concentrate against refined metal by partner, which is how the processing question is actually measured.
- The Congolese strategic-minerals regulator for the 2025 suspension and quota decisions; company reporting, by name, for CMOC, the Simandou venture, Sibanye-Stillwater, Gold Fields, Northern Star, Glencore, First Quantum, Ivanhoe and Eramet.
- The country cards: the identity terms, overlays and data-quality fields in Table 13.1. The cards carry no sector fields, so no production and no mining employment.
balance_sheet.exports_top3andbalance_sheet.commodity_dependenceare filled on all 54, and they show the Copperbelt’s exposure: copper is 69.7 percent of Zambia’s merchandise exports and 67.3 percent of the DRC’s. Every production number here comes from a named source outside the cards, and says so.
A word on what these numbers will bear. Four of the thirteen cards in Table 13.1 carry a low confidence flag, among them the country the chapter’s opening fact belongs to and the country with the fastest third term. The Congolese card rests on a census taken in 1984 and a labour-force survey run in 2012; Madagascar’s last labour observation is also from 2012, Namibia’s from 2018 and Guinea’s from 2019. Guinea’s card carries no informal-employment share, which is why the country with the most dramatic third term is missing from Figure 13.2. The table will bear the shape of the sector across thirteen economies and differences too large for measurement error to close. It will not bear a precise Congolese or Guinean level of anything, a claim about mining employment in any of them, or a comparison of informal shares between a country surveyed in 2012 and one surveyed in 2024.
12. Exercises
Connections to other chapters
- Chapter 1 (Africa in Numbers) poses this chapter’s question: why holding the chokepoint on a battery metal has not made the country holding it rich. Chapter 5 (States, Political Settlements and Development Bargains) supplies the vocabulary for why a mining code is renegotiated once in one country and rewritten every four years in another.
- Chapter 12 (Oil and Gas) is the sector’s twin: the same enclave arithmetic, a longer history, a fiscal regime built on production sharing. Chapter 14 (Energy and the Solar Transition) carries the constraint that decides the beneficiation argument, since a smelter is a load and the grid is why the refining step is somewhere else. Chapter 19 (Trade, Logistics and Ports) carries the corridors and the freight arithmetic of Section 2. Field notes from a September 2026 New York roundtable record beneficiation being raised again as a political wish; they do not add a finding this chapter does not already carry.
- Chapter 21 (Capital and Sovereign Debt) and Chapter 32 (China in Africa) carry the balance-sheet half: who financed the mines, what a resource-backed loan does, and how the official statistics and the loan-level databases disagree. Chapter 34 (Climate Finance and the Carbon Market) and Chapter 35 (Scenarios to 2050 and 2100) carry the demand side.
- Chapter 25 (Gauteng) owns the Witwatersrand pole that South Deep still sits on; the Gold Fields profile is the sector’s account of the capital that left it. Chapters 30 and 31 (the Copperbelt; Where the State Is Thin) own the other places: the corridor, Kamoa, Sicomines, the Zambian tax cycle, the Kariba drought and the Chambishi tailings failure in the first; the eastern Congolese coltan economy in the second.
Discussion questions
An export ban raises the domestic price of an ore and lowers the world price. Set out the conditions under which the exporting country captures the difference, then apply them to the Zimbabwean lithium sequence of 2022, 2025 and 2026 and to the Congolese cobalt sequence of 2025. Say which is more likely to have raised national income, and what evidence available before 2030 would settle it.
A free-carried twenty percent state share is routinely described as ownership. Say what it is worth while a mine is being built and financed, what it is worth once the debt is serviced, and what a government gives up by taking it instead of a higher royalty. Then argue for one of the two on behalf of a finance ministry whose horizon is one electoral cycle.
Section 10 finds that a mine raises local incomes through a demand linkage rather than through mine employment, and raises anaemia and stunting nearby. Chapter 30 finds that mining raises the national average of the third term and leaves the second alone. Reconcile the two, and say what that implies about where mineral revenue should be spent if the objective is term two.
Try it
Open the three cards side by side: the Democratic Republic of the Congo, Guinea and South Africa, the same sector at three stages, an ore chokepoint with almost no formal labour market, a bauxite and iron boom in its first decade, and a mining economy a century old. Read down the identity block, then the wage-employment overlay, then the data-quality block, and write one paragraph on why the third term tells you almost nothing about the second in the first two columns and rather a lot in the third. Then open the Growth Pole Map, switch on the critical-minerals layer, and turn on the confidence toggle, which hatches every country flagged low or with no computable flag. The layer plots the mines and smelters this chapter names, each with its operator and status. Say which of this chapter’s four chokepoint minerals you would still write a paragraph about once the low-confidence countries are hatched out.
Data exercise
Two files, and the point is the join between them. Take the chapter’s data file on the book site, which lists Africa’s share of world mine production for eleven minerals with the leading African producer of each, its source and its vintage, and take cards.csv or cards.json from the country cards page. Build a table of the eleven leading producers with identity.output_per_worker_growth, identity.employment_to_wa_growth, overlays.wage_employment_share, scale.informal_employment_share, scale.gdp_per_capita and data_quality.confidence_flag. Then do three things. First, rank the eleven by Africa’s share of world production and by GDP per head, report the rank correlation, and say what you expected and whether you got it. Second, note that no card carries a production figure, a mineral export or a mining-employment count, and that balance_sheet.exports_top3 and balance_sheet.commodity_dependence are empty on all 54; write two sentences on what a mineral-dependence field would have to contain to be worth adding, and where its numbers would come from. Third, drop every country whose confidence flag is low or null and say how much of Africa’s cobalt, tantalum and bauxite position you have just made unquotable. Treat nulls as nulls: a country with no informal-employment share is not a country with no informal employment.
Data sources and further reading
- The series behind Section 11, plus the OECD’s Due Diligence Guidance for Responsible Supply Chains of Minerals from Conflict-Affected and High-Risk Areas, third edition, which is the standard downstream buyers point at.
- Amir Lebdioui, Survival of the Greenest (2024), for the strongest statement of the beneficiation case and its conditions, with Lebdioui and Riofrancos (2025) on transition-mineral supply chains; Karkare and Medinilla (2023) and Medinilla, Dekeyser and Karkare (2025) on the continental battery strategy.
- Berman, Couttenier, Rohner and Thoenig (2017) and Parker and Vadheim (2017) on minerals and conflict; Kotsadam and Tolonen (2016) and von der Goltz and Barnwal (2019) on what a mine does to the households around it.
- The New Regional Economics, chapter 14 (Wilse-Samson, 2026), for the battery value chain, the Zambian cobalt-import tariff episode and the Kasumbalesa border research.