24. Lagos–Abidjan and the West African Coast
Pole type: demographic engine.
Along the thousand kilometres of coast that run from Abidjan through Accra, Lomé and Cotonou to Lagos lie five countries holding 323 million people, one African in five, and by 2050 they will hold 506 million. There is no other stretch of coastline on earth on which that many people will be added this quarter-century. The road between the two end points is a single mostly two-lane highway, crossing four national borders, and a truck on it spends more of its journey stationary than moving.
Learning Objectives
After reading this chapter, you should be able to:
- Read the identity for the six countries of the West African coastal pole, say which of the three terms is carrying growth in each, and explain why the pole’s term one is the strongest on the continent while its term two is nearly flat.
- Set the pole’s balance sheet out in the book’s terms: what it owes, to whom, how much of that is bonded debt sold to private investors, and what Ghana’s default and restructuring did and did not settle.
- Apply a growth-diagnostics reading to a cross-border pole rather than to a country, and defend the claim that the binding constraint here is the cost of being a city that the grid and the port cannot serve.
- Describe the political settlement in each of the four largest economies of the pole in the vocabulary of Chapter 5, and say what evidence would show that an elite has bet on growth rather than on distribution.
- State what the numbers in this chapter can and cannot bear, given a Nigerian census taken in 2006, a Nigerian rebasing in 2025, and labour-force surveys of very different vintages across the six countries.
Prior work: the corridor-time table for the Abidjan to Lagos road, the contrast with the reformed Northern Corridor, and the consumption-city argument this chapter takes up are developed at length in the companion volume, The New Regional Economics, chapters 13 and 14 (Wilse-Samson, 2026). This chapter cites them rather than repeating them.
This is the first of the eight pole chapters, and it is first because it is the case the book’s title is really about. If the African century happens anywhere it happens here: on a coastal strip with the largest concentration of young people in the world, four deep-water ports, a regional market on paper, and a hegemon at the eastern end whose domestic market is larger than the rest of West Africa combined. Every ingredient the case in Chapter 4 asked for is present in some quantity.
What is also present, in larger quantity, is the counter-case. The pole’s largest economy has been losing output per worker for a decade, its employment ratio has not moved, the corridor meant to knit five markets into one is the least reformed of the four the companion volume compares, and the grid that would power the factories does not reliably power the houses. The pole is a test rather than an illustration: the endowment is unarguable and the machinery for converting it into income is visibly missing, which makes it possible to say what the missing machinery is.
The pole as this book draws it is the coastal urban corridor of Côte d’Ivoire, Ghana, Togo, Benin and Nigeria. Dakar is named alongside it and treated as an outlier rather than a member: it faces the Atlantic and the Sahel rather than the corridor, with no continuous coastal road between it and Abidjan, and its recent history is a different story about the same currency and the same creditors. Senegal appears in every table here, and the text says each time whether a statement is about the five or about the six.
1. The pole in the identity
Chapter 1 set out the identity the book runs on: output equals output per worker, times the employment-to-working-age ratio, times the working-age population, so that in growth rates GDP growth is approximately the sum of the three. Table 24.1 reports all three terms for the six countries over 2014 to 2024.
| Country | Term one: working-age population | Term two: employment ratio | Term three: output per worker | Implied growth | Observed growth | Gap | Wage employment (percent of employment) | Non-agricultural employment (percent) | Confidence |
|---|---|---|---|---|---|---|---|---|---|
| Côte d’Ivoire | 2.9 | 0.1 | 2.9 | 5.9 | 6.2 | +0.3 | 28.7 | 53.7 | medium |
| Ghana | 2.5 | -1.6 | 3.5 | 4.4 | 4.4 | +0.0 | 32.2 | 64.8 | medium |
| Togo | 2.7 | 0.0 | 2.0 | 4.7 | 5.1 | +0.3 | 23.0 | 61.7 | medium |
| Benin | 3.1 | 0.5 | 1.9 | 5.4 | 5.5 | +0.1 | 19.8 | 59.0 | high |
| Nigeria | 2.9 | 0.3 | -1.9 | 1.2 | 1.2 | -0.1 | 13.6 | 65.9 | low |
| Senegal | 3.5 | 1.5 | 0.3 | 5.3 | 5.3 | +0.0 | 35.3 | 69.4 | high |
All figures are annual growth rates in percentage points except the last three columns, which are shares and a flag. Term one is the working-age population aged 15 to 64; term two is modelled employment aged 15 and over divided by that population; term three is the residual output-per-worker series. Sources: UN World Population Prospects 2024, ILOSTAT modelled estimates (November 2025), and the IMF World Economic Outlook (April 2026), via the country cards.
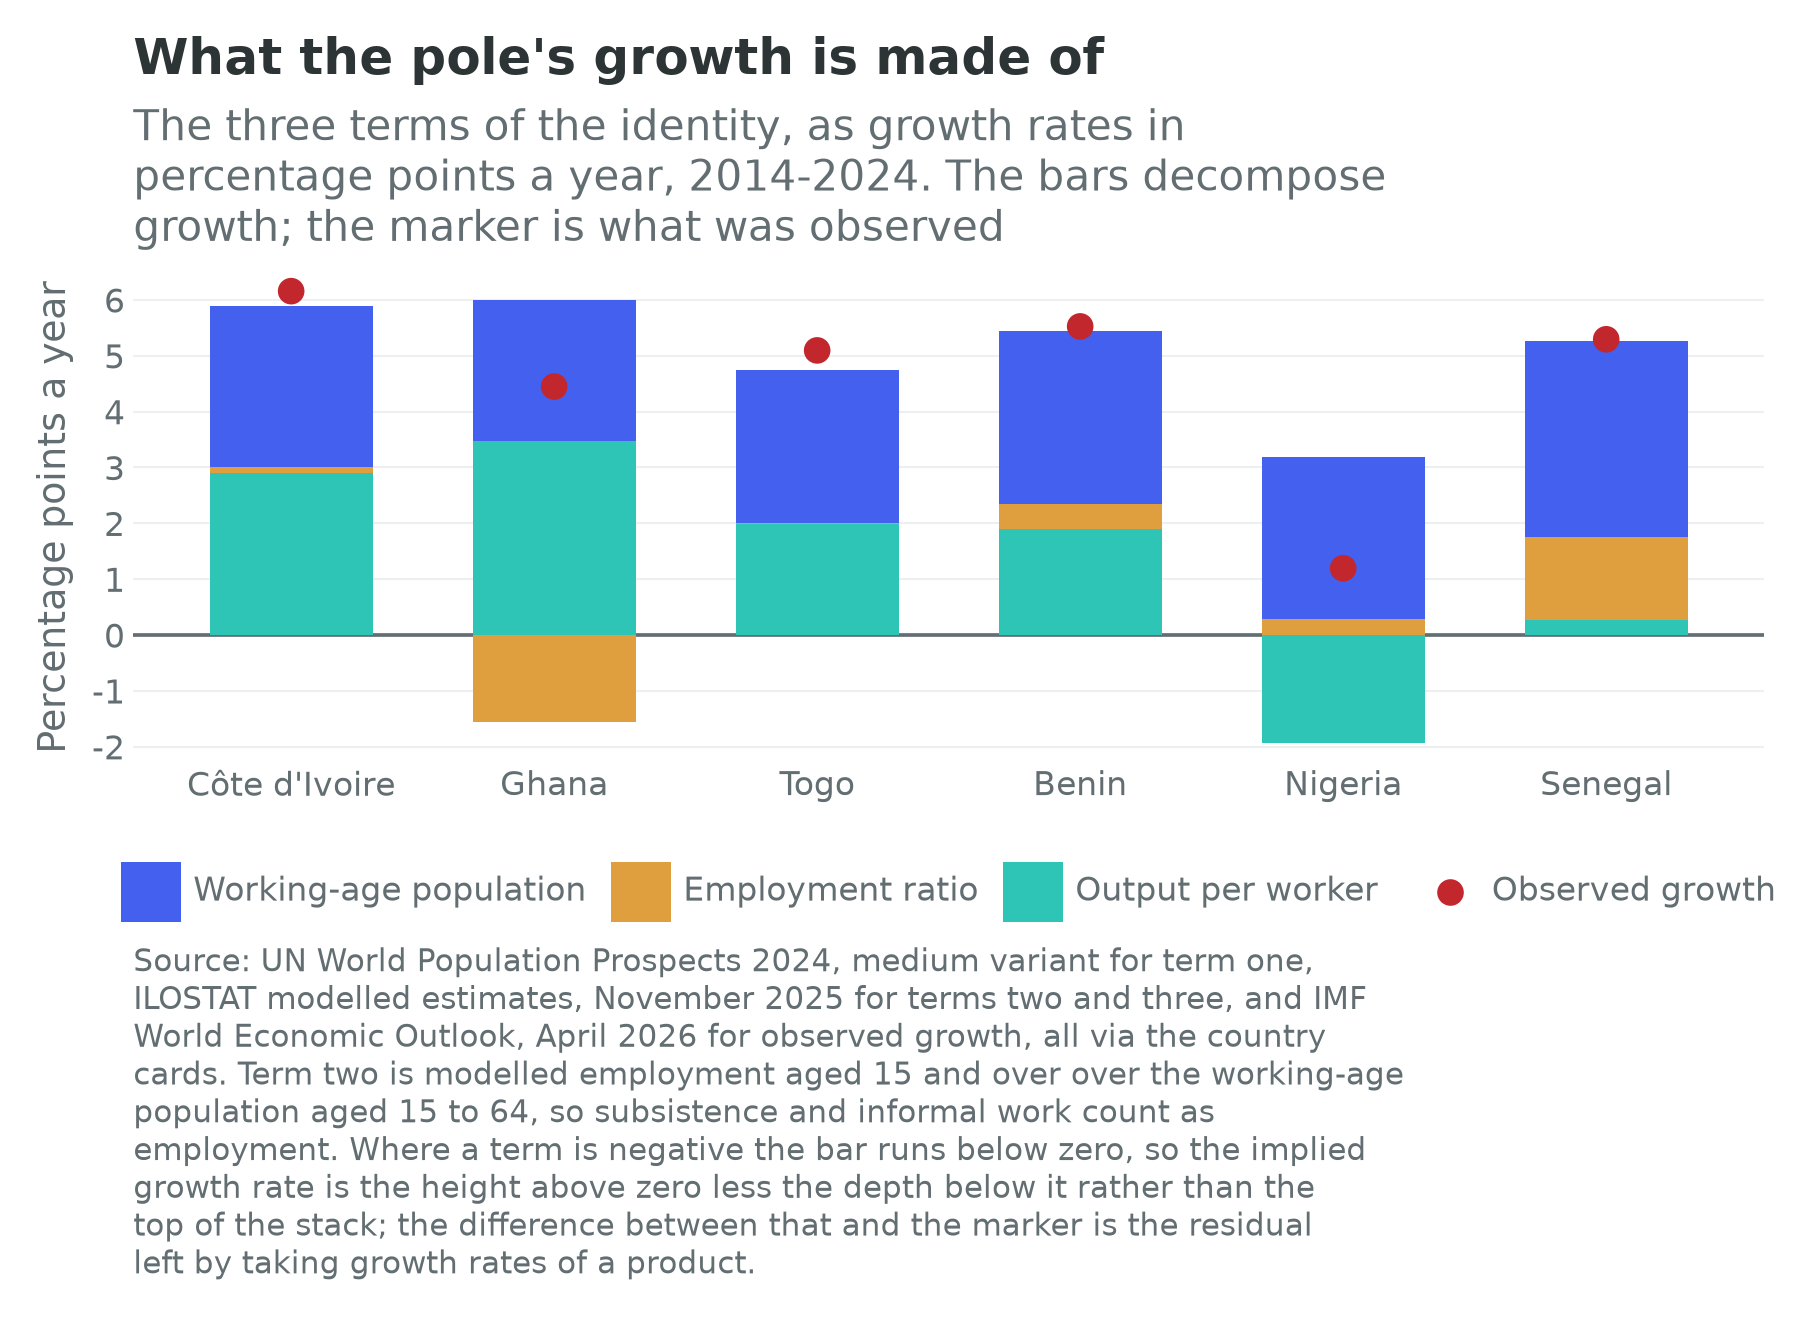
Read the columns in order and the pole’s problem states itself. Term one is running fast and evenly. All six sit between 2.5 and 3.5 percent a year, at or above the continental middle, with Benin and Senegal near the top of the whole distribution of 54. This is the endowment, the only column nobody has to earn, and, as Chapter 2 argued, the one that will keep delivering for another thirty years whatever anyone does, because the workers of 2050 are already born.
Term two is doing almost nothing. Four of the six sit within half a point of zero and Ghana’s is negative at minus 1.6 percent a year. This is the term that has to move if a growing cohort is to become a growing labour force rather than a growing dependency, and across the pole it has not moved in a decade. Senegal is the exception at 1.5 percent a year, and it is instructive rather than encouraging: its output per worker grew at 0.3 percent over the same period, which is what happens when a labour force expands into activities no more productive than the ones it left.
The overlays are the reason to distrust the middle column in both directions. The modelled series counts anyone at work, so a woman selling sachet water in traffic on the Third Mainland Bridge is employed. What separates that from a job is the wage-employment share, and the range is wide: 35.3 percent of Senegalese employment is waged against 13.6 percent of Nigerian, and informal employment runs from 78.1 percent in Ghana to 96.4 percent in Benin. The non-agricultural share, the one number in the table that looks like structural transformation, is high everywhere and highest in Senegal at 69.4 percent. It tells you that people have left the farm; it does not tell you what they left it for.
Term three splits the pole in two. Côte d’Ivoire and Ghana post output-per-worker growth of 2.9 and 3.5 percent a year, respectable by any standard and something that would be called an industrialization in Asia. Nigeria posts minus 1.9 percent. That is not a bad year; it is a decade in which the average Nigerian worker produced less each year than the year before, and it is the most consequential number in this chapter, because Nigeria is 72 percent of the pole’s people and 54 percent of its output. With observed GDP growth of 1.2 percent a year against a working-age population growing at 2.9 percent, Nigeria spent the decade getting poorer per head while getting larger in aggregate.
Where the transformation database reaches, over the window it covers, 2008 to 2018, term three splits into the part from firms getting better within a sector and the part from workers moving between sectors. The three splits available here are a compact statement of the African puzzle. Ghana’s within-sector component is a strong 3.7 percent a year and its between-sector component is minus 0.7: firms improved, and the movement of workers between sectors subtracted from productivity. Nigeria and Senegal are the mirror image, with within-sector components of minus 1.2 and minus 1.1 against between-sector components of plus 1.5 and plus 1.4. Workers moved to nominally better sectors and the sectors themselves got worse. This is the dual-firm economy of Diao, Ellis, McMillan and Rodrik (2021): large firms raising productivity without adding employment, small firms adding employment without raising productivity, the two halves never meeting. For Côte d’Ivoire, Togo and Benin the split is not on the cards, because the database does not cover them, and this chapter will not guess at it.
The gap column is the honesty check on everything above. The identity is exact in levels and approximate in growth rates, so implied and observed growth should be close but not identical; across the six they differ by at most 0.3 points, and in Ghana, Senegal and Nigeria by less than a tenth. The decomposition holds as arithmetic, and Chapter 1 says what that does not prove: an error in the modelled employment count would move terms two and three by equal and opposite amounts and leave this column untouched. What it is decomposing is a set of modelled series, which is the subject of section 10.
So which term is the pole betting on? In the labour-abundant world that Chapter 1 sets out as the book’s first case, the answer is term two, and the bet is a good one: a coastal strip with 506 million people by 2050, four deep-water ports and a wage-employment share in the teens is exactly the configuration in which moving a tenth of the labour force from street trading into wage work would transform the aggregate. Term one supplies the workers, term three is already positive in half the pole, and the missing element is jobs at scale, which governments and firms know how to make. In the labour-redundant world of the second case, the same configuration is a liability rather than an endowment: the same 506 million, most of them in coastal cities, in a world where the frontier of production does not need them, and where the assets that would be worth something, sun and land and ore, sit mostly in other parts of the continent. The pole holds the asset whose price the century has not yet set. That is what it means to call the bet conditional, and this chapter proceeds, as the book does, on the first case, while noting that these are the cities where the second case would bite hardest and first.
2. The pole on the balance sheet
The second lens is the balance sheet: what comes in, what goes out, and who ends up owning the assets. Table 24.2 gives the stock side from the cards.
| Country | External debt stock (\(bn) | Multilateral (\)bn) | Official bilateral (\(bn) | Private creditors (\)bn) | of which bonds (\(bn) | Chinese loan commitments, 2000 to 2024 (\)bn) | |||
|---|---|---|---|---|---|---|
| Côte d’Ivoire | 40.6 | 8.2 | 5.8 | 17.2 | 10.6 | 5.7 |
| Ghana | 37.4 | 8.8 | 3.4 | 13.4 | 9.2 | 5.8 |
| Togo | 4.3 | 1.4 | 0.6 | 0.5 | none recorded | 0.9 |
| Benin | 14.2 | 4.1 | 1.0 | 3.9 | 2.2 | 0.7 |
| Nigeria | 108.8 | 23.8 | 6.1 | 20.3 | 18.0 | 8.9 |
| Senegal | 47.1 | 9.5 | 5.0 | 10.6 | 5.0 | 3.3 |
Sources: World Bank International Debt Statistics (2025 release) for the stock and the creditor lines; the Boston University Chinese Loans to Africa database (2000 to 2024 release) for the commitment column, which is a cumulative flow and not a stock. The four creditor columns are publicly guaranteed long-term debt, the bond column sits inside the private-creditor column, and the columns do not add to the stock, which also carries short-term debt, IMF credit and private non-guaranteed borrowing.
Three things stand out. The first is that this is a bonded pole rather than an aid-financed one: the six owe $45.1 billion on bonds, and every one except Togo has sold debt to private investors abroad. That is a genuine achievement of the last fifteen years and it is also the mechanism by which a bad year becomes a crisis, because bondholders do not reschedule quietly the way a bilateral creditor does. Chapter 21 works the mechanics; the pole chose market access and got the market’s discipline with it.
The second is the Chinese line. The loan database records $25.4 billion of commitments to the six governments between 2000 and 2024, of which $8.9 billion to Nigeria alone. Set the commitment record beside the balance still outstanding and the pole reads differently. Nigeria owes $5.3 billion to creditors in China against $8.9 billion of commitments signed, Côte d’Ivoire $4.1 billion against $5.7 billion, Senegal $2.2 billion against $3.3 billion, Ghana $1.9 billion against $5.8 billion, and Togo and Benin a few hundred million each. A commitment is not a disbursement and a disbursement is not an outstanding stock, and on this coast the ratio between them is close to two to one, which is what a lending relationship that peaked a decade ago looks like once it has been partly repaid.
The comparison that matters more here is with the Paris Club, because on this coast the old creditors are still the larger ones. Côte d’Ivoire owes the Club’s twenty-two members $7.6 billion against China’s $4.1 billion, Senegal $6.7 billion against $2.2 billion, Ghana $4.5 billion against $1.9 billion and Benin $2.2 billion against $0.4 billion. Nigeria is the exception and the reversal is emphatic: $0.8 billion to the whole Club against $5.3 billion to China. Franc-zone West Africa borrowed from Europe and still owes Europe; the anglophone giant beside it did not. One caution before either number is used: the China and Paris Club lines classify by the creditor’s country and the bilateral column by the kind of institution, so the three are not additive, and Chapter 21 sets out why.
The third is Senegal, and it is why Dakar is here as a warning rather than as a member. Its recorded external debt stock is $47.1 billion against an economy of $37.1 billion, so external liabilities to all creditors exceed a year of output. The card’s note about the 2024 and 2025 restatement of the country’s debt data is the story: an audit after the 2024 change of government found years of borrowing the previous administration had not reported, and the figures here are the post-restatement ones. Senegal’s five-year growth forecast, 2.9 percent a year, is the lowest in the pole and roughly half of Côte d’Ivoire’s, in a country whose identity terms over the past decade were among the strongest. A balance sheet can undo a decade of the real economy in eighteen months.
Ghana is the case where that has already happened and then partly unwound, which makes it the most useful passage of recent economic history in the pole. Ghana defaulted in December 2022, restructured its domestic debt through an exchange completed in 2023, and closed a Eurobond exchange on 9 October 2024 that retired $13.1 billion of old bonds, with most holders taking a nominal haircut of 37 percent on principal (Ghana, Ministry of Finance, 2024). The frame was an International Monetary Fund Extended Credit Facility of $3 billion approved in 2023; its final review was completed in July 2026 alongside the annual consultation, with public debt down to about 45 percent of GDP at the end of 2025, headline inflation at 5.4 percent and gross reserves at $11.9 billion (International Monetary Fund, 2026d). That is a fast recovery by the standards of the modern restructuring machinery. Ghana’s identity terms in Table 24.1 were posted through the middle of it, which is why its employment ratio fell by more than a point and a half a year while its output per worker rose. Adjustment at that speed is paid for in jobs.
What the pole owns is the sector chapters’ question: the cocoa of Côte d’Ivoire and Ghana, the crude of the Niger Delta, the transshipment franchise at Lomé, the cotton of Benin and, increasingly, refining capacity that used to sit in Rotterdam.
3. The binding constraint
The growth-diagnostics method of Hausmann, Rodrik and Velasco (2005) asks one disciplined question: of all the things wrong with an economy, which one, if fixed, would raise private investment most right now? It proceeds by elimination down a tree, and its virtue is that it forbids the list-of-everything that development strategies usually become. Figure 24.2 draws the tree for this pole.
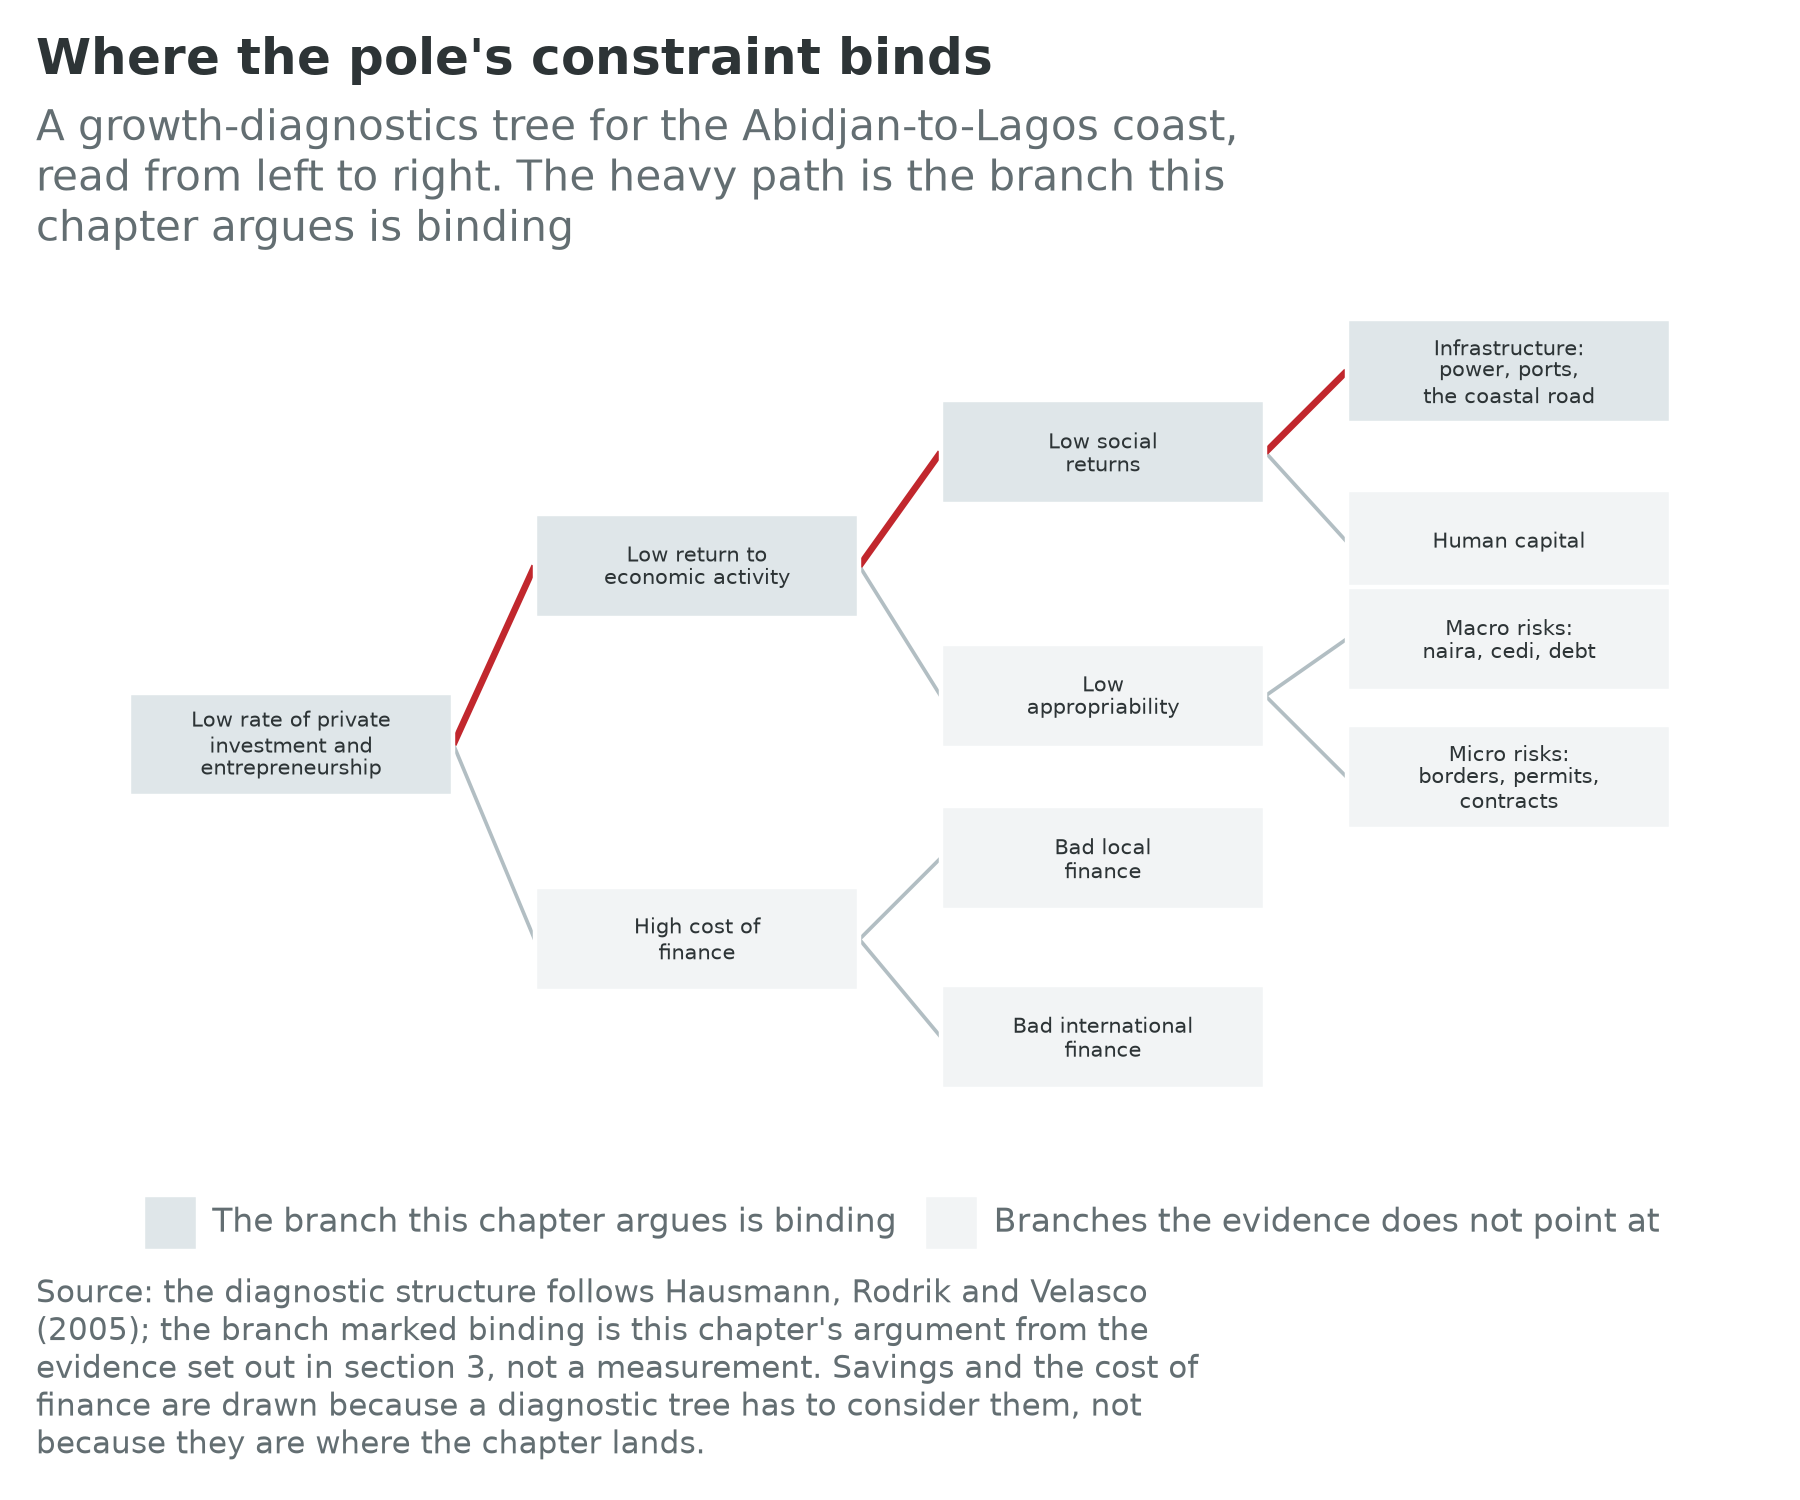
Start by eliminating the cost of finance, the branch most often assumed to be the answer in a low-income region. Five of the six governments have sold bonds to international investors, so the sovereigns can borrow, expensively but at will, and the largest industrial investment made anywhere on the continent this century, the refinery at Lekki, was assembled by a private group with bank syndicates and retained earnings rather than by a state or a donor. Domestic credit is thin and dear, and Chapter 16 is unsparing about it, but an economy whose binding constraint is the price of capital is full of high-return projects that cannot raise money, and the pole’s characteristic complaint from firms is not that money is unavailable but that the project does not work once the money arrives.
Eliminate human capital next, with more hesitation. The pole’s schooling indicators are poor and Chapter 20 takes them seriously. But the diagnostic test is whether the returns to skill are being bid up, and the observable pattern runs the other way: youth not in employment, education or training runs from 11.9 percent in Nigeria to 35.2 percent in Senegal, and the Senegalese figure sits alongside the highest wage-employment share in the pole. Graduates in Lagos, Accra and Dakar are not scarce; positions for them are. Human capital constrains what the pole can become in twenty years. It is not what stops a factory opening next year.
What stops the factory is the cost of being a city that the grid and the port cannot serve, and the evidence is direct. Take power first. About 61 percent of Nigerians had access to electricity in 2023 and 86.8 million had none, the largest unserved population of any country in the world (World Bank, IEA, IRENA, UNSD and WHO, 2025). Installed generation capacity is above 13,000 MW and average delivered output under 5,000 MW, so the gap between what the country owns and what it uses is roughly the capacity of a mid-sized European country, idle behind a transmission network that cannot carry it. Firms respond in the only way available: Nigerian manufacturers spent 1.35 trillion naira, ₦, on alternative power in 2025, up from ₦1.11 trillion in 2024, and energy is about 40 percent of factories’ operating costs by the manufacturers’ association’s account (Okojie-Okeiyi, 2026). A manufacturer paying that premium on every unit of output is not competing with a Vietnamese plant on labour costs; it is losing to it on electricity before the first worker is hired.
Take logistics second. The Abidjan to Lagos corridor crosses four national borders and, in the field surveys the companion volume assembles, more than thirty roadblocks, with incompatible axle-load rules on either side of most of them. The comparison that makes this a diagnosis rather than a complaint is the Northern Corridor from Mombasa, where one-stop border posts, electronic cargo tracking and a single customs territory cut transit times by roughly two thirds while volumes rose (Wilse-Samson, 2026). The two corridors face similar geography and similar traffic; one was reformed and one was not, which is as close to a natural experiment as regional policy offers.
The third item is the first two combined: the pole’s cities have grown faster than the systems that make cities productive. This is the consumption-city argument of Gollin, Jedwab and Vollrath (2016), worked through for Lagos in the companion volume (Wilse-Samson, 2026). Density without a working grid, a port that clears containers and a road that reaches the hinterland does not deliver the agglomeration effects that make urbanization the engine of structural change. It delivers rent extraction, congestion and an informal service economy, which is a fair description of the pole’s term-two record.
The diagnosis has a testable implication, and a diagnosis that cannot be wrong is not worth making. If the constraint is infrastructure rather than finance or skills, a large infrastructure improvement should be followed by a jump in private investment in tradable production, not merely in construction and property. The refinery, the deep-water port at Lekki, the transshipment terminal at Lomé and the corridor highway are experiments the next decade will report on.
4. The political settlement
Chapter 5 sets out the vocabulary this section uses. Khan (2010) argues that institutions work only when they fit the underlying distribution of organizational power, so that the same written rule is enforced in one capital and ignored in the next. Pritchett, Sen and Werker (2018) sort economies by whether deals are open or closed to newcomers and ordered or disordered in their enforcement. Dercon (2022) asks the blunt question that the pole chapters put to every settlement: has the elite bet on growth, or on dividing what exists?
Nigeria ran the clearest test in the pole in 2023. The fuel subsidy, removed on 29 May 2023, was not primarily an energy policy; it was the mechanism by which the federal government purchased urban acquiescence, and it was the largest single deal in the Nigerian settlement. Its removal, followed by the floating of the naira in June 2023, which took the currency from about 461 to about 900 to the dollar by the end of that year, is exactly the kind of costly, constituency-losing act Dercon’s test looks for. The government reports savings of ₦15.8 trillion to the federation between June 2023 and December 2025, the larger share of it going to states and local governments rather than to the centre. Two years on the evidence is mixed: the macroeconomics improved and output per worker did not, and interest payments still absorb roughly half of federal revenue, which is the position of a government that cannot fund the grid whatever it decides. The reform was real. Whether it was the first move of a growth bargain or a one-off fiscal necessity is the most consequential political question in the pole. The same relative-price shock is what moved households and firms from generators toward solar panels and batteries, a response Chapter 14 records in the import data.
Ghana is the clearest case of Khan’s competitive clientelism. Two well-organized parties alternate in power, each with a patronage network that has to be paid, and the fiscal cycle follows the electoral one with a regularity no technical reform has broken: spending accelerates into an election, the deficit widens, an adjustment follows. The 2022 default, the domestic exchange of 2023, the Eurobond exchange of 2024 and the change of government at the end of 2024 are one sequence, not four events. The programme with the Fund functioned as an external anchor for a settlement that could not anchor itself, and the strongest evidence for the bargain hypothesis here is that the adjustment was carried through a change of government rather than abandoned at it.
Côte d’Ivoire has the pole’s most impressive growth record and its most closed politics. The settlement after the 2011 crisis was, in Pritchett, Sen and Werker’s terms, ordered and closed: a technocratic administration, a stable set of deals with foreign investors and the cocoa trade, heavy public investment, and real GDP growth averaging 8.2 percent a year from 2012 to 2019, with cocoa output rising from 1.4 million tonnes in 2012 to 2.2 million in 2020. It is the recipe’s early years as Chapter 9 describes them, run by a government that decided what the economy was for. It is also a settlement never tested by a transfer of power: the incumbent won a fourth term in October 2025 with 89.8 percent of the vote on a turnout below 50 percent, with the principal challengers excluded. Growth bargains struck by governments that cannot lose an election are common in the historical record, and so are their failures at the succession.
Benin is the smallest of the four and the most deliberate. The settlement built after 2016 by a president who had made his fortune in cotton took a specific bet: that Benin should process what it grows rather than ship it raw. The industrial zone at Glo-Djigbé is that bet in physical form. The card shows what it has bought so far, a working-age population growing at 3.1 percent a year, output per worker at 1.9 percent and the pole’s only clearly positive employment ratio outside Senegal. The politics narrowed as the economics improved: the governing coalition holds all 109 seats in the National Assembly, and the president’s finance minister won the April 2026 election with more than 94 percent of the vote against a single opposition candidate. Benin is the tidiest illustration of Dercon’s uncomfortable finding, that a bargain to bet on growth is not a bargain to share power, and that the two are separable in both directions.
Togo completes the corridor. A single family has held the presidency in Lomé since the 1960s, and the strategy has been narrower than Benin’s and more successful than the country’s size implies, built almost entirely on the transshipment franchise of section 5. A very small state can capture a regional rent with one asset and one competent institution, and doing so does not by itself move the employment ratio: Togo’s is 0.0 percent a year over the decade.
5. Geography and infrastructure
The pole is a line, not a circle, and its economics follows from that. Abidjan, Accra, Lomé, Cotonou and Lagos sit within a few kilometres of the Atlantic, each with a port, each the political and commercial centre of its country, each connected to the next by one road. There is no ring, no alternative route inland, and no rail line running the length of the corridor. A closed border or a flooded section does not reroute traffic; it stops it.
The road is the Abidjan–Lagos Corridor Highway, 1,028 kilometres through five countries, and the most-discussed infrastructure project in West Africa. The five countries it connects account for more than 75 percent of the regional community’s output and carry more than 75 percent of its trade, which is why the project has survived two decades of preparation. It now has a corridor management authority and the regional development bank as lead arranger; the 2022 investment forum recorded $15.6 billion of investment interest, and the published phasing runs construction from 2027 through 2033. Treat that as the schedule, not the outcome. The companion volume’s corridor table sets out what the road costs today in border crossings, roadblocks and hours (Wilse-Samson, 2026).
The ports are the part of the corridor that has already been reformed, and they compete rather than complement. Lomé is the surprise: a country of 9.5 million people running the region’s transshipment hub, handling 2.06 million twenty-foot equivalent units in 2024 and standing as the only Sub-Saharan African port in the global top hundred. Tema, expanded under a concession with a global terminal operator, closed 2025 at roughly 2.2 million containers, ahead of Abidjan’s 1.7 million, and Ghana is spending to make it the Sahel’s outlet. Abidjan handled 1.6 million in 2024, roughly double its 2022 volume, after its second container terminal opened. Lekki, the newest and deepest, with a 16.5-metre draft that takes vessels none of the others can, handled 287,000 containers in 2024 and targeted 500,000 in 2025. Four ports within 1,000 kilometres, three recently expanded, all chasing the same hinterland traffic: this is what five sovereigns do when the corridor between them does not work.
The power system is the piece that would have to be regional and is not. The West African Power Pool has existed since 1999, and its flagship interconnection, the North Core line, was 56 percent complete at the end of 2025 (West African Power Pool, 2026). Interconnection matters here more than in most regions because the endowments are complementary: Nigerian gas, Ivorian and Ghanaian hydro and thermal capacity, Sahelian solar, on a coast where demand peaks at different hours. A working pool would let Lagos buy from Abidjan on a bad night. It is not yet that; it is a set of bilateral lines with a secretariat, and the section 3 diagnosis stands until it is more.
Cables are the one network on this coast that works as a network. Every capital on the corridor is landed by several submarine cables, and Chapter 17 takes up what has been built on them. The pole’s best infrastructure is the one built by private consortia with no border formalities; its worst is the one that requires five customs services to agree.
6. Megaprojects and cities
A note on the city figures before the numbers. All three cards carry an agglomeration population: Lagos at 16.1 million, Abidjan at 6.7 and Accra at 5.4, against 36.9, 12.2 and 9.8 million in 2050. Africapolis counts built-up continuity rather than administrative boundaries, so these are smaller than the metropolitan figures usually quoted and the rule is named wherever the number is used: quoted figures for Lagos vary by several million depending on which rule is used, and the card’s is the built-up one. The national figures underneath remain the UN’s: Nigeria’s 232.7 million today and 359.2 million in 2050, Côte d’Ivoire’s 31.9 million and 55.7 million, Ghana’s 34.4 million and 50.6 million. Read this section for what is being built rather than for how many people it houses.
Lekki is the largest thing being built. The free zone at the eastern end of Lagos now holds a deep-water port and the Dangote refinery, which reached its full design capacity of 650,000 barrels a day in February 2026 on a 2,635-hectare site, a first for a single-train refinery of that size on the company’s account; in October 2025 the group announced a plan to expand it to 1.4 million barrels a day (Agence France-Presse, 2023; Vanguard, 2025; Vanguard, 2026). The macroeconomic significance is large: Nigeria has spent five decades exporting crude and importing refined product, paying the margin to refiners abroad and subsidising the result at home, and a plant of this size inverts that trade at a stroke. The developmental significance is more ambiguous and belongs in Chapter 12. A refinery is capital-intensive, employs few people relative to its cost, and sits inside a free zone with its own customs and power. It solves a balance-of-payments problem. It is not an answer to the pole’s term-two problem.
Eko Atlantic is the most legible statement about what these cities are for. On roughly 10 square kilometres of land reclaimed from the Atlantic beside Victoria Island, behind a sea wall planned at 8.4 kilometres, it is designed for about 250,000 residents at the top of the Lagos income distribution (Haskoning, 2023). It exists because the sea had been taking the Victoria Island shoreline for a century, since the Lagos harbour moles cut off the sand supply, and the wall is a genuine piece of coastal engineering (South Energyx Nigeria, 2012). It is also a private city built to a standard the public city cannot reach, with its own power and drainage, and the criticism that it protects one shoreline while accelerating erosion along the adjacent ones is a live technical dispute rather than merely a political complaint. Section 9 takes that up.
Accra and Abidjan expand in a quieter and, on the evidence of Table 24.1, more productive register. Ghana’s build-out is concentrated on Tema, where a terminal concession and roughly a billion dollars of investment aim at Sahelian transit traffic now moving through Abidjan and Lomé. Abidjan added a second container terminal in 2022, roughly doubling throughput in two years, and is building an urban rail line to move workers rather than containers. Neither is a megaproject in the Lekki sense; both are the unglamorous capacity the section 3 diagnosis says the pole is short of.
Glo-Djigbé, in Benin, is the clearest industrial-policy bet in the pole. The zone is planned across 1,640 hectares, and its developers project $1.4 billion of first-phase investment and about 300,000 jobs by 2030 in cotton ginning, spinning, garments and cashew processing. Those are promoter figures for a project still building, and this book marks them as such (ARISE Integrated Industrial Platforms, 2026). What makes the zone interesting is the counterfactual rather than the projection: Benin is Africa’s largest cotton producer and has historically shipped nearly all of it raw, so a policy that keeps even a modest share of the fibre at home is a measurable test of the value-addition argument Chapters 11 and 15 both make.
Underneath all four is the housing deficit, the part of the urban story that never gets a ribbon cut. Chapter 22 carries the land and tenure argument; the connection here is direct, since a labour market cannot allocate workers to firms if the workers cannot afford to live within three hours of them, and in Lagos and Abidjan that is now the binding commute.
7. Firm profiles
Dangote Group (Nigeria)
Dangote Group is the pole’s demonstration of what an African industrial conglomerate can do when it has patient capital, political access and a protected domestic market, and of the limits of all three. Its cement arm, Dangote Cement, is the largest cement producer in Sub-Saharan Africa, with capacity of up to 55 million tonnes a year across the continent, of which 35.25 million tonnes sits in Nigeria, and operations in Nigeria plus ten other African countries. In 2025 it sold 27.5 million tonnes, of which 11.0 million came from its non-Nigerian operations, on group revenue of ₦4.31 trillion and net profit of ₦1.02 trillion. The refinery arm at Lekki, described above, reached 650,000 barrels a day in February 2026.
What makes the group instructive is the pattern rather than the scale. Cement is the archetypal non-tradable: heavy, cheap per tonne, expensive to move, protected by geography as much as by policy. It is an excellent business in a country that is building, and it does not require the export discipline Chapter 9 argues is the active ingredient in the East Asian recipe. The refinery answers that objection in part, since refined product is tradable and the plant now ships to other African markets, and it is a concentration of industrial capability under one owner that no West African state has created through policy. The group’s employment footprint relative to its capital is small. Dangote is what term three looks like when it improves inside a few very large firms, and it is why the pole’s aggregate productivity can rise while its wage-employment share stays in the teens.
MTN Ghana (Ghana)
MTN Ghana, the local operating company of the pan-African group, is the other half of the dual economy and the pole’s best example of a firm that reached the whole population rather than the top of it. At the end of 2025 it had 31.2 million mobile subscribers in a country of 34.4 million people, 19.9 million active data users and 19.3 million active mobile-money accounts, with 4G coverage reaching 99.2 percent of the population. Service revenue grew 36.2 percent to GH₵24.4 billion and profit after tax 55.9 percent to GH₵7.8 billion, with mobile money alone contributing GH₵6.0 billion of revenue.
The firm matters here for three reasons. First, it is the payments infrastructure Chapter 4 counted in the case for the pole: a country with nearly twenty million active mobile-money accounts has crossed a threshold that Nigeria, whose central bank resisted mobile money for a decade, crossed much later and less completely (Wilse-Samson, 2026). Second, it shows the identity’s second term from inside a firm. An operator with 31.2 million customers employs a few thousand people directly and supports a large agent network of small traders, which is employment of exactly the informal, low-capital kind the wage-employment overlay exists to distinguish from a job. Third, its profits are repatriable, and whose balance sheet the return sits on is the question Chapter 21 asks of the whole pole.
8. What the experiments say
The pole’s firms are not short of workers, and its workers are not short of ideas
Two randomized experiments in this corridor speak directly to the section 3 diagnosis, and they point the same way.
Hardy and McCasland (2023) offered small Ghanaian firms a young apprentice at no cost. If those firms were held back by the price or the risk of hiring, a free worker should have made little difference beyond the subsidy. Instead the firms that received an apprentice grew: they produced more, earned more, and many kept the worker after the subsidy ended. The authors read this as a labour market that fails on matching rather than on price, because firm and worker cannot find each other or credibly commit at the start. That is a term-two finding of the first importance, and it is encouraging in a limited way: some of the pole’s missing employment is a coordination problem rather than a productivity problem.
McKenzie (2017) evaluated Nigeria’s YouWiN! business plan competition, in which about $34 million of grants averaging roughly $50,000 were assigned at random among applicants already screened as plausible. Winners were substantially more likely to start a firm, to survive, to earn more and, most relevant here, to employ ten or more workers, an increase of over 20 percentage points on the control group. Cash at that scale, given to screened entrepreneurs, produced real firms with real payrolls.
Together the two results are hopeful and awkward at once. Both sides of the market respond: firms take workers when the matching problem is solved, entrepreneurs build firms when capital arrives in usable quantities. Neither experiment can fix what section 3 identified. A $50,000 grant does not build a transmission line and an apprenticeship does not clear a container.
9. Climate exposure
The pole’s climate exposure is simple to state, because it is almost entirely one thing: the coast is eroding and flooding, and the coast is where the pole is. A World Bank study of four West African coastal states, all four of them in this chapter, put the annual cost of coastal degradation in Benin, Côte d’Ivoire, Senegal and Togo at about $3.8 billion, or 5.3 percent of their combined GDP in 2017, with flooding and erosion more than 60 percent of the total (Croitoru, Miranda and Sarraf, 2019).
Lagos is the acute case. The city is built on a lagoon system at an elevation of roughly zero to five metres, so a sea-level rise of 12 to 17 centimetres by 2050, which is within the range of current projections, converts ordinary spring tides and heavy storms into recurrent urban flooding rather than exceptional events. The Victoria Island shoreline had been retreating for a century before the Eko Atlantic reclamation, and its protective beach was lost altogether in 2006, which is why the sea wall exists (South Energyx Nigeria, 2012). The engineering dispute matters for the whole corridor: hardening one section of a littoral typically moves the erosion along the coast rather than stopping it, and the adjacent communities to the east of the reclamation report exactly that, with residents and researchers at Alpha Beach counting more than 25 metres of land lost since construction began; the developer’s assessment holds that the project adds nothing to erosion down the coast (Agence France-Presse, 2019; South Energyx Nigeria, 2012). A pole of five countries sharing one longshore drift has a collective-action problem in coastal defence identical in structure to the one it has at the border posts, and no institution that addresses it.
The second exposure is rainfall variability inland, through the cocoa belt of Côte d’Ivoire and Ghana and through hydropower on the Volta and the Bandama. Chapter 11 carries the cocoa story and Chapter 14 the generation mix. The point to hold is that the pole’s two great exports, cocoa and crude, have opposite climate exposures, and only one of them can be moved inland.
10. Data quality
Data quality in this book is a layer rather than a caveat, so it gets its own section and its own table.
| Country | Last census | Last GDP rebasing | Last labour-force survey | Statistical performance score | Confidence flag |
|---|---|---|---|---|---|
| Côte d’Ivoire | 2021 | 2020 | 2019 | 70.2 | medium |
| Ghana | 2021 | 2018 | 2025 | 65.7 | medium |
| Togo | 2022 | none recorded | 2022 | 66.6 | medium |
| Benin | 2013 | none recorded | 2022 | 71.0 | high |
| Nigeria | 2006 | 2025 | 2023 | 69.1 | low |
| Senegal | 2023 | 2025 | 2024 | 81.4 | high |
Sources: national statistical offices for census, rebasing and survey years; World Bank Statistical Performance Indicators for the score; the confidence flag is this book’s own rule, described on the About the data page.
Two anchors carry most of the weight here, and both are Nigerian. The first is the census of 2006, the most recent Nigeria has held; later rounds have been repeatedly postponed, and the card says so on its face. Every Nigerian population figure in this chapter, and therefore every per-head figure, rests on projections forward from a twenty-year-old enumeration whose results were contested at the time, in a country where the count determines the allocation of federal revenue between states. That is why the Nigerian card carries a low confidence flag while Benin’s, on a 2013 census that is itself outside the rule’s fifteen-year window by 2028, carries a high one: the flag reads the whole statistical system, not the census alone.
The second anchor is the rebasing of 2025, which moved Nigeria’s national accounts to a 2019 base year and raised measured nominal output substantially, the second such revision in just over a decade. Chapter 1 carries the size of the jump and the earlier 2014 revision. What matters here is the direction of the error it corrects: rebasing does not make a country richer, it reveals that the old series was missing activity, mostly services and mostly informal, which is precisely what this chapter’s second and third terms are trying to measure. A reader asking how much of Nigeria’s minus 1.9 percent output-per-worker growth is real and how much is an artefact of a decade on a stale base is asking the right question, and this book cannot fully answer it.
What the numbers here can bear, then, is this: the ordering of the six countries on the three terms is robust, the finding that term one is fast and term two flat does not depend on any single series, and the creditor composition is as good as the international debt statistics are, which is good for bonded debt and poor for bilateral. What they cannot bear is a precise Nigerian level of anything, a metropolitan population for any city in the pole, or a term-two reading for Côte d’Ivoire that assumes its 2019 labour-force survey still describes its labour market.
11. Data sources
- UN World Population Prospects 2024, medium variant: every population figure here, national rather than metropolitan, and the working-age series behind term one. Ages 15 to 64 throughout.
- ILOSTAT modelled estimates, November 2025: terms two and three and the wage-employment, non-agricultural, informality and youth-inactivity overlays. Modelled rather than surveyed, which is why section 10 lists the survey years beside them.
- IMF World Economic Outlook, April 2026: output levels, output per head, observed growth and the five-year forecast.
- World Bank International Debt Statistics, 2025 release: the external debt stock and its creditor composition, in which bilateral lending is not split by creditor country.
- Boston University Global Development Policy Center, Chinese Loans to Africa database, 2000 to 2024 release: the Chinese column, a cumulative flow of commitments rather than a stock.
- World Bank Statistical Performance Indicators and the six national statistical offices: the data-quality table.
- IMF country reports and the World Bank’s Nigeria Development Update: the macroeconomic and programme narrative in sections 2 and 4.
- ECOWAS and the African Development Bank, Abidjan–Lagos Corridor Highway Development Project: the corridor road.
- Port authorities and terminal operators at Abidjan, Tema, Lomé and Lekki: container throughput.
- Company reports: Dangote Cement, Dangote Petroleum Refinery and MTN Ghana.
- The New Regional Economics, chapters 13 and 14 (Wilse-Samson, 2026): the corridor-time table, the reformed-corridor comparison and the consumption-city argument.
12. Exercises
Discussion questions
Nigeria’s output per worker fell over the decade to 2024 while Côte d’Ivoire’s rose at almost 3 percent a year on a similar demographic base, and both are commodity economies with coastal capitals in the same regional community. Using the framework of section 4 rather than a list of policies, set out the two most plausible explanations for the divergence and say what evidence, observable before 2030, would distinguish between them.
Section 3 argues that the binding constraint here is infrastructure rather than finance or human capital. Construct the strongest case against that reading. What would have to be true for the cost of finance to bind despite the sovereigns’ market access, and how would you test it?
Benin’s economy has grown quickly while its politics has closed; Ghana’s has been volatile while its politics has remained genuinely competitive. Dercon’s test asks whether the elite has bet on growth. Apply the test to both countries, and then say whether a test that scores Benin higher than Ghana is telling you something about the countries or something about the test.
Try it
Open the pole’s three largest economies side by side: Nigeria, Ghana and Côte d’Ivoire, in that order. Then switch to the Growth Pole Map, turn on the confidence toggle, and watch what happens to Nigeria. Write one paragraph on a single question: if the pole is where the book’s bet is most likely to be won, and the country holding most of its people is the one whose numbers are least trustworthy, what should a reader do with the aggregates in section 1? Argue for one of three positions: report the aggregate with the flag attached, report the five smaller countries and treat Nigeria separately, or refuse the aggregate.
Data exercise
Download all fifty-four cards from the country cards page on this site, as cards.csv or cards.json, and build a table of the six countries in this chapter with these fields: identity.working_age_pop_growth, identity.employment_to_wa_growth, identity.output_per_worker_growth, identity.gdp_growth_observed, overlays.wage_employment_share, scale.population, scale.gdp_usd and data_quality.confidence_flag. Then do four things. First, reproduce Table 24.1 and confirm that the three terms sum to implied growth and that implied growth is close to observed. Second, compute a population-weighted and an output-weighted average of each term across the five corridor countries, excluding Senegal, and say in one sentence why the two weightings give such different pictures. Third, recompute both excluding Nigeria, and say what share of the gap between the pole and the continental median is a Nigeria effect. Fourth, rank the six by wage-employment share and by output-per-worker growth and write two sentences on whether the rankings agree. Treat nulls as missing, never as zeros.