21. Capital and Sovereign Debt
Fifty of the fifty-four country cards carry an external debt stock, and between them they owe $1,175.5 billion. Of that, $707.9 billion is publicly guaranteed long-term debt, the part the statistics divide by creditor: $264.5 billion owed to multilateral institutions, $148.7 billion to foreign governments, $294.7 billion to private lenders, and inside that last figure $192.8 billion of bonds. The other $467.6 billion is short-term paper, Fund credit and private borrowing without a government guarantee, and it carries no creditor name at all.
Cut the same $707.9 billion a second way, by the country the creditor sits in rather than the kind of institution it is, and two further lines appear: $97.3 billion owed to the twenty-two permanent members of the Paris Club, 13.7 percent of the guaranteed stock, and $82.2 billion owed to China, 11.6 percent. The second figure is 55 percent of the entire official bilateral column, which cannot be right if China is a government lender and the bilateral column is what governments are owed. It is right, and explaining why is the first thing this chapter has to do.
Learning Objectives
After reading this chapter, you should be able to:
- Place capital in the book’s identity, explain why debt is a stock and the identity a set of flows, and say what a sovereign balance sheet records.
- Read the creditor composition of African external debt off the country cards, and say what the two empty creditor lines mean for any statement about who Africa owes.
- Narrate the wall of the 2020s in order: the issuance cycle of 2013 to 2021, the pandemic, the Debt Service Suspension Initiative, the four Common Framework cases, and the return to market of 2024 to 2026.
- Explain hidden debt in its four forms, and say why a debt sustainability analysis rests on what a state chooses to report.
- Say who lends, on what terms and under whose law, and what changes when a sovereign’s income is a rent rather than a wage bill.
Capital in the identity, and the balance sheet underneath it
GDP growth is approximately the growth of output per worker, plus the growth of the employment-to-working-age ratio, plus the growth of the working-age population, and all three are growth rates. Capital does not appear in that arithmetic, which is the point rather than an oversight: it enters through the third term, because output per worker rises when the worker has more and better things to work with, and nowhere else. A port, a transmission line, a fertiliser plant and a locomotive are all attempts to buy a higher third term, and sovereign debt is how most African states have paid for them.
So the chapter’s subject is the financing side of term three, and its method is the second of the book’s three lenses, sketched in Chapter 1 and used pole by pole through Part VI. A flow statement asks what an economy produced this year. A balance sheet asks what it owns, what it owes and to whom: export receipts, remittances, aid, foreign investment, policy-bank lending and bond issuance on the sources side; imports, investment, debt service and capital flight on the uses side; the creditors, the foreign owners of the mines and ports and networks, and the diaspora on the ownership side. Three properties of a stock make it behave unlike a flow: it is cumulative, so a decade of small deficits is a large debt; it has a maturity, so an obligation contracted in 2014 arrives, undiminished, in 2024; and it has a legal owner who can sue, which is why the last third of this chapter is about law.
What the cards can and cannot carry
Table 21.1 is the continental balance sheet as the country cards hold it, and its most useful column is the first.
| Line | Cards carrying it | Total ($bn) | Share of guaranteed debt (percent) |
|---|---|---|---|
| External debt stock | 50 | 1,175.5 | |
| By type of creditor | |||
| Multilateral | 50 | 264.5 | 37.4 |
| Official bilateral | 50 | 148.7 | 21.0 |
| Private creditors | 43 | 294.7 | 41.6 |
| of which bonds | 23 | 192.8 | 27.2 |
| Publicly guaranteed debt | 707.9 | 100.0 | |
| Not divided by creditor | 467.6 | ||
| By country of the creditor | |||
| Paris Club, 22 members | 50 | 97.3 | 13.7 |
| China | 46 | 82.2 | 11.6 |
| Falling due | |||
| Debt service, 2026 to 2030 | 50 | 389.5 | 55.0 |
| Chinese loan commitments, 2000 to 2024 | 49 | 176.3 |
Table 21.1. Billions of US dollars. The middle block and the block below it are two different cuts of the same $707.9 billion of publicly guaranteed long-term debt and must never be added together. The first cut is by the kind of institution that lent, and it is a partition: multilateral plus bilateral plus private is the guaranteed stock exactly, with bonds a subset of the private line. The second is by the country the creditor is resident in, and it runs across all three, so a country’s line contains its government’s lending and its banks’ and its exporters’ together. The guaranteed stock is 60.2 percent of the external debt stock; the rest is short-term debt, Fund credit and private borrowing without a guarantee, and is the “not divided” row. Debt service is principal and interest falling due over the five years on the debt already outstanding. Libya, Namibia, South Sudan and the Seychelles carry none of this. The commitment row is a cumulative flow of loans signed between 2000 and 2024, not a stock, and is set apart for that reason. Sources: World Bank International Debt Statistics, 2025 release, for every debt line, and the Boston University Chinese Loans to Africa database, 2000 to 2024 release, for the commitment row, both via the country cards.
Read the counts column before the dollars. Fifty cards carry a stock, a multilateral line and a bilateral line, which is what a statistical system built for the debt of poor countries produces. Forty-three carry a private-creditor line and only twenty-three a bond line, which is what a continent looks like when half of it has never sold a bond.
Then read the two blocks and refuse to add them. The temptation is obvious: six creditor lines, six slices, one pie. They are not. The Paris Club and China lines are cut by the creditor’s country, and a lender’s country says nothing about whether the statistics count it as official or private, so those two lines run across the three above them. This is why China’s $82.2 billion can be 55 percent of a $148.7 billion bilateral column without being 55 percent of what governments are owed. China Eximbank is an official bilateral creditor in these accounts; China Development Bank is a private one; a Chinese contractor’s supplier credit is private too; and the country line collects all three. Angola is the extreme illustration and Chapter 30 works it through: $14.4 billion owed to China against an entire official bilateral column of $4.1 billion, because most of what Angola borrowed from China it borrowed from a lender the statistics classify as commercial. Four cards do this: Angola, the Republic of the Congo, Guinea and Zambia. On nine more the Paris Club line exceeds the bilateral column for the same reason on the other side of the ledger, since officially supported export credit is usually advanced by a commercial bank and recorded as private lending from the exporter’s country. A reader who adds the six lines gets $1,080 billion of creditors for $707.9 billion of debt.
The rest of the balance-sheet block is fuller than the debt lines alone suggest, and what is missing from it is missing for a reason the card states. The three flow lines are there: remittances on 48 of the 54 cards, foreign direct investment and official development assistance on all 54. The debt-service profile is on the fifty that report at all, the restructuring status on fifty-three, and the collateralisation flag on eleven. Two fields stay empty on all fifty-four and will. The outstanding face value of a country’s Eurobonds is published, instrument by instrument, in exactly one place that covers all fifty-four, and that place licenses its data for non-commercial use only, which this book cannot accept; the alternative is twenty-odd debt offices publishing on twenty-odd definitions, which is not a column. And the three credit ratings are proprietary. A missing number with a reason attached is a different object from a missing number, and this book would rather print the reason than the estimate.
Who owes, and how much
Concentration first. The five largest external debtors are South Africa at $175.9 billion, Egypt at $156.0 billion, Nigeria at $108.8 billion, Mozambique at $69.8 billion and Morocco at $68.0 billion, and between them they are 49.2 percent of the continental stock; the ten largest are 68.7 percent. That is almost exactly the concentration of output Chapter 1 reported: in dollars African debt is a large-economy phenomenon, and the countries in the debt-crisis headlines are mostly not the large economies.
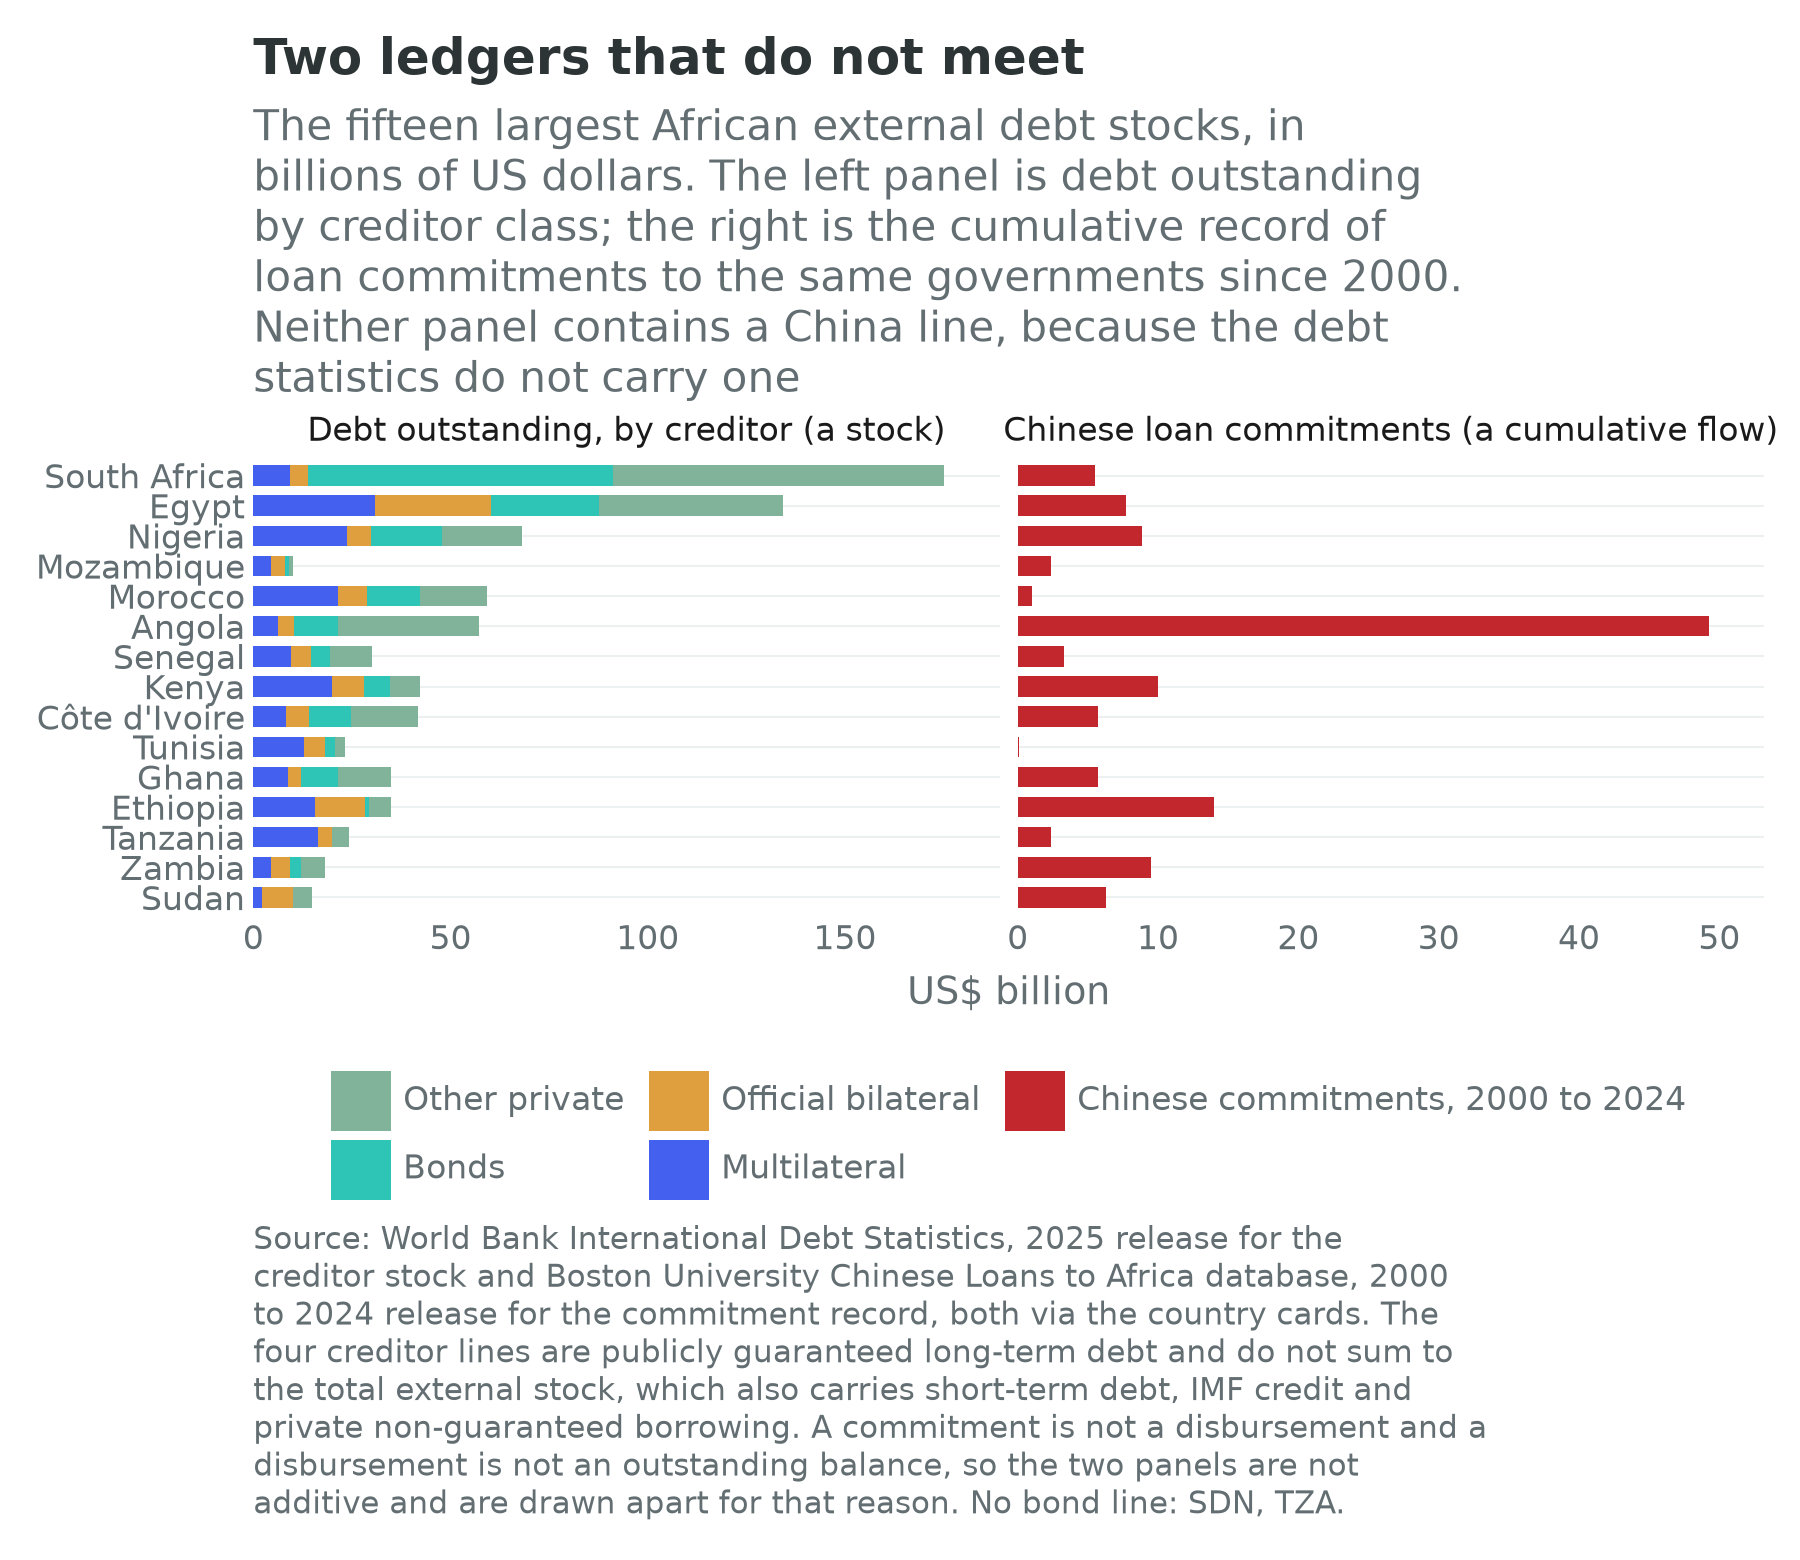
South Africa’s bar is almost entirely private: $77.4 billion of bonds and $84.1 billion of other private credit against $9.2 billion multilateral and $4.6 billion bilateral, and Chapter 25 explains how little of that is the sovereign borrowing in a foreign currency. Ethiopia’s is the mirror image, with $28.3 billion of its $36.5 billion owed to multilateral institutions and governments and exactly $1.0 billion in bonds. Tanzania and Sudan have no bond line at all. Kenya’s bar is dominated by multilateral lending, $20.0 billion of a $42.9 billion stock, which is why Chapter 26 calls it a multilateral pole and why the fiscal pressure there shows up on the domestic side.
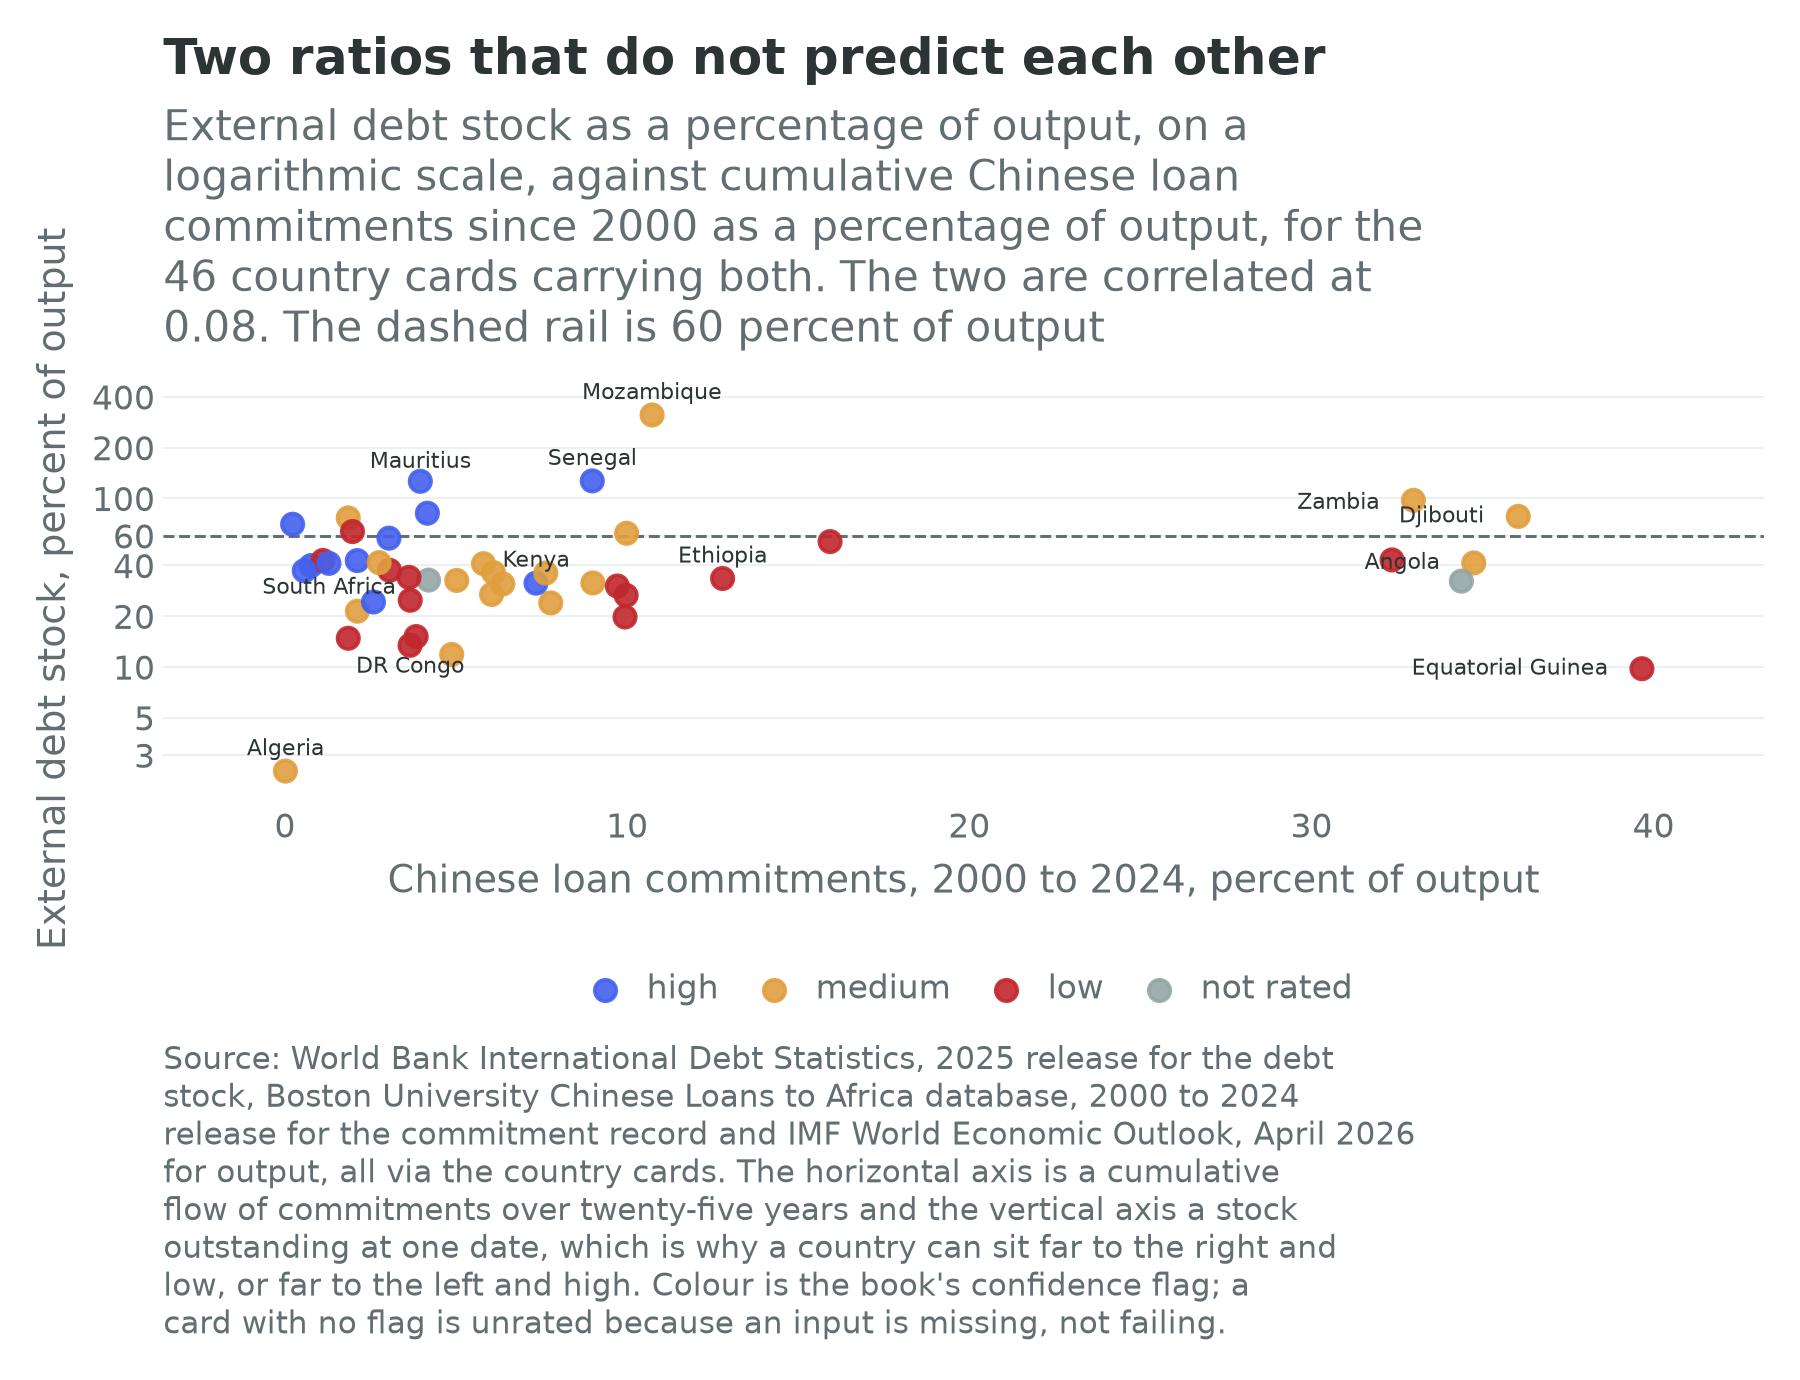
Now the ratio, which decides whether any of this is a problem. Across the fifty cards carrying both a stock and an output figure the median external debt is 35.1 percent of a year’s output, which is not a crisis; ten countries sit above 60 percent and three above 100, and the five lowest ratios are Algeria at 2.4 percent, Equatorial Guinea at 9.8, Botswana at 11.9, the Democratic Republic of the Congo at 13.4 and Somalia at 13.9. A low external debt ratio can be prudence and it can be exclusion, and the ratio alone will not tell you which.
| Country | External debt stock (\(bn) | Output (\)bn) | Debt to output (percent) | Bonds (\(bn) | Chinese loan commitments, 2000 to 2024 (\)bn) | Confidence | ||
|---|---|---|---|---|---|---|
| Mozambique | 69.8 | 22.3 | 312.3 | 0.9 | 2.4 | medium |
| Senegal | 47.1 | 37.1 | 127.0 | 5.0 | 3.3 | high |
| Mauritius | 20.4 | 16.1 | 126.3 | 0.0 | 0.6 | high |
| Zambia | 28.1 | 28.9 | 97.4 | 2.7 | 9.5 | medium |
| Rwanda | 13.1 | 16.0 | 81.7 | 0.6 | 0.7 | high |
| Djibouti | 3.4 | 4.4 | 78.2 | none recorded | 1.6 | medium |
| Cabo Verde | 2.4 | 3.1 | 76.6 | none recorded | 0.1 | medium |
| Tunisia | 40.5 | 57.6 | 70.3 | 2.5 | 0.1 | high |
| The Gambia | 1.6 | 2.6 | 63.6 | none recorded | 0.1 | low |
| Lesotho | 1.8 | 2.9 | 62.1 | none recorded | 0.3 | medium |
Table 21.2. The ten country cards whose external debt stock exceeds 60 percent of a year’s output, ranked. Mauritius’s bond line is $9 million and rounds to zero at one decimal place. The commitment column is a cumulative flow, not a stock, and is shown to make the point that the two rankings are unrelated. Sources: World Bank International Debt Statistics, 2025 release, and the Boston University Chinese Loans to Africa database, 2000 to 2024 release, with output from the IMF World Economic Outlook, April 2026; the confidence flag is this book’s own rule.
The table is a warning about ratios rather than a league of the distressed. Mozambique’s 312 percent is project finance raised against liquefaction plants that have not yet shipped a cargo, which Chapter 12 works through, rather than a sovereign obligation in the ordinary sense. Mauritius at 126 percent is a small island with a very large offshore financial sector, whose external liabilities belong mostly to funds domiciled there rather than to the state. Senegal’s is a restatement, the subject of a section below; Zambia’s is what a completed restructuring looks like, and Chapter 30 has it; Rwanda’s is concessional borrowing from development banks to finance a strategy, which Chapter 26 argues is a different act from borrowing at ten percent to refinance a railway.
Nothing on the cards will tell you which of the ten is in trouble. What the cards do is put the question in the right form: not how much, but owed to whom, on what terms, and falling due when.
The wall of the 2020s
The cards answer the last of those three questions, and the answer is larger than the debate about it. Across the fifty countries that report, $389.5 billion of principal and interest on publicly guaranteed external debt falls due between 2026 and 2030. That is 55 percent of the guaranteed stock outstanding, repayable inside five years, and it is a schedule on debt already contracted rather than a forecast of anything: no new borrowing is in it, and no rollover. Egypt owes $65.8 billion of it, South Africa $52.9 billion, Angola $41.4 billion, Nigeria $29.3 billion and Morocco $22.2 billion.
Set it against output and the ranking changes, as it always does. The median country owes 12.1 percent of a year’s output over the five years; eight owe more than a fifth of one, and Senegal, at 40.8 percent, more than twice the median. Djibouti is second at 31.6 percent and Angola third at 29.2. Two of those three are the poles Chapters 29 and 30 examine, which is not a coincidence: a corridor is financed long and repaid on a schedule that arrives whether or not the corridor is carrying anything yet.
One qualification, and it is the reason this section does not end here. The five-year total is guaranteed debt only, so it excludes the short-term paper and the unguaranteed private borrowing that are two fifths of the continental stock; and it is a total for five years rather than a profile across them, because the card carries one scalar and the year-by-year schedule is not on it. The shape of the wall, which year is worst and for whom, still has to come from outside the cards, and the rest of this section is where it comes from.
The cycle that built it
Between 2007 and 2021 African sovereigns discovered the international bond market and it discovered them, on terms set in Frankfurt and New York rather than in Accra or Lusaka. Near-zero policy rates sent yield-seeking investors into frontier debt; debt relief under the Heavily Indebted Poor Countries initiative had left many African sovereigns with clean balance sheets and no market history; and the commodity boom of the 2000s had made the arithmetic look easy. Ghana issued in 2007, and by 2021 some twenty African governments had bonds outstanding.
What they bought was expensive money that was also unconditional money. A bond investor does not ask for a public financial management reform, does not sit on a project steering committee and does not take two years to disburse, and for a minister who has spent a career waiting on a multilateral project cycle the appeal is obvious and not disreputable. The cost is the same coin’s other side: bondholders do not reschedule quietly the way a bilateral creditor does, they are numerous and anonymous, and their claim matures on a date. The maturities were mostly ten years, which is how a borrowing cycle running to 2021 became a repayment cycle running through the 2020s. Chapter 24 calls the West African coast a bonded pole for that reason: its six countries owe $45.1 billion on bonds, and all but Togo have sold debt to private investors abroad.
The pandemic, and the initiative that was not enough
In April 2020 the G20 and the Paris Club suspended official bilateral debt-service payments for the poorest countries under the Debt Service Suspension Initiative. It ran to the end of December 2021, forty-eight of the seventy-three eligible countries took part, and it suspended about $12.9 billion of payments (World Bank, 2022a). Against what it was for it worked: fast liquidity relief when nobody knew how deep the recession would be. Against the problem it was almost beside the point, because it covered official bilateral creditors only, so the bondholders who by then held a fifth of the continent’s external claims were untouched, and several eligible countries declined to take part for fear of a downgrade. A country that asks the official sector for relief is telling the private sector something about itself, and the private sector prices it.
The Common Framework, and its four cases
The successor arrangement, agreed in November 2020, was the Common Framework for Debt Treatments beyond the DSSI (Group of Twenty, 2020). Its design was a genuine advance and its execution was not. The advance was that it brought China, India, Saudi Arabia and the other large non-Paris Club official creditors into one committee with the Paris Club for the first time and required private creditors to deliver comparable treatment; the problem was a process without a timetable, a comparability test without a formula, and a committee whose members had never worked together.
The cards carry the count, and the striking thing about it is how small it is. Four of the fifty-four have applied to the Common Framework: Chad, Ethiopia, Ghana and Zambia. Six more have restructured or are restructuring outside it: Mozambique, the Republic of the Congo, Malawi, Zimbabwe, Sudan and Somalia. The other forty-three have no debt treatment of any kind on the record since 2015, and one, Senegal, is deliberately left unclassified, for reasons the section below gives. Ten countries with $223.9 billion of external debt between them, 19 percent of the continental stock, have been through or are in a process; the four Common Framework cases alone hold $105.4 billion, 9 percent. A crisis narrative that treats African sovereign debt as a single distressed asset class is describing a fifth of it.
| Country | Applied | Largest private claim | What the treatment did | Where the case is told |
|---|---|---|---|---|
| Chad | January 2021 | A commodity trader’s oil prepayment facility | Rescheduled about $3 billion; no reduction in what was owed, on the argument that a high oil price had made relief unnecessary | Here, and Chapter 12 on the instrument |
| Zambia | February 2021 | About $3 billion of bonds | Restructured the bonds at a nominal haircut of roughly 21.6 percent including past-due interest; memorandum with official creditors agreed in October 2023 | Chapter 30 |
| Ghana | January 2023 | About $13.1 billion of bonds | Exchanged the bonds on 9 October 2024 at a nominal haircut of 37 percent on principal, alongside about $5.4 billion restructured with official creditors | Chapter 24 |
| Ethiopia | Early 2021 | One bond, $1.0 billion | Missed the coupon in December 2023 and spent five years in process for a single billion dollars of bonded debt | Chapter 29 |
Table 21.3. The four African applications to the G20 Common Framework, in the order they were made. Sources: the Bretton Woods Project (2022) for Chad; Afronomicslaw (2023) and the Paris Club (2023) for Zambia’s timetable; Ghana’s Ministry of Finance (2024) for the Ghanaian exchange; International Monetary Fund (2026b) for Ethiopia; the country cards for the bond line.
Chad waited nearly two years to be told it did not need relief. Ethiopia was slowest of all, which is the finding, because it owed the least to private creditors: comparability has to be established whether the private claim is thirteen billion dollars or one, and the cost does not scale down. Set the four side by side and the design critique writes itself. The Framework has no deadline, so a creditor with a reason to wait can wait; comparability is asserted rather than computed, so each case relitigates it; and nothing stops litigation or debt service while the process runs, so a country in the queue is a country not paying its suppliers. It also delivered, in the end, in all four cases, which its harsher critics understate. The verdict is that it is a machine that works and takes three years to do it, and that the cost of the third year falls on a population rather than on a creditor.
The Global Sovereign Debt Roundtable, convened in February 2023 by the Fund, the World Bank and the G20 presidency, is the response to that verdict and is deliberately modest (International Monetary Fund, 2023): not a treaty and not a bankruptcy court, but a standing room in which official creditors, private creditors and debtor governments argue about process, whose output has been guidance on information sharing, an agreed statement of the steps a restructuring passes through, and slow convergence on what comparability means (Group of Twenty, 2025). Thin, against the alternative in which the next twenty cases each discover the same problems from first principles, is not nothing.
The return to market
Then the window reopened.
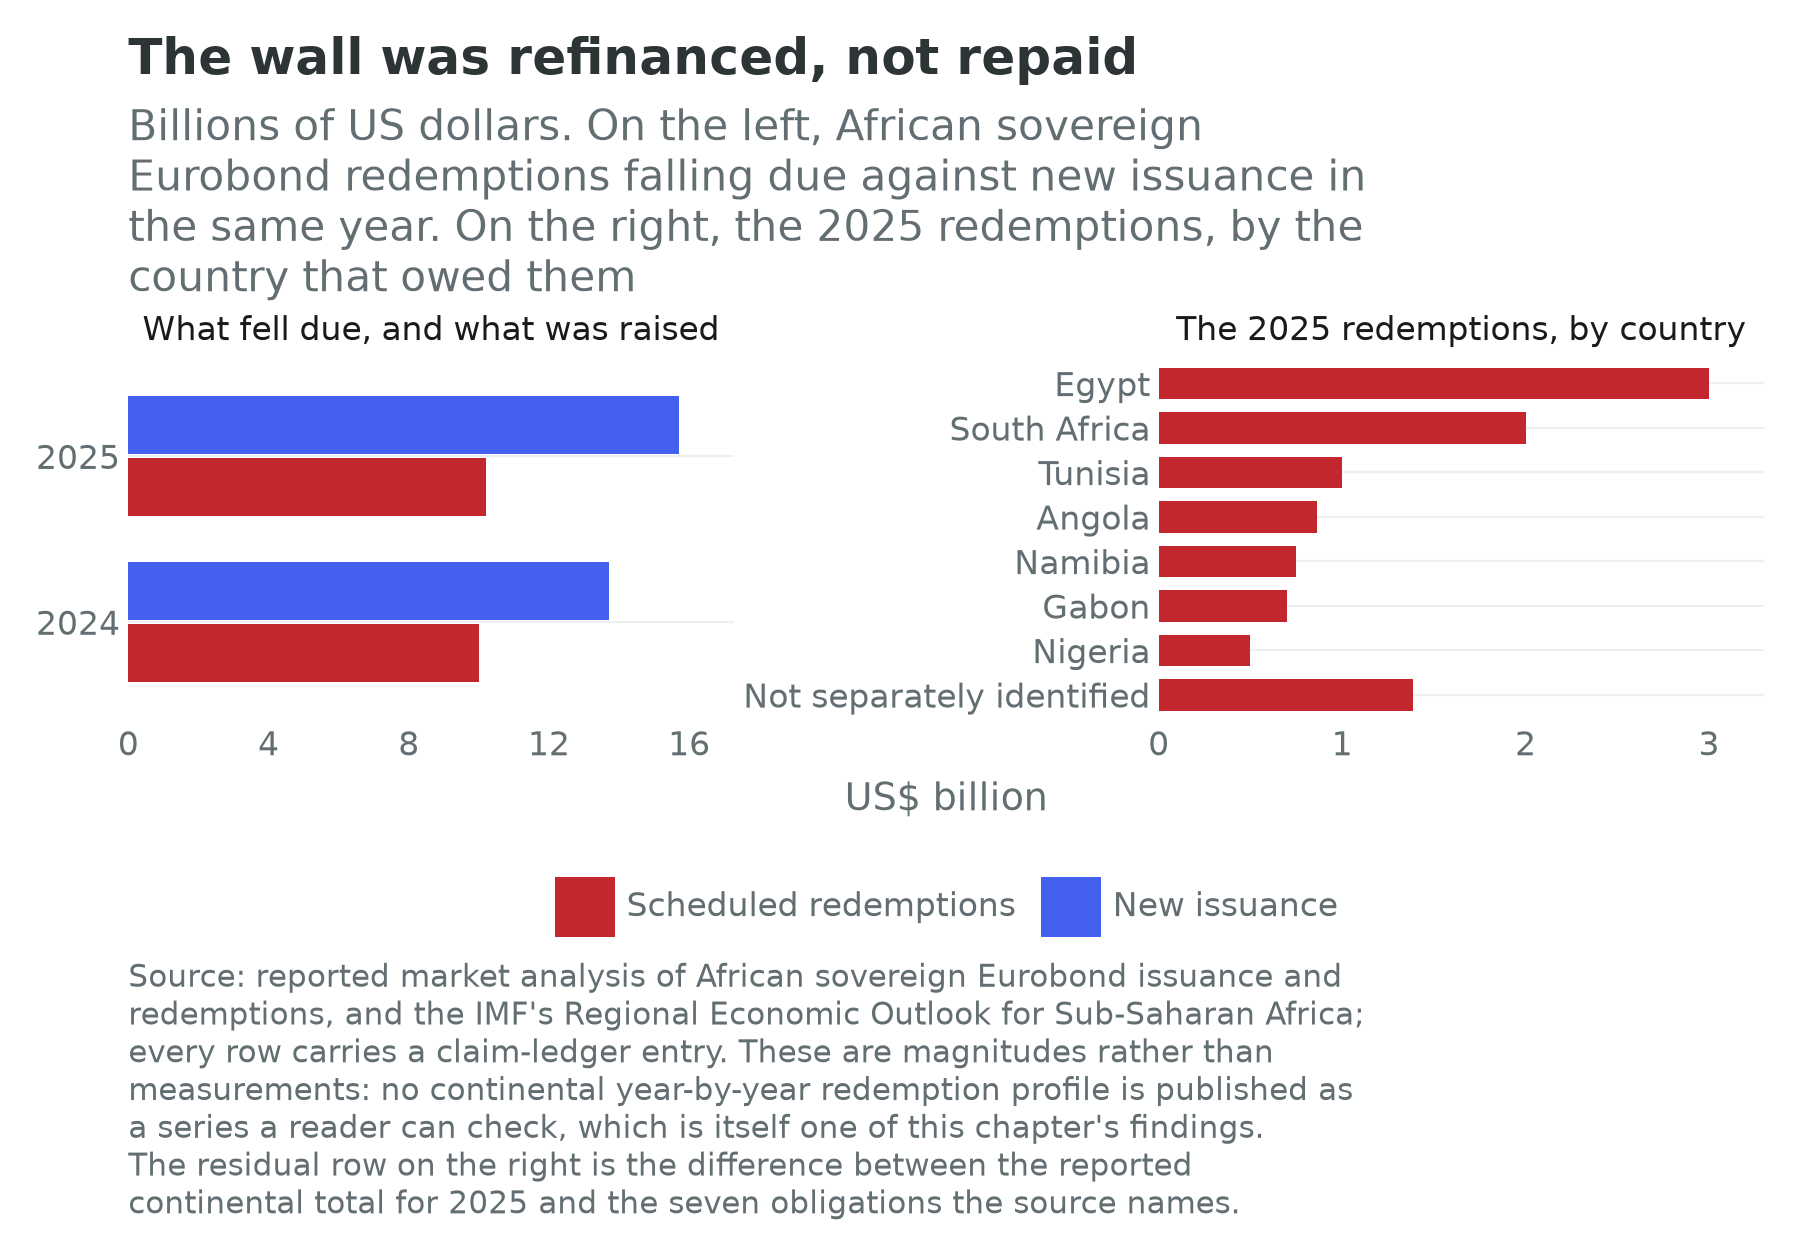
Côte d’Ivoire went first, in January 2024, and Benin and Kenya followed within weeks; the three raised about $4.8 billion at rates of 8.4 to 10.4 percent (Direction générale du Trésor, 2024). Kenya’s mattered most, because it refinanced a $2 billion bond maturing in June against which the market had been pricing a default, and Chapter 26 gives the terms. Senegal, Cameroon and Nigeria followed, and total African sovereign issuance reached about $13.7 billion in 2024 (Intelpoint, 2025); Angola returned in October 2025 with $1.75 billion in two tranches at coupons of 9.25 and 9.78 percent, its first sale since 2022 (Ver Angola, 2025); and by early October 2025 spreads on one index had narrowed to about 388 basis points, the tightest since 2019 (Kakpo, 2025). In the first two months of 2026 Sub-Saharan sovereigns raised about $5.5 billion, the strongest start to a year since 2013 (International Monetary Fund, 2026f), and in April the Democratic Republic of the Congo sold its first bond, $1.25 billion, in two tranches at 8.75 and 9.5 percent (African Business, 2026a).
Two readings, and both are true. The optimistic one is that market access recovered faster than anyone predicted in 2023: a sovereign that can refinance does not have to choose between a maturity and a teacher’s salary, and Zambia’s and Ghana’s restructurings evidently did not poison the well for their neighbours, which is roughly what Cruces and Trebesch (2013) would predict, since their finding from 180 restructurings between 1970 and 2010 is that the size of the haircut, rather than the fact of the default, sets the spread a country pays afterwards.
The pessimistic reading is in the figure. Redemptions of about $10 billion in each of 2024 and 2025 were met with $13.7 billion and $15.7 billion of issuance, so the wall was refinanced rather than repaid, at coupons between eight and ten percent where the original bonds had been sold at five and six. A country that rolls a ten-year bond at twice the coupon has bought time, and the price is that differential every year for ten years. Whether it was worth paying depends on what the money bought the first time, which is a question about term three rather than about the bond market.
Senegal, and what a statistical system is worth
The sharpest recent case is not a default at all. It is a measurement failure, and it belongs in this book for that reason.
A government took office in Senegal in April 2024 and commissioned an audit of the public finances covering 2019 to March 2024; the national audit court published in February 2025 and the Fund’s reconciliation followed. Deficits over 2019 to 2023 had been understated by about five and a half points of output a year (Ndiaye and Kessler, 2026); central government debt at the end of 2023 was restated from 74.4 percent of output to 111.0 percent and stood at 118.8 percent at the end of 2024 (International Monetary Fund, 2025c), with total public-sector liabilities including some state-enterprise debt and domestic arrears put at about 132 percent (Ndiaye and Kessler, 2026); a programme of about $1.8 billion was frozen, and negotiations over a successor arrangement and a waiver for the misreporting ran until September 2026 (Reuters, 2026).
Senegal is also the one card in the book whose restructuring status is deliberately blank. The Fund announced a staff-level agreement on 1 September 2026 for a three-year facility of about $2.2 billion, subject to Board approval and to a waiver in the misreporting case, and the government has said it will reprofile its external commercial debt; no creditor has yet agreed to anything. “None” would deny a process that has been announced and “other” would claim one that has not begun, so the field says nothing and records why. Every other card takes a value. That is what a data-quality layer is for: the one case where the honest answer is that the category does not yet apply is the case a reader most needs flagged, and it is better flagged on the card than smoothed into a count.
Three things about this case. The first is that the discovery was domestic: an incoming government audited its predecessor and published, and the national audit institution did the work. That is the cheapest signal Chapter 4 names for whether a state wants to know the truth about itself, and Senegal’s statistical system is otherwise the best-scored on the continent, at 81.4 on the World Bank’s statistical performance measure, with a census in 2023, a labour-force survey in 2024 and a high confidence flag. Hidden debt is not a symptom of a weak statistical office but a decision taken above its head, and a good office is what eventually finds it.
The second is that a restatement moves the numbers a book like this one prints. Senegal’s card carries an external debt stock of $47.1 billion against an economy of $37.1 billion, with a note recording the restatement. Its five-year growth forecast, at 2.9 percent a year, is roughly half Côte d’Ivoire’s, in a country whose identity terms over the decade to 2024 were among the strongest on the continent, with a working-age population growing at 3.51 percent a year and the second-highest employment-ratio growth of the fifty-three cards. A balance sheet can undo a decade of the real economy in eighteen months.
The third is the argument the case has generated, which is genuinely open. Senegal’s government has resisted a restructuring and pressed for a reprofiling: longer maturities, no reduction in face value, no formal default. The case for it is that a face-value cut would cost years of market access to buy relief the country does not need, since the underlying economy is producing hydrocarbons and growing. The case against it is Reinhart and Trebesch (2016), whose comparison of relief episodes across a century finds that what moves subsequent growth and ratings is a reduction in face value, and that maturity extensions without it mostly postpone the problem. Senegal is running the experiment in public.
The political limit of adjustment
One more episode belongs here, because it prices the thing every debt-sustainability analysis assumes and none of them measures. Kenya’s Finance Bill of 2024 proposed to raise about 346 billion Kenyan shillings, KSh, in additional taxation, on a government whose debt service already took a large share of ordinary revenue in the way Chapter 26 sets out (National Treasury of Kenya, 2024). Protests began in June, parliament was stormed on 25 June, and on 26 June the president said he would not sign the bill (Carter, 2024); by the end of the month Amnesty International had counted twenty-four people killed by police (Kinyanjui, 2024).
The lesson is not that Kenyans object to taxes; every population does. It is that a debt sustainability analysis contains a line for the primary balance a government will run over the medium term, and that line is a political forecast dressed as an arithmetic one. Kenya’s assumed a revenue effort its own politics would not supply, and the bill that would have supplied it cost lives. An adjustment path that has not survived contact with a legislature is a path a creditor should discount, and a three-year Common Framework case is three years in which somebody has to hold one.
Who lends
The composition of Africa’s creditors changed more between 2000 and 2025 than in the previous half-century, and the change is what makes a restructuring hard. A structure of five governments and a development bank can be renegotiated in a room. The present one cannot.
The multilaterals are the largest single official class, at $264.5 billion across fifty cards, 37.4 percent of publicly guaranteed debt. The World Bank’s International Development Association is the largest, lending at very long maturities and near-zero interest to the poorest countries; its twenty-first replenishment in December 2024 raised a headline $100 billion, the largest in its history and short of the $120 billion asked for (World Bank, 2025h). The African Development Bank’s concessional window replenished a year later at $11 billion against an initial target of $25 billion, with twenty-three African countries pledging into it for the first time, $182.7 million between them (African Development Bank, 2025a). A record and a shortfall in the same sentence is the condition of concessional finance in the second half of this decade. The Fund is a different animal, lending short and against conditions, less a creditor than the gatekeeper whose programme unlocks everybody else’s money.
The Paris Club is the shrinking share, and its shrinkage is the most consequential fact about restructuring. Formed in 1956 as an informal group of rich-country official creditors, it ran the workouts of the 1980s and 1990s and the relief of the 2000s, and it worked because its members were few, similar and repeat players. The cards say how much its twenty-two members are owed: $97.3 billion, 13.7 percent of Africa’s publicly guaranteed external debt, across all fifty cards that report. The largest single claim is on Egypt, $16.7 billion, followed by Angola at $11.5 billion, Morocco at $9.0 billion, Côte d’Ivoire at $7.6 billion and Senegal at $6.7 billion: a Mediterranean and West African list rather than a list of the distressed. Three cards carry a Paris Club line of zero: Burundi, The Gambia and Equatorial Guinea owe its members nothing at all. A workout designed around a club needs the non-members in the room, and on twenty-six of the forty-six cards carrying both lines the non-member is already the larger creditor: China is owed more than the whole Club.
One clarification, because it is where a careless reading goes wrong. Membership of this line is the Club’s own list of its twenty-two permanent members and nothing else. China has attended Paris Club meetings on an ad hoc basis since 2013, India since 2019 and Hungary since 2024, and South Africa was a prospective member from July 2022 until July 2026; none of them is counted here. The distinction is the subject matter: a creditor who attends is not a creditor who is bound.
China is the other large official-side claim, and Chapter 32 owns the relationship. The cards put it at $82.2 billion across forty-six countries, 11.6 percent of guaranteed African external debt and 84 percent of what the Paris Club is owed. The largest exposures are Angola at $14.4 billion, Ethiopia at $7.4 billion, Egypt at $5.9 billion, Kenya at $5.4 billion, Zambia at $5.3 billion and Nigeria at $5.3 billion. Four countries owe China nothing that the statistics record: Botswana, Guinea-Bissau, Somalia and São Tomé and Príncipe. Read this line as what it is: debt owed to creditors resident in China, of every kind, which is the right unit for a restructuring and the wrong one for an argument about aid.
Two debt-side facts belong here. The lending peaked in the middle of the 2010s and has fallen a long way since, towards smaller facilities and trade finance. And the characteristic behaviour in distress is bilateral and quiet, a reprofiling agreed out of public view like the moratorium on Djibouti’s railway and pipeline loans that Chapter 29 records, rather than a haircut agreed in a committee; the tension inside the Common Framework has been exactly between that habit and the multilateral one.
The Gulf is the newest official creditor and the least documented. Saudi, Emirati and Qatari money arrives as central-bank deposits, project finance and occasionally an investment commitment large enough to substitute for a Fund programme, as with the $35 billion Abu Dhabi commitment to Egypt in 2024 that Chapter 27 takes up (ADQ, 2024). The deposits are the instrument to watch: one rolled every year is a short-term liability that behaves like a long-term one until the year it is not rolled.
The bondholders are numerous, anonymous and organised only when they have to be. A distressed sovereign negotiates with an ad hoc committee formed for the occasion by the largest asset managers holding the paper, advised by a specialist law firm and an investment bank; it has no formal standing, and its authority is that its members hold enough of each series to block or carry a vote. The law matters. Almost all African sovereign bonds are governed by English or New York law, and both markets have converged on the model clauses the International Capital Market Association published in 2014: an aggregated collective action clause letting a supermajority across series bind holdouts, and a pari passu clause redrafted to close the reading that produced fifteen years of litigation against Argentina (International Capital Market Association, 2014). Those clauses are why Zambia’s and Ghana’s exchanges could be completed at all, and the quiet reason modern restructurings have been faster on the private side than on the official one.
The domestic financial system is the creditor Chapter 16 owns and the one this chapter’s external tables cannot see. In most African countries the sovereign’s largest creditor is its own banking system, holding treasury bills at a zero risk weight, with the pension funds behind it pointed at the same paper by prudential rule. That is rational for each institution and a fragility for the system, because the correlation across holders is one. Ghana proved it: the domestic exchange completed in February 2023 tendered about 83.0 billion Ghanaian cedi, GH₵, of principal at a participation rate near 85 percent, covering roughly 65 percent of outstanding domestic bonds, and the losses fell on banks, insurers and savers (Ghana, Ministry of Finance, 2023). A country whose banks are heavily exposed to their own sovereign has converted a fiscal problem into a banking problem in advance.
The traders are the creditor with no debt column. A commodity house that prepays for eighteen months of cargoes has made a secured loan priced off the collateral rather than the sovereign’s credit, and Chad’s case is what happens when that creditor holds the largest private claim in the room.
The plurilateral African lenders are the newest complication and the most interesting. Afreximbank in Cairo and the Eastern and Southern African Trade and Development Bank are multilateral institutions owned substantially by African states, and both lend at scale to African sovereigns. Both claim preferred creditor status, the convention under which multilateral lenders are repaid ahead of others and excluded from restructurings, and Afreximbank grounds the claim in its founding agreement, ratified into its members’ national law. Ghana and Zambia, pressed by their official creditor committees to treat comparable claims comparably, took the view that these loans had to be restructured like any others (Afronomicslaw, 2025). The dispute went public in 2025, when a rating agency downgraded Afreximbank to BBB minus citing non-performing sovereign exposures of about $750 million to Ghana and $45 million to Zambia, and the bank terminated its relationship with that agency (Global Trade Review, 2025); Ghana and the bank later settled.
That is a genuine dilemma rather than a scandal. Preferred creditor status is not a right but a practice, sustained because everyone believes it will be sustained, and it is what lets a multilateral lend cheaply into a bad situation. If an African-owned institution can claim it, African sovereigns get a lender that lends when others will not; and because it can claim it, the pool of debt available to be restructured shrinks and the haircut on everybody else rises. Both are true, and the continent owns the bank on both sides of the argument.
The rating agencies are not creditors and they set the price. Three firms rate almost every African sovereign, and their assessments decide which institutional investors may hold the paper at all: as of 2024 only Botswana and Mauritius held an investment-grade rating, so African sovereign debt is, for most of the world’s largest pools of capital, uninvestable by mandate rather than by judgement (OECD, 2025). Whether that is fair is the subject of the Eurobond Africa-premium exhibit in Chapter 37, whose working paper argues that a substantial part of the spread African sovereigns pay is a risk perception rather than a measured risk (Gbohoui, Ouedraogo and Some, 2023). The African Union’s answer is the African Credit Rating Agency, headquartered in Mauritius, not owned by African governments, intended to rate mainly local-currency debt, and launched there on 7 October 2026 (Motsoeneng and Adegoke, 2026; Ojoko, 2026). A rating is useful only if the people not paying for it believe it, and an agency owned by the borrowers’ compatriots starts that argument at a disadvantage.
Capital, more broadly
Debt is the largest item on the sources side and not the only one. Four others belong in the picture, and one of them runs the other way.
Investment is what all of this is meant to produce: gross fixed capital formation, the share of output a country puts into buildings, machines and infrastructure rather than into consumption. It is not a card field, and this chapter declines to print a continental average for it, for the reason Chapter 1 gives about averages assembled from series of very different quality. At country level it is instructive: Morocco invests about a quarter of its output every year and grows at about two and a half percent, which Chapter 28 reads as evidence that its constraint is the return to investment rather than the supply of it (World Bank, 2026e).
Foreign direct investment into Africa was about $70 billion in 2025, down from an exceptional $94 billion in 2024 that a handful of very large transactions had inflated, and still the third-highest level since 1990 (UNCTAD, 2026). The distribution is the story: Egypt took $15.5 billion, the largest recipient for a fourth consecutive year, and after it came Guinea at $7.8 billion, Mozambique at $5.7 billion, Nigeria at $4.0 billion and Ethiopia at $3.8 billion (UNCTAD, 2026). Three of the five are minerals or gas: foreign investment here is still substantially an extractive flow, which matters because it creates a foreign claim on a resource rather than on a wage bill.
Remittances to Sub-Saharan Africa were about $54 billion in 2023, and across low- and middle-income countries they now exceed foreign direct investment; Chapter 8 prices the corridors and Chapter 10 places the flows in the identity (KNOMAD and World Bank, 2024). The balance-sheet point is that a remittance is the one large external inflow that is not a liability: it arrives at a household rather than a ministry, carries no interest, maturity or covenant, and is the most stable flow the continent receives. It is also a claim on somebody else’s labour market, which is why Chapter 10 treats it as the first casualty of a world that stops needing workers.
Aid from the rich-country donors fell 23.1 percent in real terms in 2025, to $174.3 billion or 0.26 percent of their combined national income, the largest annual fall in the history of the series; the American reduction of 56.9 percent drove most of it, bilateral assistance to Sub-Saharan Africa fell 26.3 percent to $29.2 billion, and a further decline is projected for 2026 (OECD, 2026). Set that beside the concessional replenishments above and the shape of the decade appears: the cheapest money on the sources side is shrinking at the moment the most expensive money has become available again, and the temptation is to fill a grant-shaped hole with a bond-shaped instrument.
And the flow that runs the other way. Ndikumana and Boyce estimate that about $2 trillion left the continent as capital flight between 1970 and 2018, or about $2.4 trillion including imputed interest, more than three times the external debt owed at that date, which is the basis of their claim that Africa is a net creditor to the rest of the world (Ndikumana and Boyce, 2021; Ndikumana and Boyce, 2011). The estimate is a residual computed from discrepancies in balance-of-payments and trade data rather than an observation, and it should be quoted as an order of magnitude. Held at that level it survives every reasonable objection and it reframes the chapter. A continent whose private wealth abroad exceeds its public debt does not have a shortage of African capital. It has a shortage of African capital that stays, and the instruments that would keep it, a domestic bond market paying a real return, a court that enforces a security interest, a tax administration that can see a transfer, are the institutions this book keeps arriving at from other directions.
What the evidence says
Six findings, and why none of them is an experiment
Sovereign debt has no randomized trials. Nobody assigns a default by lottery, so the recurring evidence boxes in this book change their name here rather than their standard: the best-identified work available, with what each design can and cannot settle beside it.
Default is a habit rather than an accident. Reinhart and Rogoff (2009) assembled eight centuries of sovereign borrowing and found serial default: countries that have defaulted once default again, and the sequence tracks the global credit cycle more closely than any borrower’s virtue. The design is descriptive and the selection severe, since a country has to have borrowed to have defaulted. What it establishes is that the wall of the 2020s is a phase of a cycle rather than an African peculiarity.
Relief works when it reduces the amount owed. Reinhart and Trebesch (2016) compared relief episodes across a century, from the interwar treatments of advanced economies to the Heavily Indebted Poor Countries initiative, and found that growth, ratings and fiscal indicators improved after relief that cut the face value of the debt and much less after relief that only stretched maturities. That is the sharpest argument against the reprofiling position in the Senegalese debate, from a small number of large episodes rather than from an experiment.
The size of the haircut, not the fact of the default, sets the price afterwards. Cruces and Trebesch (2013) built haircut estimates for 180 restructurings between 1970 and 2010 and found that larger haircuts are followed by higher spreads and longer exclusion. The identification is imperfect, because a country needing a large haircut has problems that would raise its spread anyway. At its weakest it still disciplines the debate: relief has a price, the price is paid in future access, and a government choosing between reprofiling and restructuring is choosing where on that curve to sit.
Half the lending was not in the statistics, and the contracts were drafted to keep it out. Horn, Reinhart and Trebesch (2021) reconstructed Chinese overseas lending from loan-level records and found that roughly half of it did not appear in the standard debt statistics; Gelpern, Horn, Morris, Parks and Trebesch (2021) then read a hundred of the contracts and documented the confidentiality clauses, lender-controlled revenue accounts and undertakings to stay outside collective restructurings. Neither is econometrics. The first is a measurement result on which every debt-sustainability analysis in this chapter depends, and the second cannot say what the clauses did, only what they were for.
The Framework’s own evaluators are not satisfied. Reviews of the Common Framework converge on three findings: the cases took too long, comparability of treatment was never operationalised, and countries that needed the process avoided it because entering it is itself a signal to the market. Two of the three are now in the official record. The G20 endorsed a note on the lessons of the first cases in October 2024 (Group of Twenty, 2024), and the sovereign-debt roundtable the Fund and the Bank co-chair reported in April 2026 that the interval between a memorandum of understanding with official creditors and the bilateral agreements implementing it can be protracted, proposing twelve months as the expectation, and agreed that a debtor should be free to publish the three parameters against which comparability will be assessed, so that a private creditor can see what it is being asked to match (International Monetary Fund, 2026j). The third finding is the critics’, and the arithmetic of applications is the evidence for it: four African applications in the five years since the Framework opened, against twenty-one African low-income countries the Fund’s own dated list puts in debt distress or at high risk of it. That is an evaluation literature rather than an evidence base, and its most useful contribution is the counterfactual it insists on: the comparison for a three-year case is not an instant restructuring but the 1980s, when the same workouts took a decade.
And a test the continent is running on itself. Eichengreen, Hausmann and Panizza (2005) named original sin: the inability of most countries to borrow abroad in their own currency, which converts every exchange-rate movement into a solvency event. The African test of whether it can be escaped is the local-currency bond market, and the record is mixed at best. About 60 percent of African debt issuance in 2024 was still in a foreign currency, against a local-currency share of 43 percent across emerging markets outside China, up from 12 percent in 2000; and of all African local-currency government bonds, only South Africa’s sit in the main emerging-market index a global investor tracks (OECD, 2025). Original sin is not a curse. It is an institution, and it is being escaped very slowly.
Borrowing in two worlds
Chapter 1 asked the reader to hold two worlds at once. In the labour-abundant world the identity is a lever and Africa holds the long end of it: term one is given, and terms two and three are the work. In the labour-redundant world the frontier of production is compute, energy and capital, labour is a complement at best, and income per head depends on who owns the machines and on the terms of trade for what a country has under it (Acemoglu and Restrepo, 2019; Korinek and Stiglitz, 2021).
In the first world, everything above is a story about buying a higher third term. A sovereign borrows to build the port that lets the exporter ship, the grid that lets the plant run and the road that lets the farmer sell, and the test is whether output per worker rose by more than the coupon. Part VI answers that pole by pole. It is also the test on which the 2013 to 2021 cycle is genuinely poor in places, because a good deal of the money financed recurrent spending and refinancing rather than assets, and the sector chapters can rarely point at the thing it bought.
In the second world the question changes shape, and the change is uncomfortable. A creditor lends against a stream of future receipts. When those receipts are a wage bill, the creditor is lending against a labour force and the state’s capacity to pay is its capacity to tax the work its people do. When they are a rent, the creditor is lending against a thing in the ground and the state’s capacity to pay is the price of that thing. The whole of this chapter’s hidden-debt section is about what lending against a rent looks like, and the answer is that it looks like collateral: resource-backed lending is not an aberration of the second world but that world’s default instrument, and Africa has been living with it for fifty years.
Can a state borrow against a labour force at all, when the labour force is not what produces the output? On this chapter’s evidence it can only borrow against what it can pledge, and what a state can pledge is what a creditor can seize or divert: a cargo, a revenue account, a concession. A payroll cannot be diverted, which is one reason a wage-based fiscal system produces a bargaining relationship between a state and its citizens and a rent-based one does not. Chapter 8 makes the monetary version of that argument and Chapter 12 the sectoral one; the balance-sheet version is that the labour-redundant world pushes every African sovereign towards the borrowing terms Angola and Congo-Brazzaville have now and away from the terms South Africa has.
One branch of the second world improves the arithmetic. If the binding constraint on compute turns out to be electricity and minerals rather than chips, then sun, land, copper and cobalt are the collateral of the coming century, and a continent that holds them has something to pledge. That is better than having nothing and it is not what this book’s title describes. A country that borrows against its solar exports to build the transmission line that carries them has done something intelligent; a country that has pledged twenty years of those exports to the firm that owns the data centre has done what Angola did with its oil. The difference is not the instrument but who ends up owning the asset, which is the question Chapters 13, 14 and 32 put in three other sectors and this one puts to the balance sheet.
Data quality
Data quality in this book is a layer rather than a caveat, and a chapter this dependent on one statistical release should say what the release can bear.
The debt statistics behind Table 21.1 are compiled from what borrowing governments report. Three consequences follow. The coverage is general government and its guarantees, so state-enterprise borrowing outside the guarantee perimeter is not in it. The classification is doubled rather than absent: the same guaranteed stock is published both by type of creditor and by the creditor’s country, and the second cut is where the Paris Club and China lines come from. Reading them as a sixth and a fifth slice of one pie is the single most inviting error this table offers, and every chapter that quotes them here says which cut it is quoting. And the numbers are revised, sometimes very largely, when a country reconciles its own records, which is what the Senegalese restatement was.
Four cards carry no external debt stock at all: Libya, Namibia, South Sudan and the Seychelles. Two of the four hold the lowest and third-lowest statistical-performance scores on the continent, South Sudan at 27.1 and Libya at 34.8; South Sudan has never run a labour-force survey and carries no computable confidence flag, and Libya’s last was in 2012. The countries whose debt is least visible are the countries whose everything is least visible, and a continental total from fifty cards is a total for the fifty that report.
The bond line needs its own warning. It is the debt statistics’ own bondholder category rather than a count of Eurobonds, so it is not the outstanding face value of a country’s international issues, and the field that would carry that face value is empty on all fifty-four. The reason is worth stating exactly, because it is not the usual one. A register naming every African sovereign bond issue by issuer does exist, covers all fifty-four countries and more than fifty thousand instruments, and is built from prospectuses; it is licensed for non-commercial use only, and a book that may one day be sold cannot build a column on it. So the field stays empty by choice rather than for want of a source, on the same rule that took the vehicle-production tables out of Chapter 15. Every statement here about issuance, coupons, spreads and maturities therefore comes from a named outside source, and the profile in Figure 21.3 is a reported magnitude rather than a measured series.
The five-year service total in the section above is the partial exception, and its limits should be as clear as its usefulness. It is publicly guaranteed debt only, so it misses the short-term paper and the unguaranteed borrowing that together are two fifths of the stock; it is a projection on debt already outstanding, so it will be wrong the moment anyone borrows or prepays; and it is one number rather than five, so the card cannot say which year is worst. What the card will support is the magnitude and its distribution across countries. What it will not is the year-by-year shape, which is what a wall actually is.
Finally the commitment record, which counts loans signed between 2000 and 2024 to forty-nine governments, compiled from public reporting and contract records rather than from the borrowers. It is a cumulative flow, and it cannot be added to a stock, divided into one or subtracted from one; the book draws the two beside each other, on this site’s debt tracker and in Figure 21.1, so that no reader is tempted to do any of the three.
Connections to Other Chapters
- Chapter 1 (Africa in Numbers) sketches the balance-sheet lens this chapter develops and states the two worlds its penultimate section applies to borrowing; Chapter 4 (The Case and the Counter-Case) makes the balance sheet its fourth objection, which this chapter prices.
- Chapter 8 (Money) owns the currency regimes and fiscal dominance; Chapter 16 (Finance and Fintech) owns the banks and pension funds holding the domestic debt this chapter’s external tables cannot see; Chapters 12 and 13 own the rents that resource-backed lending is secured on.
- Chapters 24 to 31 (the growth poles) carry the cases: the bonded West African coast and Ghana’s two exchanges in 24, South Africa’s private-creditor stock and Mozambique’s tuna bonds in 25, Kenya’s 2024 refinancing and its railway debt in 26, Ethiopia’s default and Djibouti’s moratorium in 29, Zambia’s restructuring and Angola’s oil-collateralised borrowing in 30, and Congo-Brazzaville’s prepayments in 31.
- Chapter 32 (China in Africa) reconciles the two ledgers this chapter draws apart, Chapter 33 carries the Gulf, and Chapter 34 (Climate Finance) asks whether the adaptation and transition instruments are additional or the same debt with a label.
- Chapter 37 (The Investor’s and Policymaker’s Playbook) carries the Eurobond Africa-premium exhibit, which asks whether African sovereigns pay more than their fundamentals justify; this chapter cites it forward rather than pre-empting it.
- See also: Chapter 19, Section 11, on the gap between a published infrastructure priority and a claim a balance sheet can hold, and the UNGA Week 2026 field notes behind that stitch. A remittance line on this chapter’s cards is a household inflow, not equity in a PIDA project.
Discussion Questions
The four cards with the lowest external debt ratios are Algeria at 2.4 percent of output, Equatorial Guinea at 9.8, Botswana at 11.9 and the Democratic Republic of the Congo at 13.4. For each, say whether the low ratio is prudence, exclusion, or a resource large enough that borrowing was unnecessary, and name the evidence that would distinguish them. Then say which of the four you would rather be, and why the answer depends on what you think the next twenty years require.
Senegal’s government has argued for a reprofiling rather than a restructuring: longer maturities, no reduction in face value, and no formal default. Reinhart and Trebesch (2016) find that only face-value reduction moves growth and ratings; Cruces and Trebesch (2013) find that larger haircuts are followed by higher spreads and longer market exclusion. Set the two findings against each other, decide what you would advise, and be explicit about whose welfare over what horizon your advice maximises.
Afreximbank claims preferred creditor status; Ghana and Zambia, under pressure from their official creditor committees, treated its loans as ordinary claims. Construct the strongest case on each side. Then answer the question the dispute actually poses: if African states own the bank, and African states are the borrowers, who should bear the loss, and what does your answer imply about whether an African-owned multilateral can be a lender of last resort to its own shareholders?
Try It
Open the Sovereign Debt Tracker at the debt page and read three countries in this order: Angola, Ethiopia and Kenya. Angola has the largest Chinese commitment record on the continent and a stock dominated by private credit; Ethiopia has the second largest and a stock dominated by multilateral and bilateral lending; Kenya has the third and a stock dominated by multilateral lending. For each, set the height of the bilateral column against the Chinese commitment figure beside it, and note that the China line inside the creditor breakdown is drawn as a blank rather than a zero. Then switch to the China view and rank all fifty-four. Write one paragraph on a single question: advising a bondholder committee in a restructuring of one of these three, which of the two numbers on the page would you use to size the official-sector claim you are being asked to be comparable with, and what would you demand to see before agreeing to anything?
Then open Balance-Sheet Africa at the balance page, which lays the same cards out as sources and uses of funds, and put the continent on the screen first. Read the count the page prints beside each total before you read the dollars: it is the first column of Table 21.1, and it is the column that decides what a continental balance sheet means. Now switch the page to percent of output and take Mozambique, Senegal and Zambia in turn, the three of Table 21.2 this chapter says are three different stories. For each, set the debt stock against the five-year service bar, and both against the remittance, investment and aid bars that came in this year; note that the Chinese commitment bar is drawn apart from the service bar rather than under it, and that the Paris Club and China lines sit in their own block rather than beside the three that add up. Write one paragraph answering the question Table 21.2 cannot: which of the three has a financing problem and which has a repayment problem, and which line on the page told you?
Data Exercise
Download all fifty-four cards from the country cards page on this site, as cards.csv or as cards.json. Build a table with balance_sheet.external_debt_stock, all six fields under balance_sheet.external_debt_by_creditor, balance_sheet.debt_service_2026_2030, balance_sheet.china_loan_commitments_cumulative, scale.gdp_usd and data_quality.confidence_flag. Then do five things. First, reproduce Table 21.1: sum multilateral, other_bilateral and other_private across the cards that carry them, confirm they come to the $707.9 billion of publicly guaranteed debt the table reports, and confirm that eurobond is a subset of other_private on every card rather than a line beside it. Second, sum paris_club and china, confirm that they are 25.4 percent of that same $707.9 billion, and then add all six lines together and see what happens: the $1,080 billion you get is the reason the table is laid out in two blocks. Say in two sentences why a lender’s country and a lender’s type are different classifications. Third, compute external debt as a percentage of output for every card carrying both, rank them, and confirm the median and the ten countries above the sixty-percent line. Fourth, compute the Chinese commitment record as a percentage of output and test whether it predicts the debt ratio: you should find a correlation near zero, and should then write two sentences on why the two are different objects, one a cumulative flow of signings over twenty-five years and the other a stock outstanding at one date. Fifth, rank the cards by debt_service_2026_2030 over gdp_usd, confirm the median of 12.1 percent and the eight countries above a fifth of output, and say which of those eight you would want an Article IV report on first. Never impute a null as a zero: eurobond_outstanding and all three sovereign_ratings fields are empty on every card, collateralized_or_resource_backed is filled on eleven and blank on forty-three where blank means unrecorded rather than none, and restructuring_status is blank on Senegal alone and deliberately so.
Data Sources and Further Reading
Key data sources
- World Bank International Debt Statistics, 2025 release: the external debt stock and its creditor composition on 50 of the 54 cards. Compiled from debtor reporting, covering general government and guaranteed debt, classified by creditor type rather than by creditor, and revised when a borrower reconciles its records.
- Boston University Global Development Policy Center, Chinese Loans to Africa database, 2000 to 2024 release: cumulative loan commitments to 49 African governments. A flow of signings, not a stock, and not additive to anything in the debt statistics.
- IMF World Economic Outlook, April 2026 for output; the Regional Economic Outlook: Sub-Saharan Africa, Article IV reports and debt sustainability analyses, cited by country, for programme terms, restructuring timetables and distress ratings; and the Debt Sustainability Framework for Low-Income Countries, whose ratings are computed on reported debt, which is the limitation the hidden-debt section is about.
- G20 and the Paris Club for the Debt Service Suspension Initiative, the Common Framework and the Global Sovereign Debt Roundtable’s notes on process.
- OECD Development Assistance Committee for aid flows and the 2025 decline, and the OECD Africa Capital Markets Report for local-currency bond markets; UNCTAD World Investment Report for foreign direct investment; World Bank and KNOMAD for remittances.
- National ministries of finance and audit institutions, cited by name: Ghana’s Ministry of Finance for both exchanges, Senegal’s audit court for the restatement, Kenya’s National Treasury for the Finance Bill, South Africa’s National Treasury for guarantees.
- The country cards, whose balance-sheet block carries the stock, the three creditor lines by type with the bond line inside the private one, the two lines by creditor country, the five-year debt-service total, the restructuring status, the commitment record and the three flow lines; the Eurobond amount outstanding and the three ratings are empty on all fifty-four, for the reasons given in Section 1, and the collateralisation flag is carried only where a published register reports it.
Further reading
- Carmen Reinhart and Kenneth Rogoff, This Time Is Different (2009), for eight centuries of serial default, and Reinhart and Trebesch (2016) for what debt relief has and has not done.
- Sebastian Horn, Carmen Reinhart and Christoph Trebesch, “China’s Overseas Lending” (2021), for the measurement result the rest of the literature rests on, with Deborah Brautigam (2020) for the corrective to the debt-trap framing, and Anna Gelpern and co-authors, “How China Lends” (2021), for what is in the contracts.
- Juan Cruces and Christoph Trebesch, “Sovereign Defaults: The Price of Haircuts” (2013), for the price of relief in future market access.
- Natural Resource Governance Institute, Resource-Backed Loans: Pitfalls and Potential (2020), for the only systematic count of the instrument.
- Léonce Ndikumana and James K. Boyce (2021), Capital Flight from Africa, and Africa’s Odious Debts (2011), for the flow that runs the other way and for the argument that Africa is a net creditor.
- Gregory Smith (2021), Where Credit Is Due, for how African sovereigns actually borrow, written by somebody who has sat on the sell side of it.