32. China in Africa
The country cards record $176.3 billion of Chinese loan commitments to 49 African governments between 2000 and 2024, and $82.2 billion of Chinese debt still outstanding across 46 of them. The two numbers are both right and they are not comparable: the first counts facilities signed over twenty-five years, some never drawn and many long repaid, and the second is a balance owed on one date. Their ratio, 2.1 to 1, is the most-quoted statistic in this subject reduced to arithmetic, and the space between them is where most of the argument about China in Africa has been conducted. On twenty of the forty-six cards carrying both a commitment record and an official bilateral column, the loan-level record for one lender is larger than the entire official column, every government creditor in the world added together. This chapter is about the largest bilateral economic relationship on the continent, and about why the two halves of that opening sentence come from ledgers built for different purposes and answering different questions.
Learning Objectives
After reading this chapter, you should be able to:
- Name the three ledgers that count Chinese finance in Africa, say what each one counts, and explain why a commitment is a flow, a stock is a stock, and no arithmetic converts one into the other.
- Reproduce the reconciliation at the centre of this chapter: the loan-level commitment record set beside the official bilateral creditor column, country by country, and say what the gap does and does not establish.
- Narrate the cycle in order: the founding of the Forum on China and Africa Cooperation in 2000, the resource-backed model of the commodity super-cycle, the commitment peak of 2016, the collapse to 2022, and the smaller and more selective lending that followed.
- Describe the relationship’s other five channels, trade, construction, investment, people and diplomacy, at the right magnitudes, and say which of them is measured well and which is measured by assertion.
- Say what the relationship becomes if the frontier of production stops needing workers, and why the answer turns on who owns the machines rather than on who lent for them.
What this chapter counts
This is the third book in a series whose second volume was about the Chinese economy (Wilse-Samson, 2025), and a reader who has met that book will not find its material here. The subject is not China. The subject is a relationship, treated as a system with six channels, taken in descending order of how well they can be measured: finance, trade, construction, investment, people and diplomacy. The first can be counted three ways that disagree. The last can be counted in communiqués.
Where does the relationship sit in the book’s identity? GDP growth is approximately the growth of output per worker, plus the growth of the employment-to-working-age ratio, plus the growth of the working-age population, and all three are growth rates. China appears in none of those terms directly and enters almost entirely through the third: a railway, a port, a dam, a transmission line and a telecommunications network are all attempts to buy a higher output per worker, and for twenty-five years a very large share of the African attempts were financed, built or equipped by Chinese institutions. The second term is where the argument gets interesting, because the same relationship is accused of subtracting from it, through contractors who bring their own senior staff and manufactures that compete with the African firms that would have employed people. The identity does not settle that argument. It puts the two claims in the same equation, where they can be weighed against each other.
One warning before the counting starts. Almost every quantity in this chapter comes from a compiler rather than from a counterparty. Neither government publishes a loan-by-loan account of what has been lent and what remains outstanding; the borrowers report to the international debt statistics in a format that cannot show a creditor’s name, and the lender publishes aggregates that do not decompose. What exists instead is three research databases assembled by outsiders from contracts, press reporting, budget documents and, in the best cases, the loan agreements themselves. That is a remarkable achievement of scholarship and it is not the same thing as a statistical series.
The reconciliation
Three ledgers, counting three different things
The first ledger is the official debt statistics, compiled by the World Bank from what borrowing governments report. Chapter 21 sets out its limits: it covers general government and guaranteed debt, and is revised whenever a borrower reconciles its records. It records a stock, the amount outstanding at one date, which is the number a debt sustainability analysis needs.
It does have a China line, and getting at it is the point of this section. The headline creditor split, into multilateral, bilateral and private, classifies by the kind of institution that lent, and Chinese lending is distributed across all three of its columns: a China Eximbank loan to a finance ministry is bilateral, a China Development Bank facility is private, and a contractor’s supplier credit is private too. Underneath that split the same statistics publish a second one, by the country the creditor is resident in, and it is that table the cards read: $82.2 billion owed to creditors in China across 46 countries, which is 11.6 percent of Africa’s publicly guaranteed external debt and 84 percent of what the twenty-two members of the Paris Club are owed. On twenty-six of the forty-six cards carrying both lines, China is owed more than the entire Club.
Two cautions about that number, both of which the rest of the chapter uses. It is a country and not a lender, so it collects the policy banks, the commercial banks and the exporters together, which is the right unit for a restructuring and the wrong one for a question about who decided. And because it cuts across the type split, it can be larger than the bilateral column it looks as though it should sit inside: in the Republic of the Congo the China line is $3.0 billion against a bilateral column of $2.3 billion, in Zambia $5.3 billion against $4.8 billion, and in Angola $14.4 billion against $4.1 billion. Never add the China line to the bilateral column. The classification is not a conspiracy either way; it is what a reporting form designed in the 1970s produces when the creditor landscape changes underneath it, and what a second table published alongside it can partly repair.
The second ledger is the Chinese Loans to Africa database, begun at Johns Hopkins and maintained since 2021 at Boston University, which is where the $176.3 billion at the head of this chapter comes from. It counts loan commitments: facilities signed, with a date, a borrower, a lender and an amount. Its 2000 to 2024 release records 1,319 commitments worth about $181 billion, of which $176.3 billion is attributed to 49 named governments and the remainder to regional borrowers such as development banks (Boston University Global Development Policy Center, 2025). Five countries have no record in it at all: Guinea-Bissau, Libya, Somalia, São Tomé and Príncipe and Eswatini. Four of those five are states in which no Chinese lender would have wanted to sign a facility; the fifth, Eswatini, is the only African country that recognizes Taipei rather than Beijing, and the section on politics below returns to it.
The third ledger is AidData’s Global Chinese Development Finance dataset, which counts projects rather than loans and includes the grants, export credits, rescue lending and borrowing by state-owned enterprises and special-purpose vehicles that the other two miss (Malik, Parks, Russell and Goodman, 2021). Its central contribution is to insist that a great deal of Chinese overseas finance never touches a sovereign balance sheet and is therefore invisible to both other ledgers; its follow-up report documents the shift towards shorter, more heavily collateralised and more commercially priced lending, and towards rescue finance for borrowers already in trouble (AidData, 2023a).
Now the sentence the rest of this section exists to defend. A commitment is a flow and a stock is a stock. A commitment is a promise to lend, dated at signature; some are never drawn, some drawn in part, some repaid over twenty-five years, some rescheduled, and some contracted by a state-owned company outside the government’s debt perimeter. A stock is what remains owed on one day. The two cannot be added, differenced or divided into one another, and a good deal of published commentary does all three. The country cards carry both, deliberately, and draw them apart.
The exhibit
| Line | Cards carrying it | Total ($bn) |
|---|---|---|
| Chinese loan commitments, 2000 to 2024 | 49 | 176.3 |
| Debt outstanding to creditors in China | 46 | 82.2 |
| Official bilateral debt outstanding, all creditor countries | 50 | 148.7 |
| Debt outstanding to the 22 Paris Club members | 50 | 97.3 |
| Cards carrying both a commitment record and a China line | 45 | commitments 174.5 against outstanding 82.0 |
| Cards on which commitments exceed the outstanding balance | 43 | median ratio across the 45, 1.9 to 1 |
| Cards on which the commitment record exceeds the whole bilateral column | 20 | |
| Cards on which the China line exceeds the whole bilateral column | 4 | Angola, Congo-Brazzaville, Guinea, Zambia |
| Cards on which the commitment record exceeds the whole external debt stock | 2 | Eritrea and Equatorial Guinea |
Table 32.1. Billions of US dollars. The first row is a cumulative flow of loans signed over twenty-five years; every other row is a stock outstanding at one date. Rows two, three and four are all publicly guaranteed long-term debt, but rows three and four classify it by the kind of institution that lent and row two by the country the lender sits in, so row two overlaps rows three and four rather than nesting inside either, and adding them is meaningless. Three cards carry a commitment record and no bilateral column: Namibia, South Sudan and the Seychelles. Four countries report debt but no Chinese line at all: Botswana, Guinea-Bissau, Somalia and São Tomé and Príncipe. Sources: World Bank International Debt Statistics, 2025 release, and the Boston University Chinese Loans to Africa database, 2000 to 2024 release, both via the country cards.
The two-to-one ratio at the top of the chapter is a continental average and it hides the interesting cases. On forty-three of the forty-five cards carrying both, commitments exceed the balance outstanding, which is what twenty-five years of signing and repaying should produce; across all forty-five the median ratio is 1.9 to 1. Two cards run the other way. Algeria’s outstanding Chinese debt is more than its recorded commitments, and the Democratic Republic of the Congo’s is almost exactly equal to them, which on a country whose defining Chinese facility is a minerals-for-infrastructure joint venture is the more informative of the two results. At the other end, Sierra Leone’s commitments are thirteen times its outstanding balance and Sudan’s nearly seven times, which is what a lending relationship looks like after it stops.
And the balance outstanding, unlike the commitment record, can be put against the rest of what a country owes. The median card owes 8.0 percent of its publicly guaranteed external debt to creditors in China. Six owe more than a third of it: Equatorial Guinea 92.6 percent, Congo-Brazzaville 55.7, Djibouti 50.5, the Democratic Republic of the Congo 44.4, Guinea 40.3 and Zimbabwe 37.8. That is the list a restructuring negotiator would want, and it is not the list of the largest borrowers: Angola, with much the largest absolute exposure, is eighth at 31.2 percent.
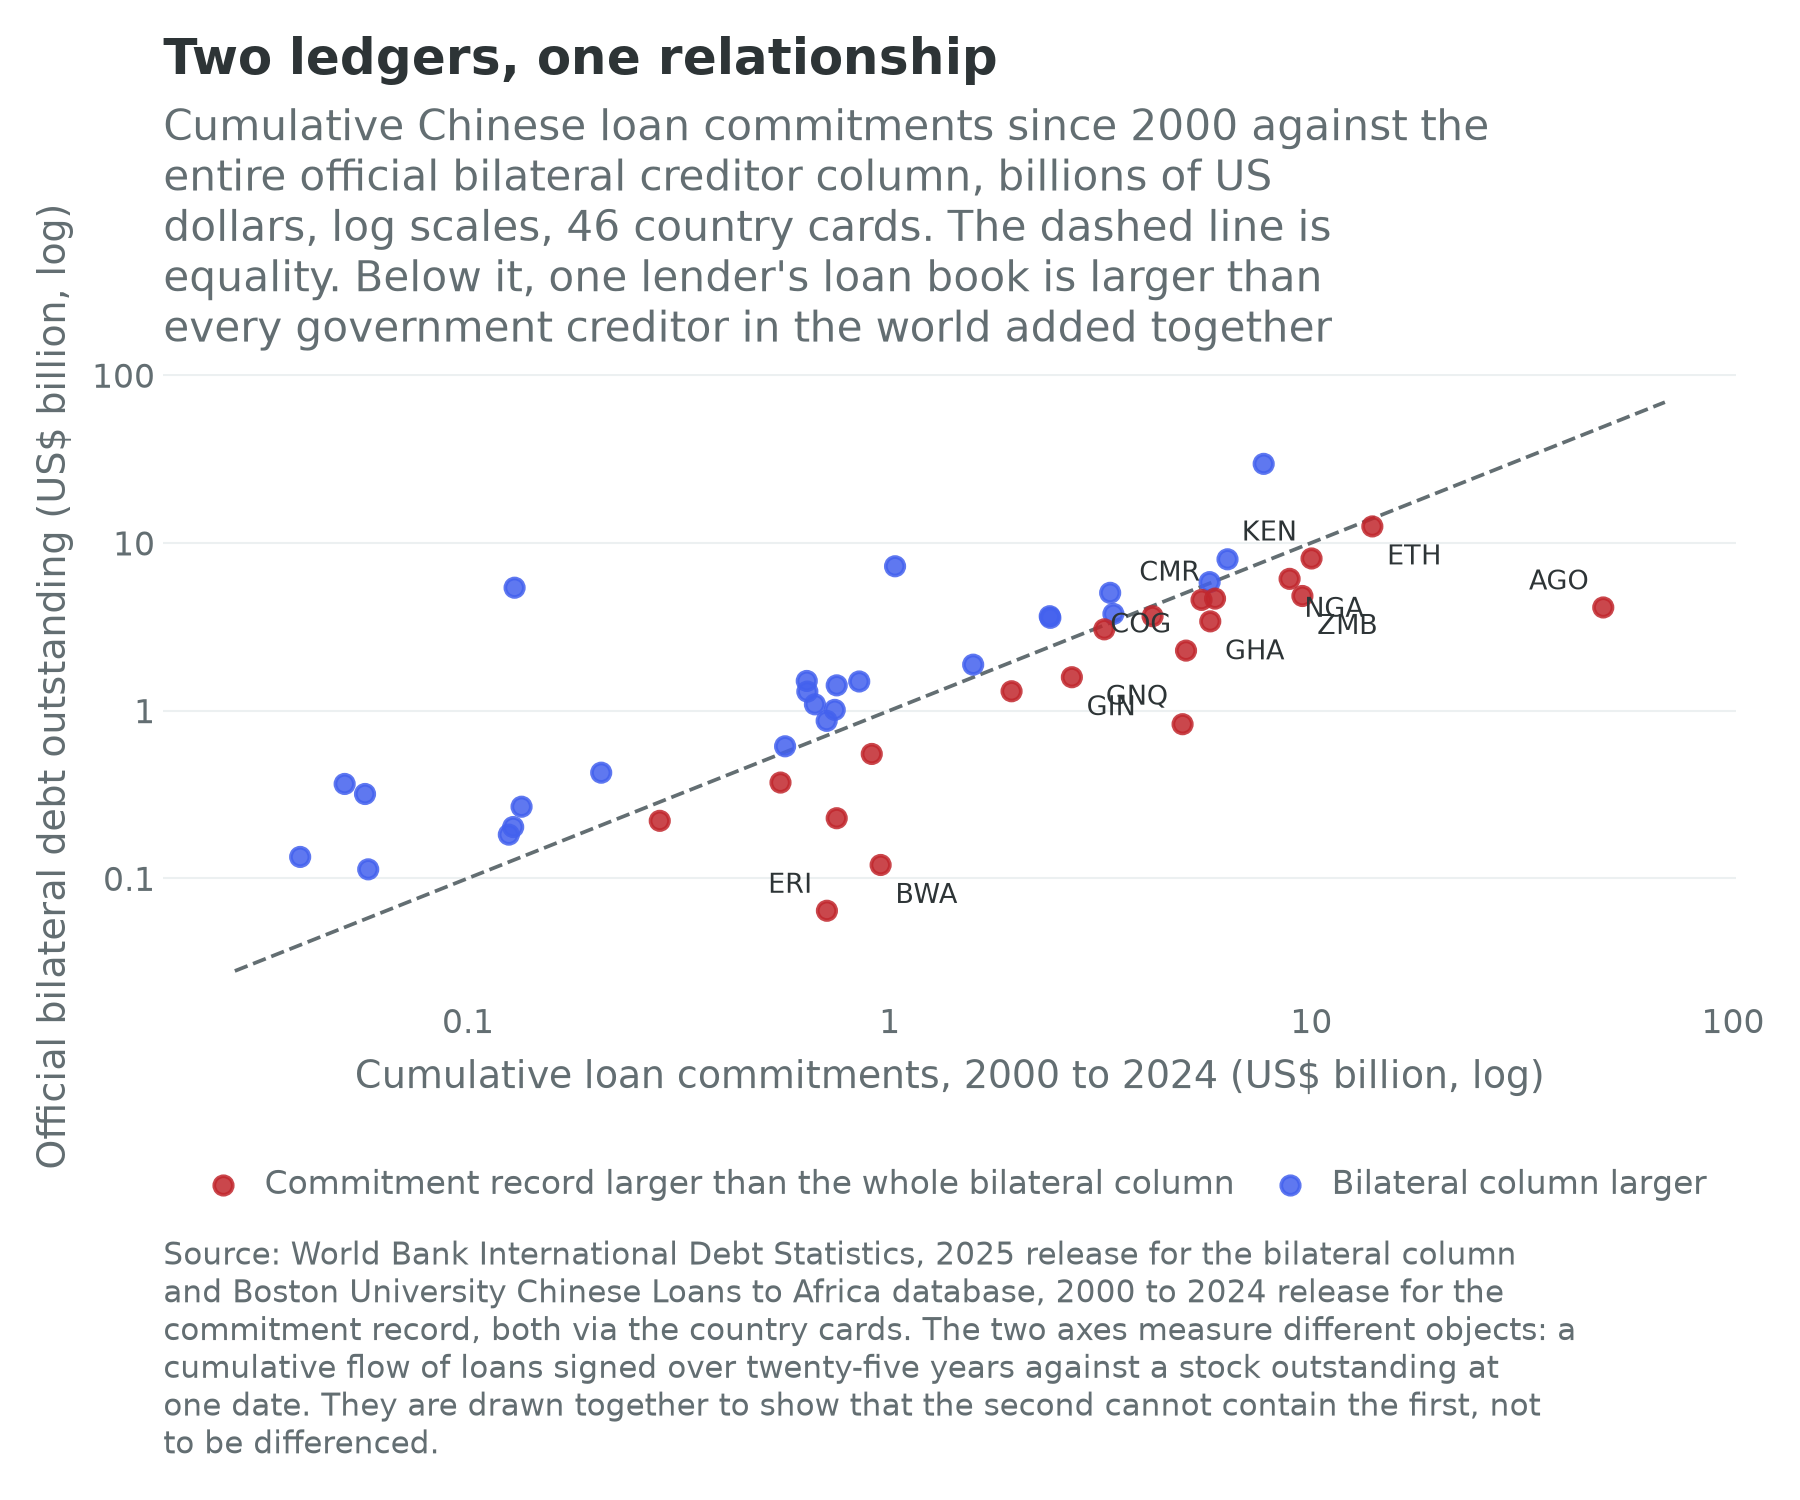
Read the figure from the bottom right, where the gap is widest, and then work back.
Angola is the extreme case and it is extreme by an order of magnitude. Its commitment record is $49.2 billion, 27.9 percent of the continental total, against an official bilateral column of $4.1 billion: the recorded loan book is twelve times the whole column. The database records 271 separate commitments to Angola alone, more than a fifth of the 1,319 in the whole release (Boston University Global Development Policy Center, 2025). Chapter 30 explains how it was secured: oil-collateralised facilities repaid in barrels through offshore accounts, contracted in large part by or through the state oil company, which is exactly the structure that lands in the other-private column rather than the bilateral one. Angola’s card shows $35.8 billion under other private credit against $4.1 billion bilateral, and that asymmetry is the single most informative pair of numbers in this chapter.
The other large gaps are the corridor borrowers. Zambia’s commitment record of $9.5 billion sits against a bilateral column of $4.8 billion; Nigeria’s $8.9 billion against $6.1 billion; Congo-Brazzaville’s $5.0 billion against $2.3 billion; Ghana’s $5.8 billion against $3.4 billion; Kenya’s $10.0 billion against $8.1 billion; Ethiopia’s $14.0 billion against $12.5 billion; Cameroon’s $5.9 billion against $4.6 billion. The twenty countries in full, ranked by the dollar gap, are Angola, Zambia, Equatorial Guinea, Nigeria, Congo-Brazzaville, Ghana, Kenya, Ethiopia, Cameroon, Guinea, South Africa, Botswana, Eritrea, Gabon, Uganda, Sierra Leone, Togo, Zimbabwe, Malawi and Lesotho.
Two cards fail a harder test. Eritrea and Equatorial Guinea carry commitment records larger than their entire reported external debt stock, of any kind, to anyone; Eritrea’s margin is slight, and Equatorial Guinea’s is $5.0 billion of commitments against a stock of $1.2 billion. Neither result is arithmetically impossible, because twenty-five years of signings can exceed a present balance if the loans have been repaid or were never drawn. Both are the kind of result that ought to prompt a question, and in Equatorial Guinea’s case the question is well known: an oil state whose reported external debt is $1.2 billion against output of $12.5 billion, whose recorded Chinese commitments are 39.7 percent of a year’s output, whose statistical performance score of 32.1 is the second lowest on the continent and whose confidence flag is low, is either exceptionally prudent or exceptionally poorly reported.
And the exceptions matter as much as the cases. Egypt’s commitment record of $7.7 billion sits inside a bilateral column of $29.6 billion, because Egypt’s bilateral creditors are overwhelmingly in the Gulf, and the same holds on smaller numbers for Tanzania, Senegal and Mozambique. Djibouti, which the reader may expect at the top of the list and which Chapter 29 treats as the most Chinese-financed balance sheet in the book, is not among the twenty at all: its commitment record of $1.6 billion is smaller than its bilateral column of $1.9 billion. It is nonetheless the second most exposed card on the continent by the ratio that matters for a small economy, with commitments equal to 36.0 percent of a year’s output, behind Equatorial Guinea at 39.7 percent and ahead of Angola at 34.7, Eritrea at 34.4, Zambia at 33.0 and Congo-Brazzaville at 32.4, against a continental median of 4.9 percent. The gap between two ledgers and the weight of a relationship are different quantities, and a country can be heavy on one and light on the other.
What the gap does and does not establish
It establishes that the official statistics cannot bear the weight commentary puts on them. A bilateral column smaller than one creditor’s recorded loan book to the same government is counting a smaller universe, a later date, or both, and in every case the difference is unexplained by anything a reader can see.
It does not establish concealment, and the distinction is the whole of the professional literature. Horn, Reinhart and Trebesch (2021) built the case at the global level: reconstructing Chinese overseas lending from loan-level records, they found that China had become the world’s largest official creditor and that roughly half of its lending to developing countries did not appear in the standard debt statistics. That is a measurement result about coverage, not a finding about intent, and it is the result on which every debt sustainability analysis in Chapter 21 quietly depends.
Gelpern, Horn, Morris, Parks and Trebesch (2021) supply the contractual half. Reading a hundred Chinese loan contracts with twenty-four governments, most never published, they document three recurring features: confidentiality clauses barring the borrower from disclosing the terms and sometimes the existence of the debt; lender-controlled offshore revenue accounts giving the creditor first claim on a stream of receipts; and undertakings to keep the debt outside any collective restructuring, the so-called no-Paris-Club clauses. Those clauses are the mechanism by which a loan can be legally contracted and statistically invisible at the same time, and they explain the coverage gap without requiring anybody to have lied to a statistician. They also attempt by contract what seniority normally requires an institution to confer. Whether such a clause would survive a court has not been tested; its effect is to narrow a sovereign’s options before it is distressed.
What no ledger can say is the number a finance minister actually needs: how much is outstanding, to whom, falling due when. That number exists in two places, a Chinese lender’s loan book and a borrowing government’s own records, and is published in neither.
The cycle
2000, and the machine that was built
The Forum on China and Africa Cooperation, in Chinese Zhong-Fei hezuo luntan, met for the first time in Beijing in October 2000, and has met every three years since, alternating between China and an African capital. It matters less as a summit than as a mechanism. Each meeting produces a three-year action plan and a headline financing figure, and the figure then organizes the behaviour of the ministries, the policy banks and the state contractors for the following three years. The instrument set was already in place: the zou chuqu, or “going out”, policy of 1999 had directed state-owned firms to invest abroad, and the export-import bank’s youhui daikuan, the concessional loan carrying a subsidized rate, gave the contractors a financing product to sell alongside the construction. The Belt and Road Initiative, yidai yilu, announced in 2013, supplied the framing and the word that became shorthand for the whole enterprise, hulian hutong, connectivity.
What followed rode the commodity super-cycle. African resource exporters had rising revenues and rising creditworthiness, Chinese firms had capacity and a mandate to use it abroad, and the two met in an instrument that solved a problem for both: the resource-backed loan, disbursed to a Chinese contractor rather than to the borrowing treasury and repaid out of export receipts routed through an account the lender could see. Chapter 30 calls this the Angola mode. Its appeal to a government emerging from war with no credit history and no functioning procurement system is easy to underrate: it converted a resource in the ground into a road above it, without a rating, a bond prospectus, or a multilateral project cycle that takes four years.
2016, and the turn
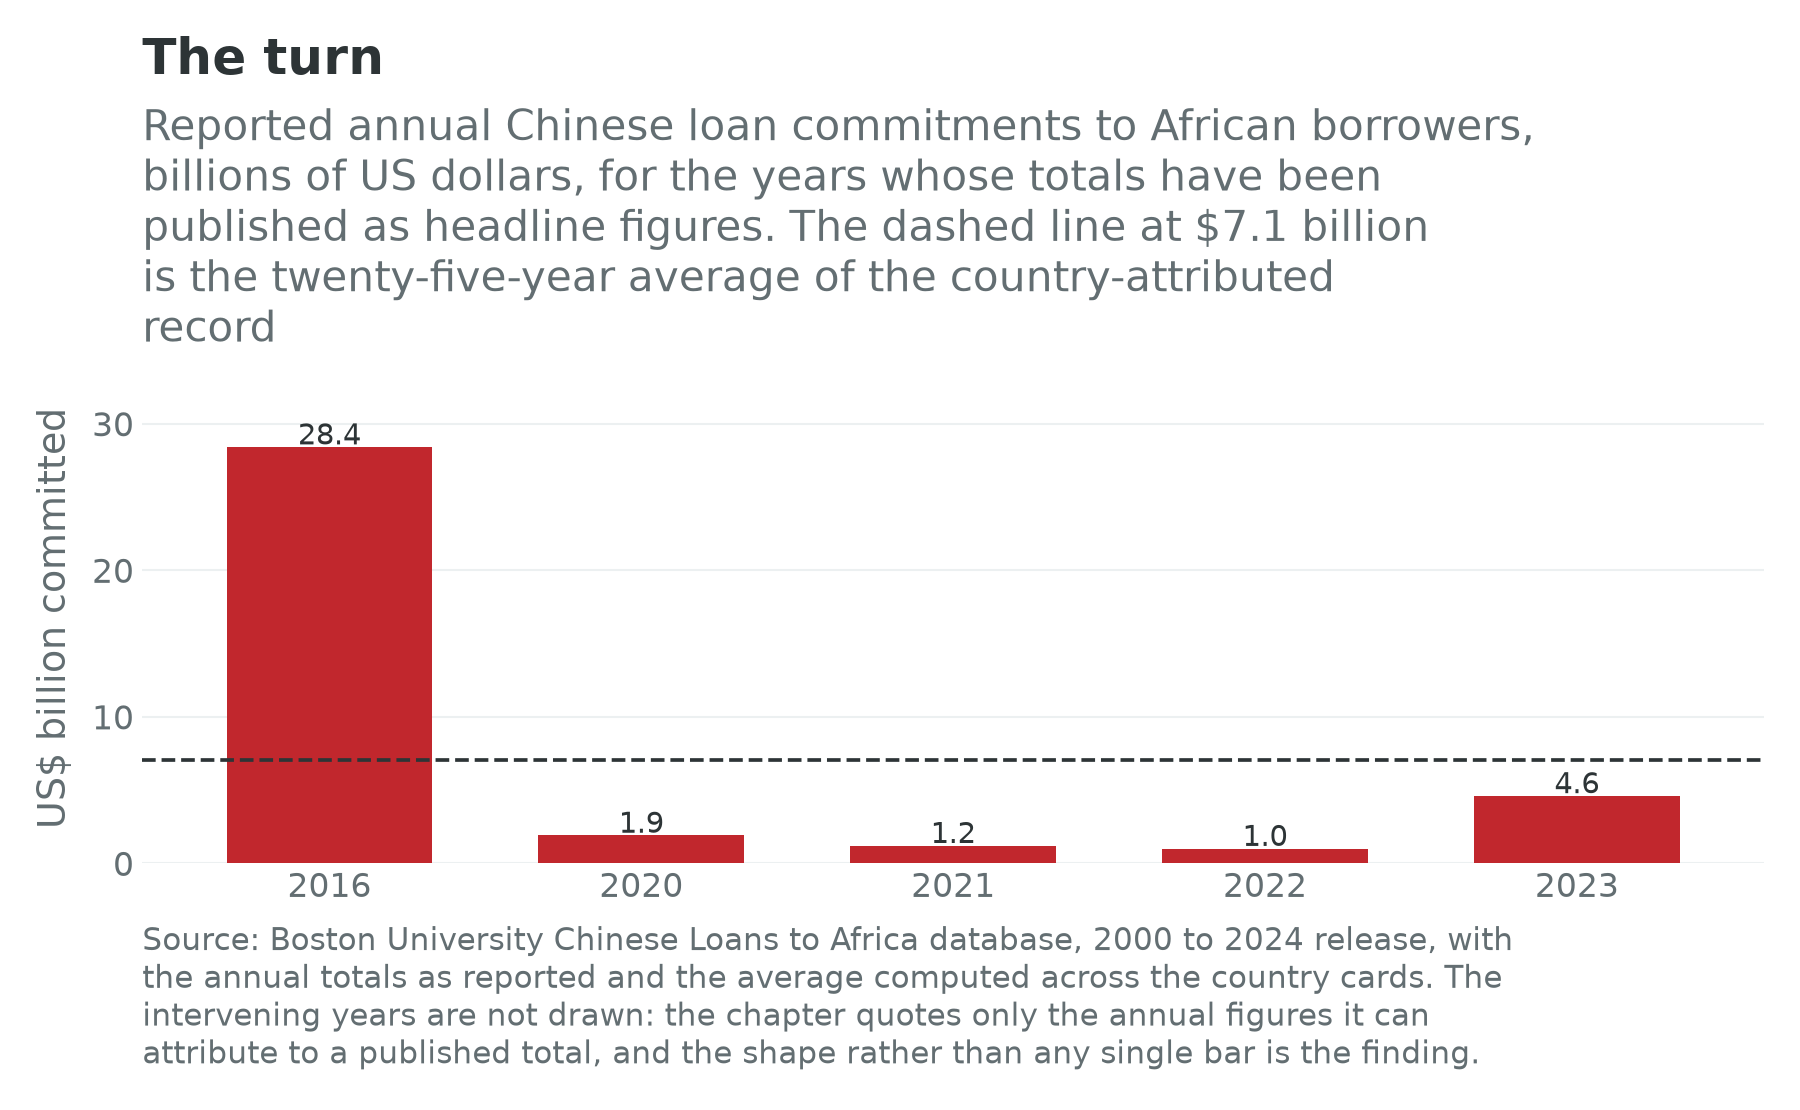
Commitments peaked in 2016 at about $28.4 billion, four times the twenty-five-year average of the country-attributed record, and then fell for six consecutive years to under $2 billion in 2020, about $1.2 billion in 2021 and under $1 billion in 2022, the lowest annual total in the series (Boston University Global Development Policy Center, 2025). Lending recovered to about $4.6 billion in 2023, the first increase in seven years, and stayed at a similar order in 2024 (Boston University Global Development Policy Center, 2025). A relationship that was signing tens of billions of dollars of loans a year now signs a few billion. That is not a slowdown; it is a different business.
Four things caused it, and they are usually collapsed into one.
The first is that the borrowers stopped being creditworthy. The commodity price collapse of 2014 to 2016 hit exactly the resource exporters the model depended on, and by 2020 several of the largest recipients were in or near distress. A lender that has written off nothing yet is still a lender whose credit committee has stopped approving.
The second is domestic. The Chinese policy banks answer to a system that reassessed the risk of overseas lending after 2017, tightened approval for large sovereign exposures, and had a property and local-government debt problem of its own. Capacity did not vanish; the appetite for concentrated, long-dated, unsecured sovereign risk did.
The third is a change of doctrine, announced rather than inferred. From 2021 the official language shifted to xiao er mei, “small and beautiful”: fewer megaprojects, more work in agriculture, health, vocational training and digital infrastructure, with tighter debt-sustainability screening and a preference for co-financing and equity over sovereign credit. Whether the doctrine caused the retreat or described it is genuinely open, and the honest reading is that it did some of both.
The fourth is that the instruments changed. Sovereign lending gave way to commercial lending on shorter tenors, to equity stakes in projects Chinese firms would previously have built on credit, and to central-bank swap lines: Nigeria’s naira, ₦, swap arrangement with the Chinese central bank, first agreed in 2018 and renewed in December 2024 at 15 billion renminbi, is the clearest African instance, a liquidity facility rather than a development loan (People’s Bank of China, 2024). Equity stakes and swap lines do not appear in a loan database, so part of the measured decline is a change in what the measurement can see.
2024, and what was pledged
The ninth forum met in Beijing in September 2024 and produced the largest headline figure in its history: 360 billion renminbi, about $51 billion, over three years, of which roughly 210 billion renminbi is credit lines, roughly 80 billion is assistance including grants and interest-free loans, and at least 70 billion is investment by Chinese firms rather than money from the state at all (Forum on China and Africa Cooperation, 2024). A pledge of which more than a fifth is a hope about corporate behaviour is a different object from one that is entirely a loan facility, and the shift is the “small and beautiful” doctrine expressed in a communiqué.
The same meeting made the most consequential single announcement of the decade for African exporters, and it was a trade measure rather than a finance one: zero-tariff treatment on all tariff lines for the least-developed African countries with diplomatic relations, extended in 2025 to all fifty-three African countries that have them (Forum on China and Africa Cooperation, 2024; Ministry of Commerce of the People’s Republic of China, 2025). The section on trade below asks what it is likely to be worth.
Distress, and the debt-trap argument
What China does when a borrower cannot pay
The Common Framework cases of Chapter 21 are the first occasion on which the answer had to be given in public and in committee, and the pattern has two parts.
The first is institutional. China’s official creditor in these negotiations is the export-import bank, which sat as co-chair of Zambia’s official creditor committee alongside France, an arrangement that would have been unimaginable a decade earlier and that worked, slowly. The complication is the China Development Bank, which lends at commercial rates and has argued that its claims are commercial rather than official and therefore belong with the bondholders rather than in the official committee. That is not an unreasonable position, since the bank’s pricing is commercial; it is also a position that, generally accepted, shrinks the official pool and raises the haircut on everybody else. Zambia’s case turned partly on it, and Chapter 30 tells the outcome.
The second is behavioural and predates the Framework. The characteristic Chinese response to a borrower in difficulty has been a bilateral reprofiling agreed quietly: maturities extended, grace periods granted, arrears capitalised, face value untouched. Djibouti’s is the clearest documented instance in this book, a moratorium agreed in October 2023 on the railway and water-pipeline loans, and Ethiopia’s railway debt was extended from ten years to thirty in 2018 and 2019; Chapter 29 gives both. That is what a rescheduling actually looks like, and it does not resemble the thing the debt-trap literature describes.
The debt-trap narrative, and the evidence against it
The claim, in its strong form, is that Chinese lenders deliberately extend loans a borrower cannot repay in order to seize the collateral asset. It is worth stating plainly because it is repeated constantly and because the evidence for it is thin to the point of absence.
Brautigam (2020) traced the phrase to its origin in a 2017 opinion piece and showed how it hardened into a premise. The single case on which the whole edifice rests is Hambantota, in Sri Lanka, where a loss-making port was leased to a Chinese operator for ninety-nine years in 2017. Her reconstruction, and the subsequent scholarship, establish that the port was built at Sri Lankan insistence against Chinese advice, that the country’s debt problem was overwhelmingly a Eurobond problem rather than a Chinese one, and that the lease was a Sri Lankan decision to raise foreign exchange rather than a creditor’s seizure. It is not that nothing happened at Hambantota. It is that what happened does not have the shape the story requires.
The African instance most often cited is Kenya’s, where reporting from 2018 asserted that the port of Mombasa had been pledged as collateral against the standard-gauge railway loans and would be forfeited on default. Successive Kenyan governments and the lender denied it, the loan documents that were eventually described publicly did not support it, no seizure has occurred, and the railway’s actual problem turned out to be a much more ordinary one: a commercial buyer’s credit whose traffic assumptions did not arrive, on which Kenya has been paying more than a billion dollars a year, and which Chapter 26 works through in detail. The rumour was more interesting than the truth, which is why it travelled further.
Two qualifications keep this from being a defence. The first is that an absence of seizures is not an absence of leverage: the contract features Gelpern and co-authors document, the escrow accounts above all, transfer control over a revenue stream without any need to take an asset, and a creditor with first claim on a port’s receipts has no reason to want the port. The second is that being wrong about the mechanism does not make the borrowing wise. Chapter 26’s railway and Chapter 29’s are both cases of expensive infrastructure bought on commercial terms against traffic forecasts nobody stress-tested, and the case against them is a project-appraisal case, not a geopolitical one. That is a duller argument and a better one.
Trade
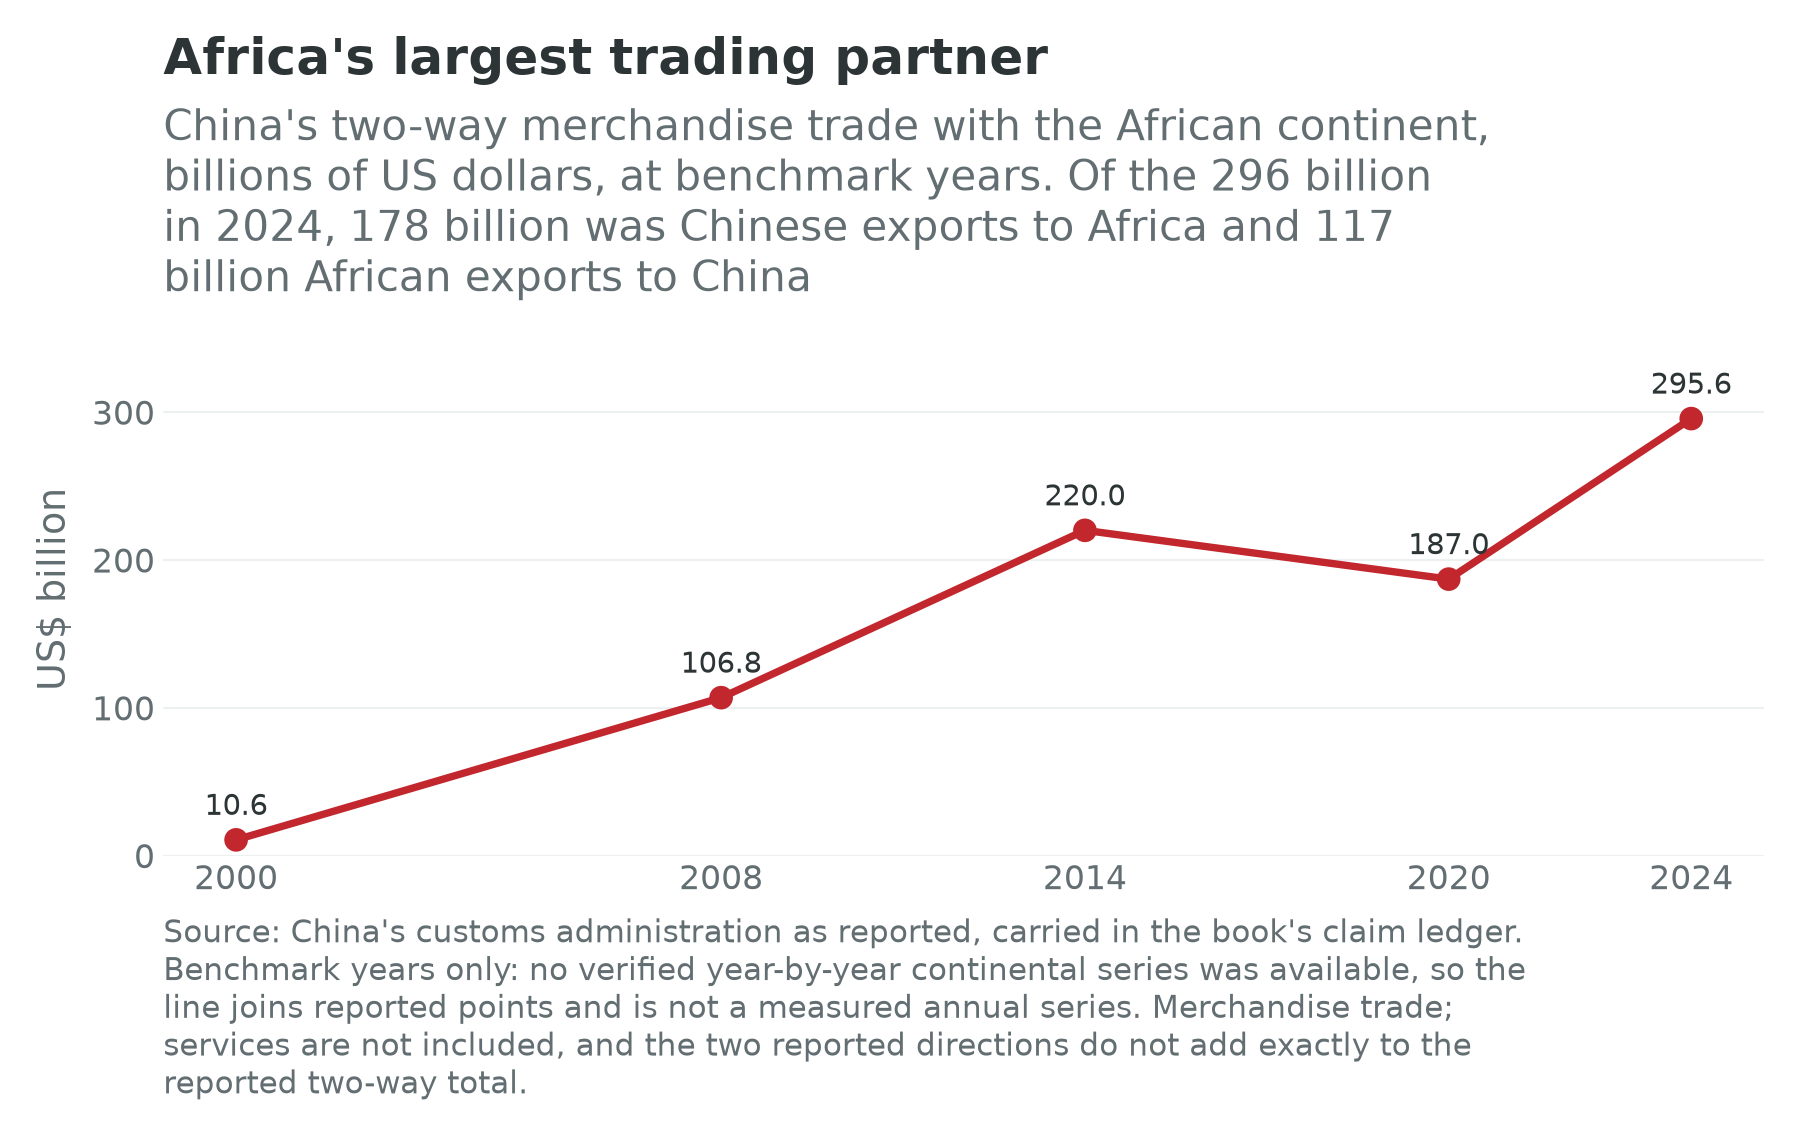
China has been Africa’s largest single trading partner since 2009, and the scale of the change is the least disputed fact in this chapter. Two-way merchandise trade was under 100 billion yuan in 2000 and 2.1 trillion yuan in 2024 by Chinese customs’ count (Xinhua, 2025); in dollars the 2024 total was about $296 billion, of which about $179 billion was Chinese exports to Africa and about $117 billion African exports to China, a deficit for the continent of roughly $62 billion (Agence Ecofin, 2025), and 2025 set a further record at about $348 billion, with the deficit above $100 billion (NTU Centre for African Studies, 2026).
The composition is the older story and it has barely moved. Africa sells crude oil, copper, cobalt and iron ore; it buys machinery, vehicles, electronics, textiles, construction materials and solar modules. A handful of countries supply the large majority of the export side, which is what a commodity trade looks like, while the import side is spread across all fifty-four, which is what a manufactures trade looks like. That asymmetry, concentrated selling and diffuse buying, is the trade-account expression of the structural fact the rest of this book keeps arriving at.
Three arguments run off it.
The competition argument is that cheap Chinese manufactures destroyed the African industry that would otherwise have employed people, so that the deficit is a development problem rather than a financing one. The best African evidence is Edwards and Jenkins (2015), who attribute a substantial share of South African manufacturing’s output and employment decline to Chinese import competition, concentrated in clothing, textiles and footwear. Chapter 15 gives the finding its full treatment and does not soften it. What belongs here is the symmetry: the same relationship that financed the port also supplied the goods that came through it.
The relocation argument runs the other way. Lin (2012) proposed that rising Chinese wages would push labour-intensive manufacturing to lower-wage countries in a flying-geese pattern, with Africa the obvious destination. Chapter 15 tests it against the Ethiopian record and finds a real but much smaller migration than the theory predicted, in which the plants that came were fewer, more fragile and more dependent on trade preferences than expected. The proposition is not dead. It has been slower and more conditional than its author hoped, and the conditions turned out to be electricity, logistics and political stability rather than wages.
The zero-tariff argument is the newest and the most testable. Removing tariffs on all lines for fifty-three countries is a genuine concession and it addresses the composition problem directly, because the tariffs that bound were on processed goods rather than on ore. Whether it changes anything depends on whether the binding constraint on African exports to China was the tariff or the supply capacity, and the honest prior, from the record of every other preference scheme in this book, is that it was mostly the supply capacity. The measure is worth watching precisely because it is a clean test.
And the electron and the panel. The fastest-growing trade flow is the one Chapter 14 counts: 16.1 GW of solar modules shipped to African countries in 2025 and 58.1 GW since 2017 (Global Solar Council, 2026). Add the electric vehicles, the batteries and the telecommunications equipment of Chapter 17 and a pattern appears that this chapter’s penultimate section is about. China is becoming the supplier of the capital goods of the energy transition to a continent that will not make them, on terms that are, for now, extraordinarily cheap.
Building, owning and staffing
The contractors are the most under-discussed half of the relationship. The firms are large, state-owned and specialised: China Civil Engineering Construction Corporation, China Road and Bridge Corporation, China Communications Construction, PowerChina and Sinohydro among others, and between them they have built a substantial share of the African infrastructure completed this century. The revenue series compiled from Chinese official statistics puts the gross annual revenue of Chinese contractors in Africa at a peak above $50 billion in the middle of the 2010s, falling to roughly $35 billion to $40 billion a year since (China Africa Research Initiative, 2025). Note what that number is: a construction revenue, not a financing flow. A great deal of the work Chinese firms do in Africa is paid for by African governments, multilateral lenders and private clients, and a contractor that wins a World Bank tender is not an instrument of anybody’s foreign policy. Conflating the builder with the lender is the most common error in this subject.
The assets are the ones the pole chapters name. The standard-gauge railways of Chapters 26 and 29; the container terminals and port stakes of Chapter 19, at Doraleh, Lomé, Lagos and elsewhere; the hydroelectric and thermal plant of Chapter 14; the telecommunications equipment layer of Chapter 17, where a single vendor’s share of African mobile networks is estimated at around half of 3G and roughly 70 percent of 4G; and the special economic zones, from the Eastern Industrial Zone outside Addis Ababa in Chapter 15 to the Lekki free zone east of Lagos in Chapter 24 and the zone at Ain Sokhna on the Suez Canal in Chapter 27. What this chapter adds is the balance-sheet observation Chapter 19 makes about ports and Chapter 13 about mines: the asset stays in the country and the control and the margin frequently do not.
Direct investment is small relative to all of it. The stock of Chinese direct investment in Africa is on the order of $40 billion to $50 billion, less than a decade and a half of contract revenue and less than a third of the cumulative commitment record (China Africa Research Initiative, 2025). That ratio is the most useful single corrective to the way this relationship is discussed. China has been overwhelmingly a lender and a builder in Africa and only secondarily an owner, with one large exception, which is mining: Chapter 13 sets out the Congolese cobalt and copper positions, the Zimbabwean lithium positions and the Guinean bauxite and iron-ore positions, and observes that the ownership is vertically integrated with Chinese refining capacity rather than held as portfolio investment. Where China owns, it owns the input to its own industry.
The private half is invisible in every ledger. Alongside the state firms sits an economy of small Chinese traders, shopkeepers, contractors and manufacturers, and alongside them an African commercial diaspora in Guangzhou and Yiwu buying goods for the markets of Lagos, Nairobi, Kinshasa and Dakar. The Nigerian trading networks that supply Nnewi’s motor-parts cluster from Chinese factories are the best-documented case and they are documented ethnographically rather than statistically. None of it appears in a loan database, a customs series attributes it to whoever cleared the container, and it may be the part of the relationship that touches the most African livelihoods.
And the people are fewer than they were. The count of Chinese workers in Africa, compiled from Chinese official statistics, peaked at about 263,000 in 2015 and has fallen to under 100,000 since 2020 (China Africa Research Initiative, 2025). The direction of that series matters for the labour argument: the complaint that Chinese projects import their workforce is best tested against a number that has fallen by two thirds while the projects continued. Running the other way, tens of thousands of African students study in China each year on scholarships that are one of the forum’s standing deliverables, and the alumni are now a visible cohort in African ministries, universities and firms. That is the cheapest instrument in the relationship and probably the most durable.
The politics
FOCAC is the institutional core, and its design is worth noticing. It is a forum of one country and a group of fifty-three, with no secretariat holding independent authority, no dispute mechanism and no binding commitments; every negotiation that matters is bilateral, and the multilateral occasion exists to set the frame within which the bilateral deals are done. African governments have criticised the asymmetry for two decades and have also, without exception among the fifty-three, kept attending, which tells you what the alternative is worth.
The entry condition is the one-China policy. Fifty-three of the fifty-four states in this book recognize Beijing; Eswatini recognizes Taipei and is the last African state to do so, which is why it has no commitment record and no forum seat. Whether that costs Eswatini anything measurable is a question the cards cannot answer, since its neighbours’ outcomes differ for a hundred other reasons; what it demonstrates is that the condition is real and that it is the only one.
The security dimension is one facility and should be described as one facility. The People’s Liberation Army support base at Djibouti, opened in 2017, is China’s first overseas military installation, and it sits a few kilometres from American, French, Japanese and Italian bases on the same coast, all of them paying rent to the same government. Chapter 29 makes the point that Djibouti’s largest single line of national income is the leasing of its own strategic position, and that the strategy is coherent precisely because it is not exclusive. The interesting question about the base is not whether it exists but whether the commercial port next to it is convertible to naval use, which is a question about one facility that the loan documents do not answer, as Chapter 19 says.
Alongside these sit the softer instruments: the African votes in the United Nations system that China’s positions have generally attracted, the party-to-party training programmes that connect ruling parties rather than states, the media partnerships, and the scholarships. None is measurable in the way the loan record is, and the temptation to substitute assertion for measurement is at its strongest here. What can be measured is African opinion, and it is not what the Western commentary predicts. Afrobarometer’s surveys have consistently found a majority of respondents rating China’s economic and political influence as positive, at around six in ten across the countries surveyed, with China’s development model rated close behind the American one as a template worth following (Afrobarometer, 2025). The same surveys find the same respondents critical of the quality of Chinese products and of the employment practices on Chinese projects. Africans, it turns out, hold two opinions at once, as people do.
The response from elsewhere gets one paragraph, because Chapter 33 owns it. The American and European answers to all of the above are the Lobito corridor financing of Chapter 30, the Minerals Security Partnership of Chapter 13 and the European Union’s Global Gateway, and their common feature is that they are infrastructure and minerals programmes justified by a strategic argument about China. Chapter 33 assesses them on their own terms. The observation to carry from here is the one Chapter 30 makes from the Copperbelt: a landlocked region with two competing routes to two oceans bargains from a better position than one with none, and the beneficiary of the competition is the country being competed for.
What the evidence says
Six findings, and what each design can and cannot answer
There are no randomized trials of a bilateral relationship. Nobody assigns a railway by lottery. The recurring evidence box therefore changes its name here rather than its standard, and the literature it draws on is the geocoding literature, which matches the location of Chinese-financed projects to survey and event data and asks what changed nearby.
Chinese aid raises growth in the places that get it. Dreher, Fuchs, Parks, Strange and Tierney (2021) assembled a project-level dataset of Chinese official finance and instrumented a recipient’s exposure using variation in Chinese domestic steel production interacted with a country’s propensity to receive Chinese projects. They find that an additional aid-like project raises growth in the following two years by a magnitude comparable to the estimated effects of Western aid. The instrument is doing hard work, and the estimate is for the aid-like subset rather than for the commercial lending that dominates the dollars. What it establishes is that “no effect” is not the right prior.
And it raises local corruption where it lands. Isaksson and Kotsadam (2018a) matched Afrobarometer respondents to the location of Chinese project sites and found local corruption, as reported by residents, higher near an active Chinese project than in comparable places, and higher than near comparable World Bank projects. The comparison with the World Bank is what makes the result more than a statement about construction sites in general. It cannot say whether the corruption is caused by the money or by the absence of the procurement machinery a different lender would have imposed.
It also suppresses union activity. Isaksson and Kotsadam (2018b), using the same geocoding, find lower trade-union involvement among workers near Chinese projects. This is the closest thing in the literature to a direct test of the labour complaint, and it is a test of local association rather than of a national labour-market effect.
Local politics gets noisier, not quieter. Iacoella, Martorano, Metzger and Sanfilippo (2021) find Chinese official finance associated with higher local political participation, including protest, in the areas that receive it. Read with the corruption result, the picture is of projects that raise the local stakes: more money, more capture, and more contestation of the capture. That is the picture in neither the enthusiast nor the alarmist literature.
Connective infrastructure spreads activity out. Bluhm, Dreher, Fuchs, Parks, Strange and Tierney (2025) study Chinese-financed transport infrastructure and find that it disperses economic activity away from primate cities towards the places the roads and railways connect, in contrast to the concentrating effect of much other investment. If it holds, this is the most consequential finding in the box, because it speaks to the corridor logic the whole of Part VI runs on.
And the measurement results the rest rests on. Horn, Reinhart and Trebesch (2021) established the coverage gap and Gelpern, Horn, Morris, Parks and Trebesch (2021) what is in the contracts; Brautigam and Hwang (2016) built the loan-level African record that made both possible. None is econometrics. They are why the other five have data to work with, and why this chapter’s central exhibit exists.
The relationship in two worlds
Chapter 1 asked the reader to hold two worlds at once. In the labour-abundant world the identity is a lever and Africa holds the long end of it. In the labour-redundant world the frontier of production is compute, energy and capital, labour is a complement at best, and income per head depends on who owns the machines and on the terms of trade for what a country has under it (Acemoglu and Restrepo, 2019; Korinek and Stiglitz, 2021).
In the first world, everything in this chapter is a story about term three, and the verdict is mixed in a specific way. The corridors were built, the ports work, and the generating capacity is real. Against that, several of the flagship assets were bought on commercial terms against forecasts that did not arrive, the debt service now competes with the recurrent budget, and the employment effect was small because a railway employs thousands to build and hundreds to run. A relationship that raised the capital stock and did little for the employment ratio is the identity’s middle term losing to its third, which is the finding Chapter 10 reports from a different direction.
In the second world the relationship has a shape that should make an African policymaker uncomfortable, because it is the current shape intensified. If the frontier becomes machines and the energy to run them, the goods that matter are solar modules, batteries, grid equipment, telecommunications hardware and the servers in a data centre, and the inputs that matter are copper, cobalt, lithium, manganese and electricity. China is today the dominant supplier of the first list and the dominant refiner of the second. A continent that sells the ore and buys the machine is in the relationship it is already in, with the stakes raised: the value added moves further towards refining and manufacturing, both of which happen elsewhere, and the African share of the chain narrows to the extraction and the electrons.
Two things would change that, and both are ownership questions rather than trade questions. The first is whether refining and cell manufacture can be made to happen on the continent, which Chapter 13 argues turns on electricity prices and scale rather than on export bans. The second is the one this chapter is placed to ask: whether Chinese finance follows Chinese equipment into African compute and grids, and on what terms. The equipment is already arriving in quantity. If the data centres and the transmission serving them are built on the model of the standard-gauge railways, financed by a buyer’s credit against a revenue forecast, Africa will own the buildings and owe for the machines inside them. If they are built on the equity and co-investment model the post-2021 doctrine points towards, the ownership question is settled differently and probably worse, because an equity stake does not mature. The instrument that would settle it well, a domestic capital market financing an African-owned asset, is the one Chapter 16 says does not yet exist at scale.
That is the honest conclusion. The debate about whether Chinese lending was a trap has been conducted for a decade on evidence that does not support it, and the debate that matters was never about the loans. It is about who owns the productive assets of the next thirty years.
Data quality
Data quality in this book is a layer rather than a caveat, and a chapter built on compiled ledgers should say what they can bear.
The commitment record is a research product, assembled from public reporting, budget documents and contracts rather than reported by either counterparty. It records signings, not disbursements, and it stops in 2024. It is attributed to 49 of the 54 countries, and its five gaps are named above.
The official statistics are a stock reported by borrowers, covering general government and guaranteed debt only. The China line comes from their creditor-country table, which is filled on 46 cards, and the Paris Club line from the same table, filled on 50. Three things limit them. A creditor country is not a creditor institution, so the China line cannot separate a policy bank from a contractor’s credit line, which is exactly the distinction most of the political argument turns on. The four cards with no China line are four countries with no reported Chinese debt rather than four countries nobody asked, and the difference is not visible in the field. And the whole table covers only the guaranteed stock, so a facility taken by a state-owned enterprise without a sovereign guarantee is outside it, which is where a good deal of the lending this chapter describes was structured.
The collateralisation flag carries a note on eleven cards, from a published register of thirty resource-backed loans agreed between 2004 and 2018, and nine of those eleven also carry a China line. The other forty-three are blank, and blank means unrecorded rather than none: the register was reconstructed from public documents, its authors disclaim comprehensiveness, and the instrument’s first contractual feature is a confidentiality clause. The section above on collateral is written against a floor, not a count.
Three of the countries with the largest recorded exposures carry the book’s low confidence flag, Ethiopia, Cameroon and Congo-Brazzaville, alongside Equatorial Guinea; Angola and Zambia carry medium flags and Kenya and South Africa high ones. The countries where the two ledgers diverge most are, with the partial exception of Kenya, the countries whose statistics are weakest everywhere, and a reader who wants to believe the gap is an accounting artefact and a reader who wants to believe it is concealment will both find the data-quality layer consistent with their view. That is the position, and it is better stated than smoothed.
The non-financial channels are weaker still. The trade series here is China’s customs record as reported, at benchmark years rather than as a measured annual series; the contract revenue, investment stock and worker counts are compiled from Chinese official statistics by a research initiative and are quoted as magnitudes; and the network-equipment shares above are analyst estimates that have hardened through repetition, as Chapter 17 says. None of the four is a measurement in the sense that the country cards’ demographic fields are measurements.
Connections to Other Chapters
- Chapter 1 (Africa in Numbers) sketches the balance-sheet lens and states the two worlds; Chapter 5 (States and Development Bargains) owns the settlement question that decides what a government does with a buyer’s credit; Chapter 8 (Money) owns the swap lines and the currency side.
- Chapter 21 (Capital and Sovereign Debt) owns the debt system, the Common Framework and hidden debt in all four of its forms, and hands this chapter the China side of the reconciliation.
- Chapters 12, 13 and 14 own the resources and the power: the resource-backed instrument, the mining and refining positions, and the solar and equipment trade. Chapter 15 owns the competition and relocation arguments; Chapter 17 owns the network equipment; Chapter 19 owns the ports and the one-facility question about Djibouti.
- Chapters 24, 26, 29, 30 and 31 (the growth poles) carry the assets and the cases: Lekki and the Nigerian commitments in 24, the Mombasa railway and the expressway in 26, the Addis to Djibouti line and the Djibouti moratorium in 29, the Angola mode and the two Copperbelt railways in 30, and Sicomines and the Brazzaville prepayments in 31.
- Chapter 33 (The Other Partners) owns the Gulf, India, Turkey, Russia and the Western response, including Lobito and Global Gateway as programmes; Chapter 35 (Scenarios) carries the compute-inputs branch this chapter’s penultimate section describes.
Discussion Questions
On twenty of the forty-six cards carrying both, the recorded Chinese commitment total exceeds the entire official bilateral creditor column. Construct three innocent explanations for that pattern and one guilty one, and for each say precisely what evidence would distinguish it from the others. Then say which of the four you would need to rule out before advising a government on a restructuring, and which you could live with not knowing.
Chinese lending to African borrowers fell from about $28 billion in 2016 to under $1 billion in 2022 (Boston University Global Development Policy Center, 2025). Three explanations are on offer: the borrowers stopped being creditworthy, the lender’s own system reassessed the risk, and the doctrine changed towards smaller projects. These have different implications for what happens next. Say what each predicts for the composition of Chinese finance in Africa over the next decade, and name the observable that would separate them.
The evidence box reports that Chinese projects are associated with higher local corruption, lower union involvement, higher local protest, and dispersion of economic activity away from primate cities. Suppose all four findings hold. Write the paragraph a finance minister should read before signing the next facility, and be explicit about which of the four you would trade away for the fourth.
Try It
Open the Sovereign Debt Tracker at the debt page and read three countries in this order: Angola, Kenya and Ethiopia. For each, note two things: the height of the official bilateral column, and the Chinese commitment figure drawn beside it, and observe that the China line inside the creditor breakdown is drawn as a blank rather than a zero, because the statistics carry no value there. Then switch to the China view, which ranks all fifty-four on the commitment record. Angola sits at the top by a distance; Kenya and Ethiopia sit third and second. Now answer one question in a paragraph: if you were sizing the official-sector claim in a restructuring of any one of the three, which number on the page would you start from, what would you have to assume to use it, and what single document would you demand to see before you stopped assuming?
Data Exercise
Download all fifty-four cards from the country cards page on this site, as cards.csv or as cards.json. Build a table with balance_sheet.china_loan_commitments_cumulative, balance_sheet.external_debt_by_creditor.china, balance_sheet.external_debt_by_creditor.paris_club, balance_sheet.external_debt_by_creditor.other_bilateral, balance_sheet.external_debt_stock, scale.gdp_usd and data_quality.confidence_flag. Then do five things. First, confirm the counts: 49 cards carry a commitment record, 46 a China line, 45 both. Second, compute the ratio of commitments to the outstanding Chinese balance on those 45, confirm the median of 1.9 and the two cards below one, and write two sentences on what a high ratio and a low ratio each tell you about the age of a lending relationship. Third, compute the commitment record as a percentage of output for every card carrying both, rank it, and write one sentence on what the top six have in common; you should find Equatorial Guinea, Djibouti, Angola, Eritrea, Zambia and Congo-Brazzaville, and the answer is not “they are poor”. Fourth, compute the China line as a share of publicly guaranteed debt, which is the sum of multilateral, other_bilateral and other_private; note before you do it that adding the China line into that sum would be a double count. Rank the result, and compare the ranking with the one from the commitment record. Fifth, count the cards on which the China line exceeds the Paris Club line, and say what a Common Framework committee looks like on each side of that count. Never impute a null as a zero: five cards have no commitment record, four report debt but no Chinese line, and three carry a commitment record and no bilateral column at all.
Data Sources and Further Reading
Key data sources
- Boston University Global Development Policy Center, Chinese Loans to Africa database, 2000 to 2024 release: cumulative loan commitments on 49 of the 54 cards. Loan-level, compiled from contracts, budget documents and public reporting rather than from either counterparty. A flow of signings, not a stock, and not additive to anything in the debt statistics.
- World Bank International Debt Statistics, 2025 release: the external debt stock and its creditor composition on 50 of the 54 cards. Debtor-reported, general government and guaranteed debt, classified by creditor type rather than by creditor, with no China line and no Paris Club line.
- AidData, Global Chinese Development Finance dataset, and the 2023 Belt and Road Reboot report: project-level, wider in scope than the loan databases, and the source for the shift towards collateralised, commercially priced and rescue lending.
- China Africa Research Initiative, Johns Hopkins SAIS: the contract-revenue, direct-investment and Chinese-workers series compiled from Chinese official statistics.
- General Administration of Customs of China for the two-way merchandise trade series, quoted here at benchmark years; Forum on China and Africa Cooperation declarations and action plans, and the Ministry of Commerce of the People’s Republic of China, for the pledges and the tariff measures.
- Afrobarometer: African opinion on Chinese influence and on the Chinese development model, the only channel here measured by asking Africans.
- The country cards, whose balance-sheet block carries the commitment record beside the creditor lines, and whose China creditor field is empty on all fifty-four.
Further reading
- Deborah Brautigam (2009), The Dragon’s Gift, still the best single account of how the relationship was built, and Brautigam (2020) for the dismantling of the debt-trap meme.
- Sebastian Horn, Carmen Reinhart and Christoph Trebesch, “China’s Overseas Lending” (2021), for the coverage result, with Anna Gelpern and co-authors, “How China Lends” (2021), for what is in the contracts.
- Axel Dreher and others (2022), Banking on Beijing, for the book-length treatment of the geocoded evidence in this chapter’s evidence box.
- Irene Yuan Sun, The Next Factory of the World (2017), for the private Chinese manufacturers no ledger counts, and Ching Kwan Lee, The Specter of Global China (2017), for Chinese state capital beside private global capital in Zambian mines and construction, from fieldwork rather than from a database.