15. Manufacturing and the Auto Industry
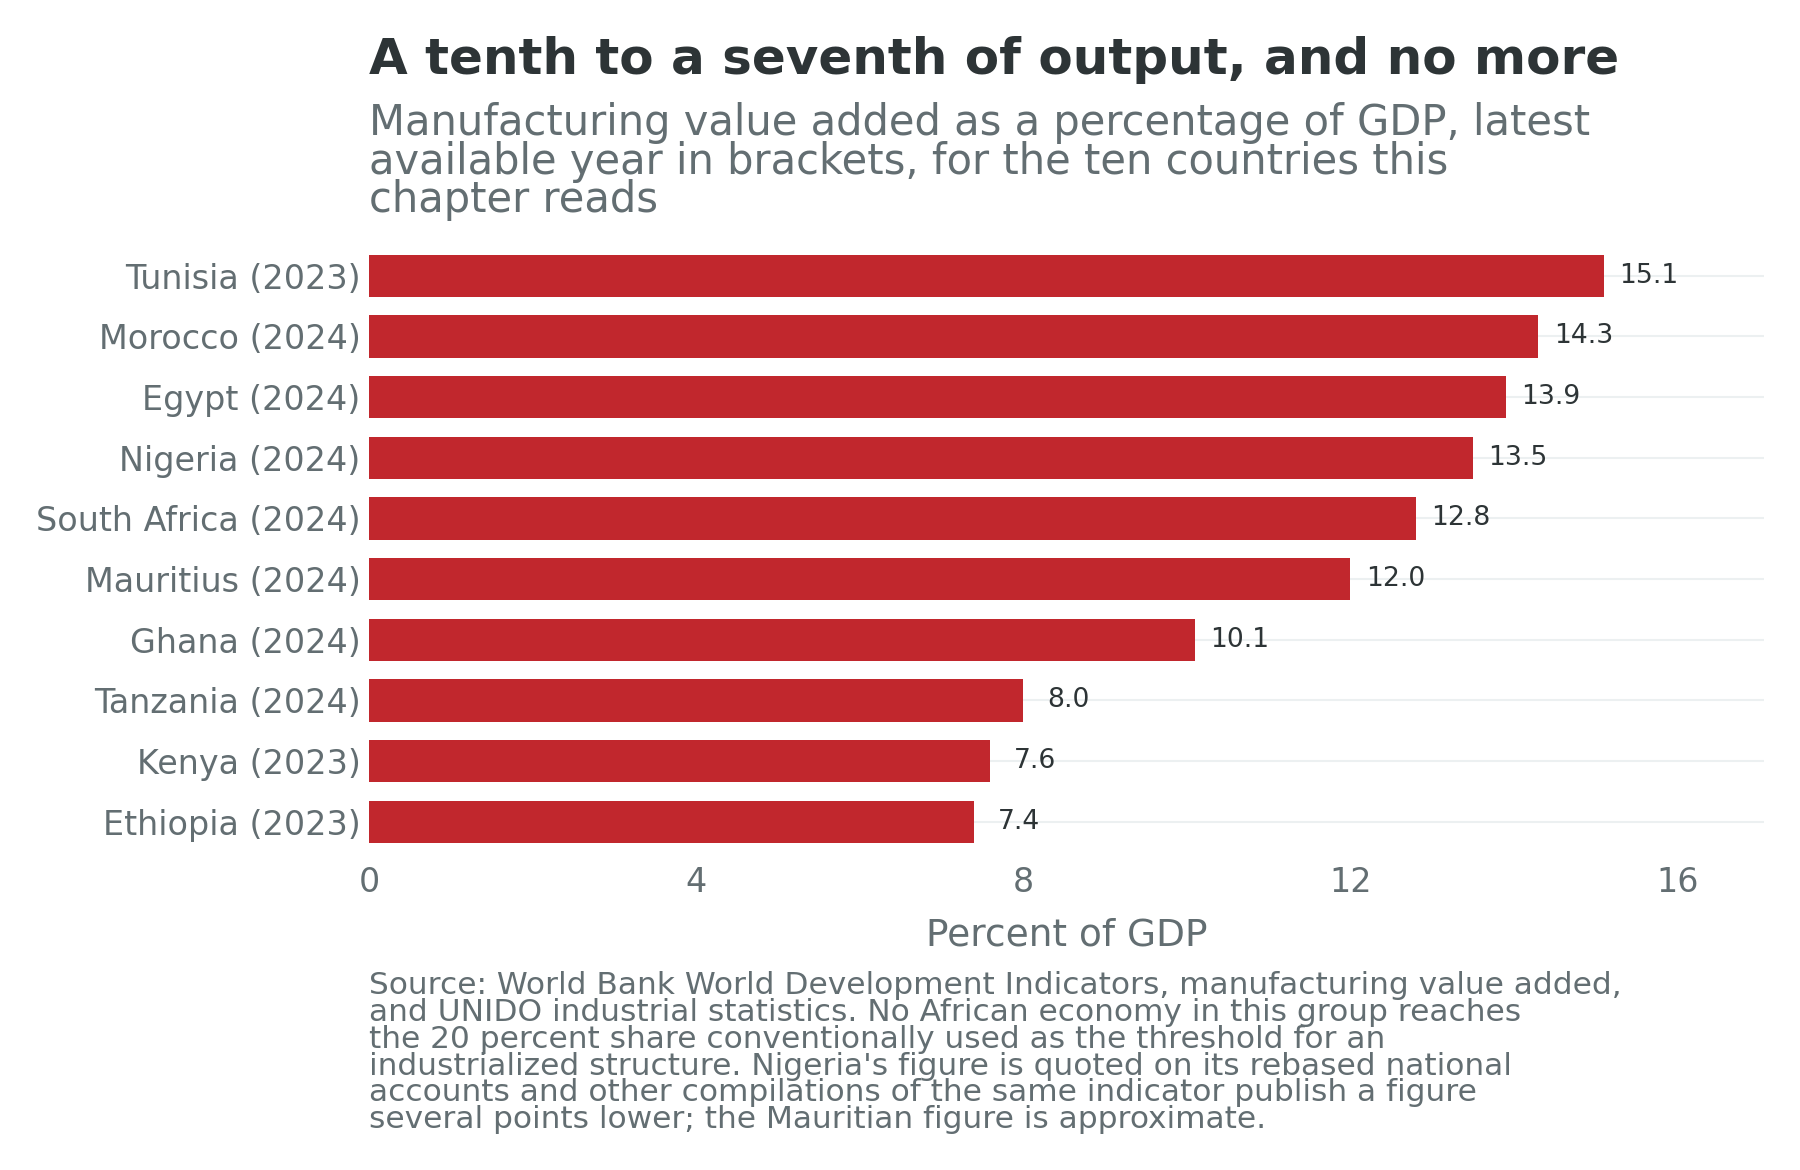
Africa holds 18.6 percent of the world’s people and produced 2.0 percent of the world’s manufacturing value added in 2024, on 3.2 percent of world output (UNIDO, 2025). A continent with a fifth of humanity makes a fiftieth of its manufactures. This chapter asks whether that ratio is a starting position or a settled one, and the honest answer is that it has been both, in different countries, in the same decade.
Learning Objectives
After reading this chapter, you should be able to:
- Place manufacturing in the identity, explain why it is the sector that is supposed to move terms two and three together, and say what the cards show instead.
- Read a manufacturing-value-added series, and explain why a plant announcement is not one.
- Distinguish full assembly from completely- and semi-knocked-down kits, and say what each is worth in local value added and in jobs.
- Assess an industrial-zone strategy against the Hawassa record as well as the Tangier one, and name the four things a zone actually supplies.
- Explain premature deindustrialization and the small-firm manufacturing renaissance, and say which African evidence supports each.
Prior work: the automotive and textile value chains, and the Moroccan vehicle-production series, are treated in the companion volume, The New Regional Economics, chapter 14 (Wilse-Samson, 2026), and cited here rather than repeated.
1. Overview
Manufacturing matters out of proportion to its size because it is the one sector that is supposed to move term two and term three at once. A factory job is a wage job, so it shows up in the employment ratio and in the wage-employment overlay rather than vanishing into the informal residual, and it raises output per worker while doing so. That is the whole East Asian argument, it is the second ingredient of the recipe Chapter 9 tests, and it is why Rodrik (2016) on premature deindustrialization is the most serious counter-case in this book. If the sector sheds workers at incomes far below where the earlier industrializers did, the ladder the recipe assumes has lost its lower rungs.
| Identity term | What this sector does to it | Where it is read |
|---|---|---|
| One: working-age population | Nothing directly, though plants follow cohorts to port cities and secondary cities | Chapter 2 |
| Two: employment-to-working-age ratio | The one sector that is supposed to move it and the wage overlay together | Chapter 10, and Table 15.1 below |
| Three: output per worker | Within-sector, through learning by exporting; between-sector, by pulling labour off farms | Chapters 6 and 9, and Table 15.1 below |
Terms are annual growth rates over 2014 to 2024, as everywhere in this book.
The sector’s own size is the first thing to establish, and it has to be established with a value-added series rather than with a ribbon-cutting. Manufacturing value added rose across the continent from something like $285 billion in 2020 to something like $351 billion in 2025 (African Business, 2026b), which is real growth and a small base: in 2023 only five African countries, Nigeria, Egypt, South Africa, Algeria and Morocco, recorded manufacturing value added above $10 billion (UNIDO, 2025). Measured as a share of what each country produces, the sector has been going the other way for four decades. Manufacturing was about 18 percent of Sub-Saharan output in 1981 and about 11 percent in 2023 (UNIDO, 2025). That is the deindustrialization finding, and it happened at incomes an order of magnitude below the ones at which Britain, Japan or Korea began to shed factory employment.
The ten countries, read off the cards
Table 15.1 is the sector’s constituency. These ten hold 50.0 percent of the continent’s population and produce 56.9 percent of its output, and between them they contain every African vehicle plant of consequence, every apparel export programme worth the name, and the continent’s largest cement, food-processing and pharmaceutical firms.
| Country | Term one | Term two | Term three | Wage employment (percent) | Employment outside agriculture (percent) | Within-sector | Between-sector | Confidence |
|---|---|---|---|---|---|---|---|---|
| Morocco | 1.10 | -0.45 | 1.88 | 59.6 | 71.7 | 2.81 | 1.13 | high |
| South Africa | 1.61 | -0.45 | -0.48 | 82.7 | 94.6 | 0.39 | -0.21 | high |
| Egypt | 1.96 | 0.07 | 2.26 | 72.9 | 82.0 | 1.20 | 0.31 | high |
| Nigeria | 2.90 | 0.29 | -1.94 | 13.6 | 65.9 | -1.19 | 1.48 | low |
| Kenya | 2.94 | -1.17 | 2.84 | 35.1 | 53.5 | 2.50 | -0.07 | high |
| Ghana | 2.52 | -1.56 | 3.48 | 32.2 | 64.8 | 3.74 | -0.71 | medium |
| Ethiopia | 3.46 | -1.58 | 5.91 | 15.4 | 39.0 | 4.21 | 1.67 | low |
| Tunisia | 0.53 | -0.19 | 0.48 | 75.0 | 87.3 | 1.79 | 0.02 | high |
| Mauritius | -0.24 | 0.61 | 2.02 | 81.8 | 95.1 | 1.46 | 0.54 | high |
| Tanzania | 3.55 | 0.03 | 1.92 | 14.5 | 34.9 | 2.79 | 1.67 | medium |
| Continental median | 2.89 | -0.15 | 0.74 | 31.0 | 59.0 | 1.20 | 0.69 |
Growth rates are annual, in percentage points, over 2014 to 2024; the shares are of the latest year on each card; the within-and-between split runs over 2008 to 2018 on the twenty-one countries the transformation database covers. Term one is the working-age population aged 15 to 64 and term two is modelled employment aged 15 and over divided by that population. The median row is taken column by column across the cards carrying each quantity and is not a country. Sources: UN World Population Prospects 2024, medium variant; ILOSTAT modelled estimates, November 2025; IMF World Economic Outlook, April 2026; the Groningen Growth and Development Centre’s Economic Transformation Database; and the book’s data-quality table, all via the country cards.
The cards carry no sector fields, and this chapter says so once rather than repeatedly. There is no manufacturing employment line on any of the fifty-four. The export fields measure the problem from the other side: primary commodities are 62.7 percent of South Africa’s merchandise exports and 95.2 percent of Nigeria’s, against 23.0 percent of Morocco’s, whose top three include passenger cars. Every sector number below therefore comes from a named source outside the card layer, and every card number is one of the identity terms, overlays or data-quality fields in Table 15.1.
The finding Chapter 9 hands over
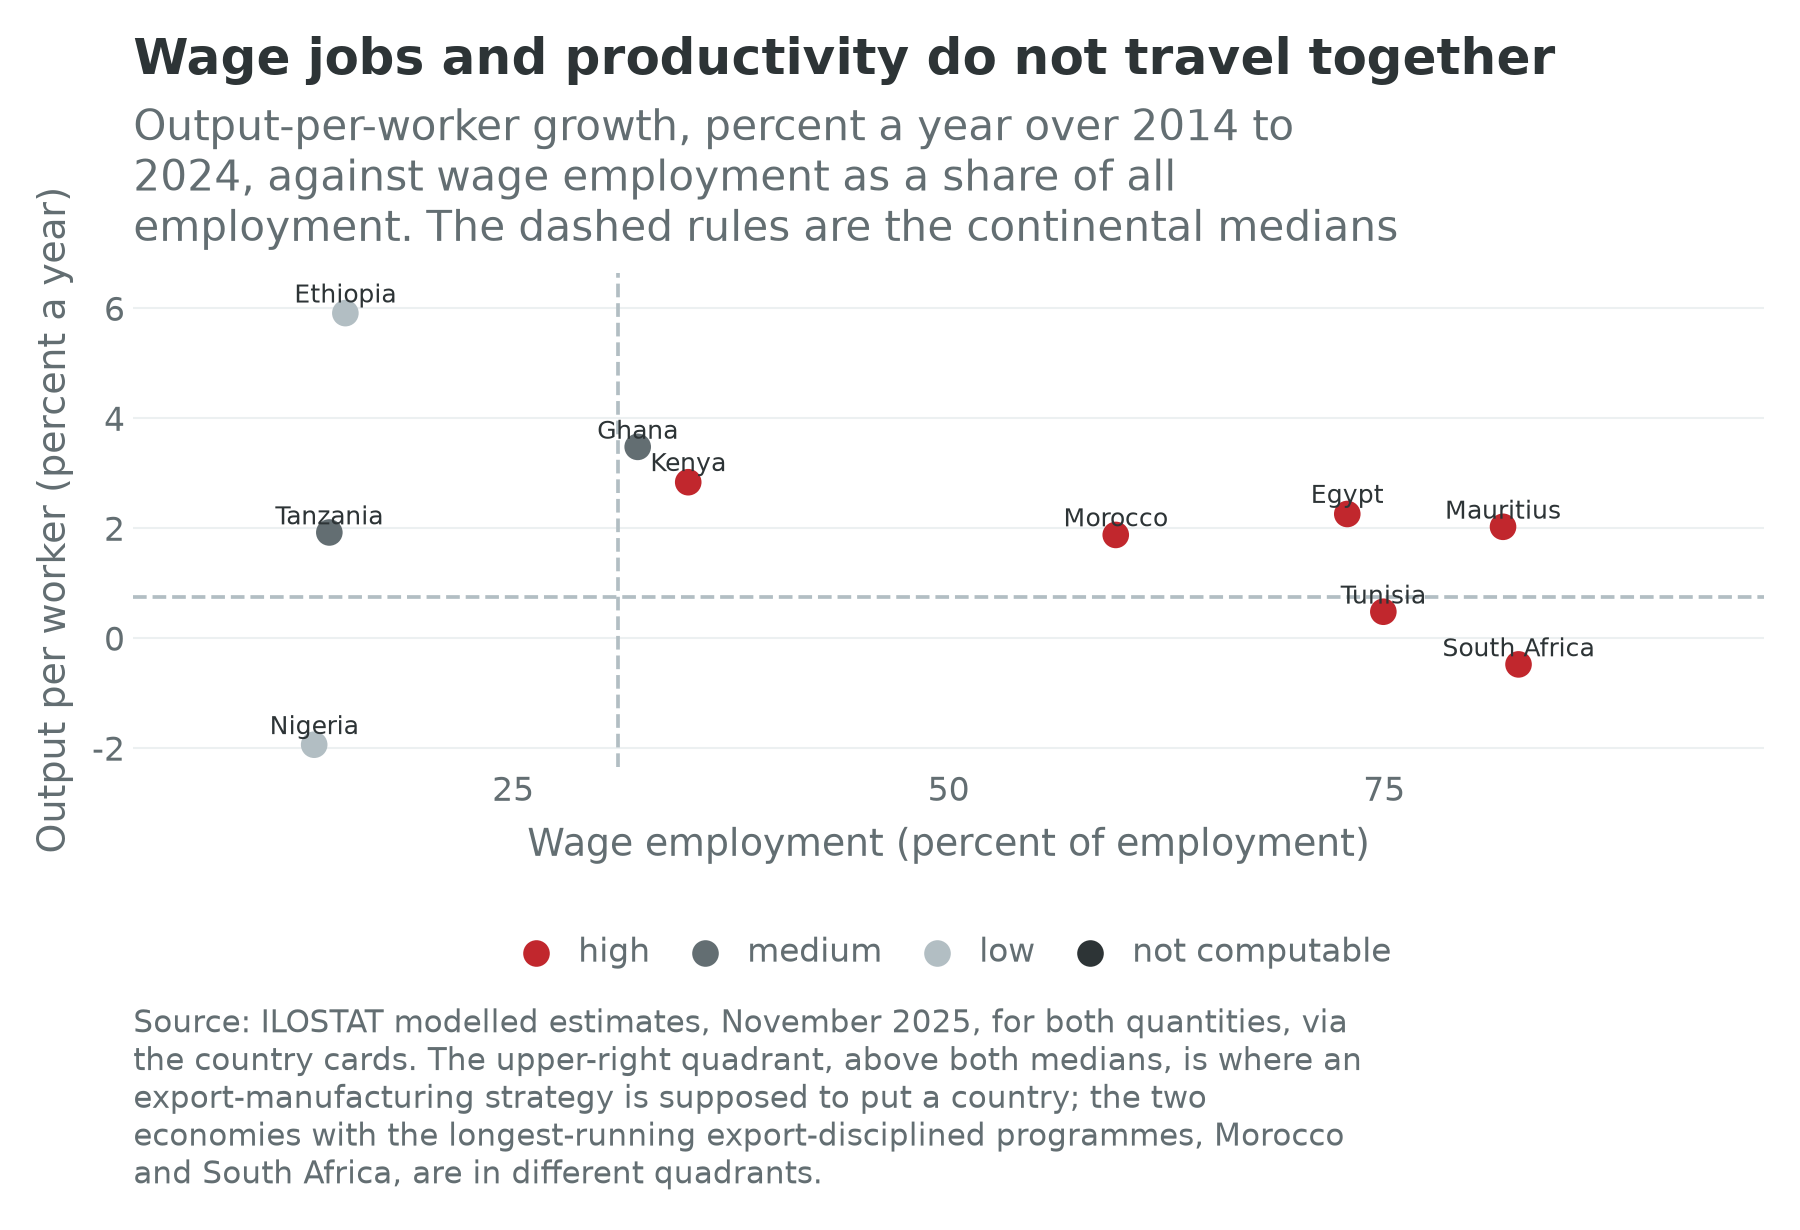
Chapter 9 ends on the most uncomfortable evidence in Part II. The two African programmes that genuinely applied the export test, the Moroccan automotive cluster of Chapter 28 and the South African automotive programme of Chapter 25, both raised output per worker relative to what their neighbours managed, and neither moved the employment ratio. Both post a second term of minus 0.45 percent a year, indistinguishable to two decimal places, in two economies that share almost nothing else. The chapter asks this one to explain why.
Four answers, in ascending order of how much they should worry a policymaker.
The first is arithmetic, and it is the least interesting. Manufacturing is around an eighth of output in both countries and a smaller share of employment, and a sector that employs a tenth of the workforce has to grow its own headcount by a tenth to move the national employment ratio by a percentage point. That is a statement about denominators rather than about industrial policy, and it is why a country cannot industrialize its way to a rising second term inside a decade even when the industry works.
The second is that modern assembly is capital-intensive from the first day. The plants Chapter 28 describes were built in the 2010s with the robot density and cycle times of European plants, because they were built to supply European assembly lines to European quality standards. An assembler chooses its capital intensity to hit a defect rate, not an employment target, and the defect rate is set by the customer. Morocco’s cluster employs on the order of a fifth of a million people directly, a large industrial workforce by African standards and a rounding error against a labour force of Morocco’s size (Chapter 28 gives both figures). The rung exists. It is narrower than it was.
The third is that the jobs were partly displaced rather than created. South Africa’s programme supported assemblers inside an economy that already had them, with a shrinking clothing, textile and footwear sector losing employment to imports at the same time (Edwards and Jenkins, 2015). Net employment is the difference between two large numbers, and an industrial policy that raises one can coincide with a fall in the total. Chapter 25 gives the labour-market half: the country with the continent’s highest wage-employment share, at 82.7 percent, also has its worst employment outcome.
The fourth is the one this book keeps arriving at. In Morocco the constraint on the second term is not that the plants did not hire but that a large share of the working-age population is not in the measured labour force at all, and almost all of that share is female; Chapter 28 sets out the participation gap. An export platform cannot raise an employment ratio whose denominator includes millions of people the labour market never approached. Term two is only partly an industrial variable. It is also a variable about who is allowed, expected or able to look for work.
Put the four together and the answer to Chapter 9’s question is not that export discipline failed. It is that export discipline buys the third term reliably and the second term only where the sector is large relative to the workforce, the technology is labour-using, the incumbent industry is not being destroyed at the same time, and the labour market is open on both sides. East Asia had all four. Morocco has the third of them and, at a stretch, half of the second.
2. How the industry works
The assembler on a Tuesday
An African vehicle plant is a customs operation with a paint shop attached. On a Tuesday morning the plant manager is looking at three things: whether the containers cleared, whether the line ran, and whether the homologation paperwork for a new variant is back from the standards agency. The containers matter most, because almost everything in the vehicle arrives in them. A kit for a mid-sized car is a set of pressed panels, a powertrain, a wiring harness, seats, glass, electronics and several thousand fasteners, shipped from a plant on another continent, and the assembler’s margin is the difference between the landed cost of the kit plus local labour and the price a buyer will pay behind whatever tariff wall exists. That is a trading margin dressed as a manufacturing one, and it is the correct way to think about most of the plants on the continent’s map.
Above the assembler sit the suppliers, and this is where the industry becomes an industry. A tier-one supplier makes a module, a seat or a dashboard or a bumper assembly; a tier-two supplier makes the foam, the connectors and the mouldings the module is made of. Modules are bulky relative to their value, so shipping them is expensive, and they are built to sequence, meaning the supplier is told at short notice which variant is coming next and has to deliver in the right order. Both facts push suppliers to locate beside the assembler, which is why a plant with real volume grows a supplier park around it and one without volume does not. Wiring harnesses are the exception that proves the rule: labour-intensive, light and easy to ship, they were the first automotive investments in Morocco and in Tunisia, and they are the piece of the industry that migrates fastest when wages rise.
Local-content rules are the state’s attempt to force the second paragraph out of the first, and they come in two forms. A parts-count rule counts items sourced domestically, which a firm satisfies by localizing floor mats and screws. A value rule counts the share of ex-works value added in the country, which is harder to satisfy and harder to audit, since the auditor has to know the transfer price of an imported module. Chapter 25 describes the South African version, in which the credits an assembler earns rise with the value it adds locally, and Chapter 28 the Moroccan one, in which the reported integration rate is a policy target as much as a measurement.
Rules of origin do the same work at the border, and the continental picture is unfinished in exactly the place it matters: the African free-trade area’s outstanding tariff lines are textiles and clothing plus automotives, which Chapter 7 identifies as the two labour-intensive assembly industries where a continental rule would bind first. Until those rules exist, a car assembled from imported kits in one African country has no settled claim to duty-free entry into another, which removes the one argument for building a plant that serves more than a national market.
What a zone actually supplies
The special economic zone is the other institutional container, and it is worth stating plainly what one supplies, because zone advocacy and zone criticism both argue about the wrong things. A zone supplies four goods: customs treatment, so inputs enter and output leaves without the duty and the delay of the general regime; serviced land with power and water, so a firm need not build a substation; a single administrative counter, so a licence is one conversation rather than eleven; and, sometimes, a labour regime distinct from the national one. It does not supply demand, skills, suppliers or a currency in which profits can be repatriated, and every African zone failure has been a failure of one of those four.
The record is accordingly split. Tangier’s zones sit beside the largest port in the Mediterranean, fourteen kilometres from the customer, and Chapter 28 argues that the port and the proximity did most of the work. Hawassa is the caution: a serviced, powered, customs-enabled apparel campus that Chapter 29 shows running at a fraction of its design employment, for reasons that were never about the fence. The Suez Canal Economic Zone of Chapter 27 has the ingredients most African would-be manufacturers lack and has converted them into memoranda more readily than into plants. South Africa’s Coega has taken three decades to fill; Nigeria’s Lekki free zone succeeded by hosting one very large project rather than a cluster of exporters, which is a different animal; and Kenya’s Athi River zone did what a zone is supposed to do for apparel under a trade preference, which Section 5 sizes.
Box 15.1: CKD, SKD and full assembly, and why the distinction is the chapter
Most of the “car plants” on this continent are not car plants, and the industry’s own vocabulary distinguishes three things whose differences in local value added and in employment are large enough to change what a policy is buying.
Semi-knocked-down assembly (SKD) takes a vehicle substantially built elsewhere and dismantled for shipping, or a body that arrives already welded and painted. The local operation bolts on wheels, seats, glass, bumpers and fluids, tests the vehicle and issues the paperwork. It takes a shed, a hoist, a small team and a few months to start. Local value added is typically in the low single digits of the vehicle’s price, and a line producing a few thousand units a year employs tens to low hundreds of people. Its purpose is almost always tariff arbitrage: a kit attracts a lower duty than a finished car.
Completely-knocked-down assembly (CKD) takes the vehicle apart further. The body arrives as pressed panels to be welded and painted locally, so the plant needs a body shop and a paint shop, the two most capital-intensive parts of a vehicle factory. Capital cost rises by an order of magnitude, minimum efficient scale rises with it, and local value added rises into the low tens of percent. Employment per vehicle rises much less than the investment does, because paint shops are automated.
Full assembly means CKD plus a supplier base: firms in the country making the seats, harnesses, glass, castings and stampings, so that a rising share of the kit is no longer imported. This is the only one of the three that creates the tier-one and tier-two employment dwarfing the assembler’s own payroll, and the only one that produces the learning the export test is supposed to discipline. It requires volume no single African domestic market could supply, which is why the two countries that have it both got there by exporting.
Sort the continent’s plants on that scale and the picture in Figure 15.3 follows. Of the twenty-seven assembly sites this chapter maps, thirteen run full assembly, five run completely-knocked-down lines, eight run semi-knocked-down lines and one is an announcement; ten of the thirteen full-assembly plants are in Morocco and South Africa. The arithmetic of the other two categories is unforgiving. Nigeria has almost forty licensed assembly plants with installed capacity above 600,000 units a year, running at about 5 percent of that capacity (NADDC, 2026). Ghana’s programme drew seven assemblers with combined installed capacity near 140,000 units a year, and in 2024 its Volkswagen line built 352 vehicles against a nameplate of 5,000, its Nissan line 815 and its Toyota line 999 against a nameplate of 1,500 (Graphic Online, 2026). Those are not factories in any sense recognized in Aichi or Wolfsburg. They are import channels with a policy attached, and counting them as industrialization is exactly the error the value-added series exists to prevent.
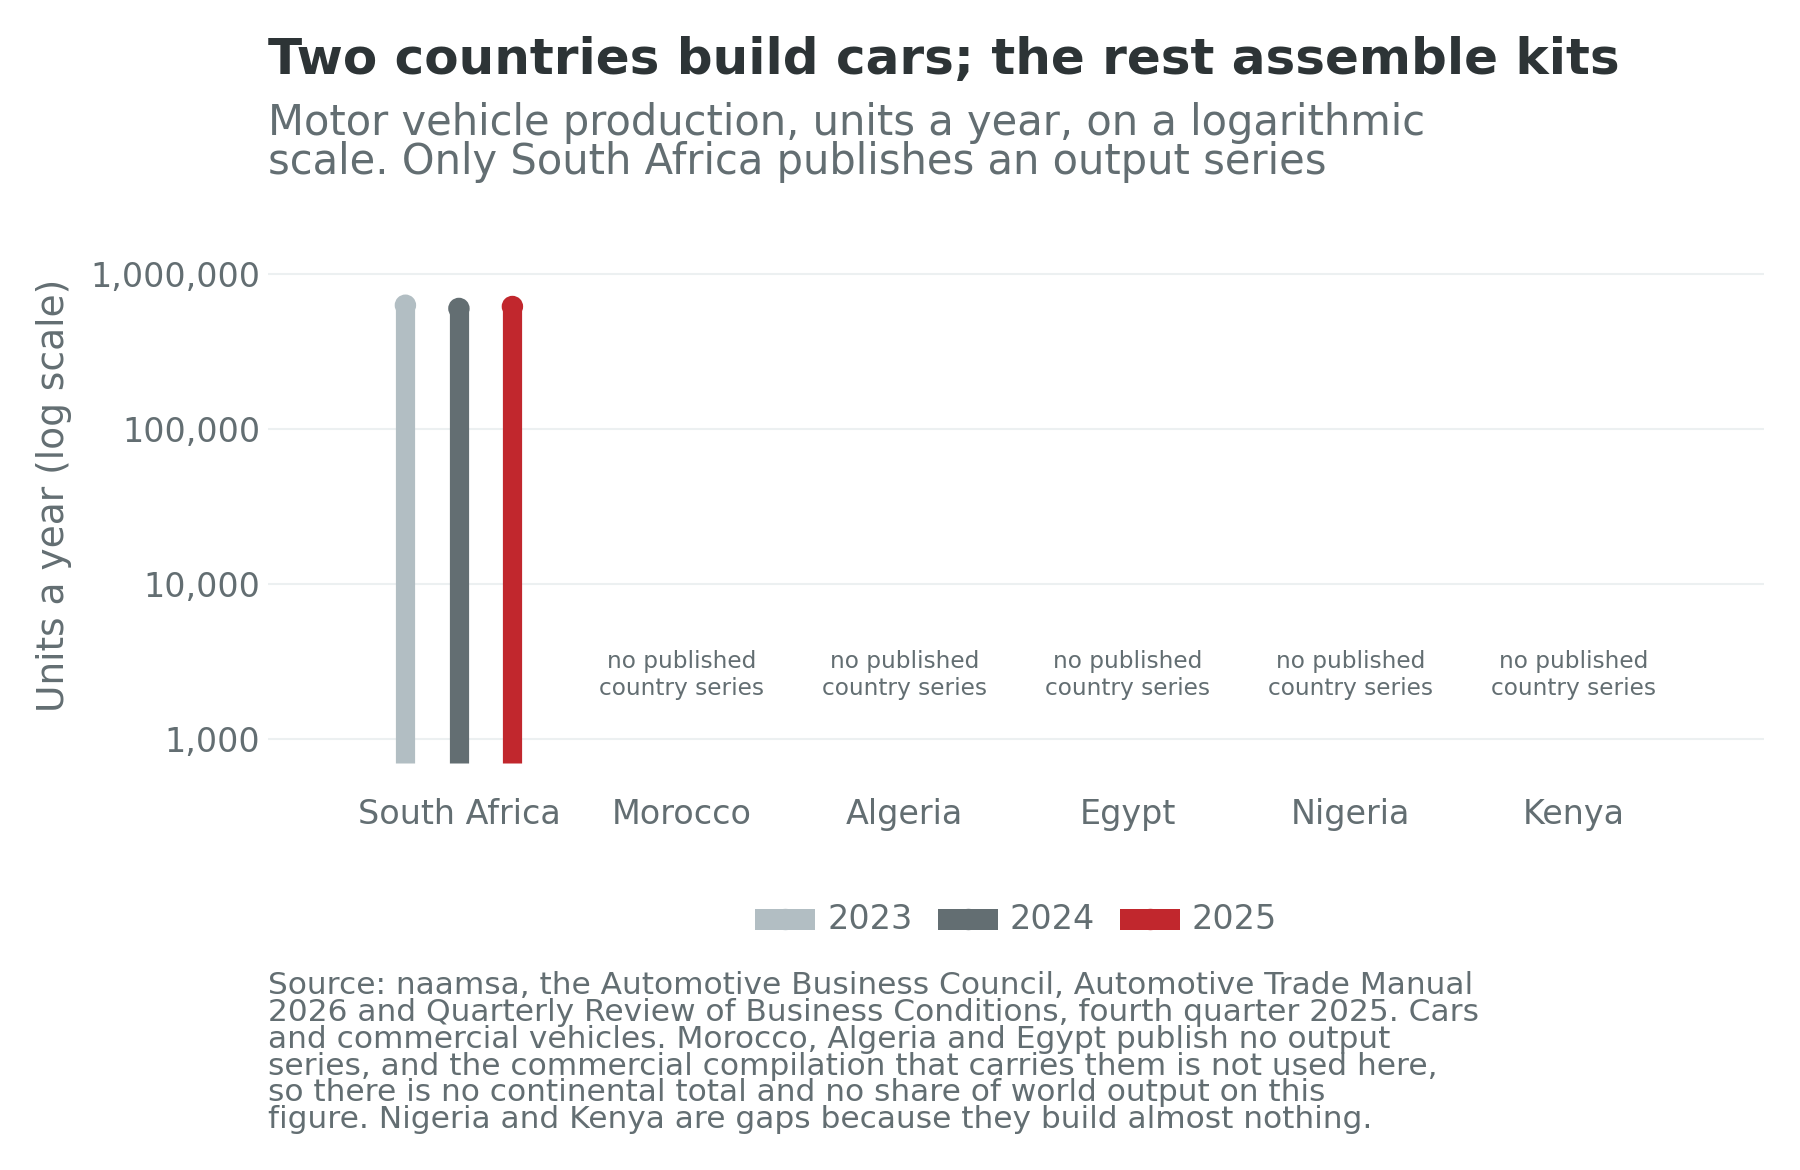
South Africa built about 630,000 vehicles in 2023, 600,473 in 2024 and 618,077 in 2025, figures its own industry body publishes and which are therefore known to the unit (naamsa, 2026). Morocco’s are not. The continent’s other car-maker publishes no output series: its industry and trade minister said in December 2025 that the number of cars manufactured had passed a million through the year, against 560,000 in 2024, but other reporting of the same milestone describes it as capacity, and the arithmetic favours capacity, since Renault built 413,614 vehicles at Tangier and Casablanca in 2024 and Stellantis Kenitra’s nameplate is about 450,000 (Renault Group, 2025). Algeria’s restarted programme and Egypt’s assembly lines publish nothing either. Neither does the continent: a total for African vehicle production exists, and it exists inside a commercial compilation this book does not use, which is why there is no continental figure in this section and no share of world output. The absence of Nigeria and Kenya from the list of producers is not a gap in the sources. Nor, it turns out, is the absence of almost everything else. That is the finding.
The other four fifths of the sector
The auto industry gets the attention and is not the sector. Five other activities carry most of African manufacturing value added and almost all of its employment.
Apparel is the entry rung, and it is entry-level for a reason: a cut-make-trim operation needs sewing machines, a shed, a trained supervisor and a buyer, and it can be stood up in months and closed in weeks. The fabric usually comes from Asia, which is why the third-country fabric provision of the American trade preference mattered more to African apparel than the tariff line itself, and why value added per garment is thin. Cement is the opposite case, and the most successful African manufacturing story of the past twenty years: it is heavy relative to its value and cannot be shipped far overland, so the effective market for a plant is a radius of a few hundred kilometres and a producer competes with imports at the coast and with nobody inland. That single physical fact created a continental industry where a tradable one had failed, and it is the reason the firm in Section 9 exists.
Food processing and consumer goods are, in most African countries, the largest manufacturing employers and the least discussed. Milling, brewing, edible oils, sugar, soap and packaging dominate the manufacturing payroll from Dar es Salaam to Dakar, in plants owned by regional groups such as Bidco in East Africa and Promasidor in West Africa and by the local subsidiaries of Unilever and Nestlé. Their economics are the economics of distribution rather than of exporting: the constraint is reaching a million small shops, not clearing a foreign customs post. That makes them resilient and caps their productivity growth, since a firm whose advantage is a distribution network does not learn from a demanding foreign buyer. Pharmaceuticals arrived on the agenda in 2021 and have not left it: the continent made on the order of one percent of the vaccine doses it used when the pandemic began, and the African Union’s response was a partnership targeting 60 percent of the continent’s routine doses made in Africa by 2040 (Africa CDC, 2021). The building has gone faster than the buying, which Section 9 illustrates. Steel and fertiliser complete the list, energy-intensive, built at scale in Egypt, Morocco, Nigeria and Algeria on the back of gas and phosphate rather than of labour, and incapable of moving term two.
3. Industry structure
Four kinds of firm make things in Africa, and they answer to different logics.
The multinationals are the assemblers, the brewers and the consumer-goods companies. What they bring is a technology, a brand and a market; what they do not bring is a decision right. A regional plant of a global assembler is a cost centre in somebody else’s network, and the decision to add a shift, a model or a supplier is taken at headquarters against a global capacity plan. That is the sense in which Chapter 28’s question, whether Morocco bought an industry or rented one, is the right question for every multinational plant on the continent.
The African conglomerates are the most interesting structure and the least studied: Dangote in Nigeria, spanning cement, sugar, fertiliser and refining; the Mansour Group in Egypt; Elsewedy Electric, profiled in Chapter 27; Bidco in Kenya; Innoson in Nigeria. They share a shape, family-controlled, diversified across regulated and infrastructure-adjacent sectors, financed by retained earnings and bank debt rather than equity, and dependent on a working relationship with the state for land, licences, tariffs and foreign exchange. That shape is a rational response to the environment Chapter 5 describes, and its cost is that the group’s growth is bounded by the family’s capital and by the durability of its political relationships.
The state firms are fewer than they were and larger than the textbooks assume: Morocco’s phosphate group, Egypt’s military-linked industrial enterprises, Ethiopia’s metals and engineering corporation, Algeria’s public steel and vehicle ventures, each read inside its own political settlement in Chapters 27, 28 and 29. African state manufacturing has done best where the output is a commodity sold into a world market that will not buy patriotism, and worst where the output is sold at home.
The informal workshops are the largest employer of all, and Chapter 6 owns them. The jua kali yards of Nairobi, the roadside metalworking sheds of every West African city and the furniture, garment and car-parts workshops of Cairo employ vastly more people than every licensed factory on the continent put together, at a productivity Chapter 6 shows does not rise. What belongs here is the connection: Kruse, Mensah, Sen and de Vries (2023) find manufacturing employment shares rising again across the developing world in the 2010s, including in Sub-Saharan Africa, and concentrated in exactly these small and largely informal firms. A manufacturing renaissance made of unregistered workshops is a real increase in the sector’s employment share and not the escalator the recipe requires, because a workshop does not learn from a foreign buyer and cannot be disciplined by an export test it never faces.
4. Geographic distribution
Manufacturing in Africa is not spread across countries; it is concentrated in a small number of places, almost all of them within a short drive of a deep-water port or a border with a rich market.
The vehicle industry sits in two clusters and a scattering. The first runs along the Moroccan coastal axis of Chapter 28, from the Kenitra plant north to the Tangier free zones beside the port, with the older Casablanca plant to the south. The second is the South African complex of Chapter 25: Rosslyn and Silverton in Tshwane, Kariega, Gqeberha and East London in the Eastern Cape, and the Durban plant beside the container terminal. The scattering is everything else, kit lines outside Cairo, Oran, Lagos, Kaduna, Enugu, Accra, Tema, Nairobi, Thika, Mombasa, Addis Ababa and Kigali, most serving a protected domestic market rather than an export one. The chapter’s data file on the book site lists twenty-seven of those sites with their marque, assembly type and location, reconciled against the production series wherever one exists, which on this continent means South Africa’s alone (AllAfrica, 2026), and it is what the Growth Pole Map will draw when its industry layers load.
Apparel is concentrated differently, in zones chosen for a trade preference rather than for a port: Hawassa and the other Ethiopian parks of Chapter 29, the Kenyan export-processing zones at Athi River and around Mombasa, the Lesotho plants at Maseru and Maputsoe that supply the American market from inside the customs union of Chapter 25, and the Malagasy and Mauritian plants that were the original African cut-and-sew industry. Cement alone has a genuinely continental footprint, for the transport-cost reason given above, and food processing follows population rather than ports.
5. Workforce
The workforce question in African manufacturing is not how many but who, on what terms, and for how long.
Start with the fog. No country card carries a manufacturing employment line, and Chapter 10’s rule applies with full force: thirty-four of the fifty-four countries have run a labour-force survey within five years, and the sectoral detail that would let anyone count factory workers reliably exists in fewer than that. Ethiopia’s last survey was in 2021, before the trade preference lapsed and before the currency was floated, and its confidence flag is low. Any statement about how many Ethiopians work in a factory today rests on a park operator’s returns.
What can be said with confidence is the shape of the workforce. Apparel employs young women, overwhelmingly, and it is usually their first wage job. Kenya’s textile and apparel sector directly supported 66,804 jobs in 2024, and Lesotho’s, proportionally the largest in Africa, employs between thirty and forty thousand people, mostly women (UNCTAD, 2025a). Ethiopia’s parks employ more than a hundred and fifty thousand, and Chapter 29 gives that figure with the qualifications it needs. Vehicle assembly employs men, mostly, at wages several multiples of the apparel wage, in numbers an order of magnitude smaller per unit of capital.
The uncomfortable finding is about the quality of the rung. Blattman and Dercon (2018) randomized offers of Ethiopian factory work and found that most who took the job quit within months, that a year later there was no effect on employment or income, and that reported health problems rose; the five-year follow-up did not overturn it. The conclusion is not that industrial jobs are bad, and not that Africans do not want them; it is that at the wages and conditions on offer in a low-productivity entry-level plant, the job was not clearly better than the informal alternative, and workers behaved accordingly. A rung that people step off is not a ladder.
That has a direct bearing on the identity. If the entry wage is close to the informal earnings the worker already had, the factory raises measured output per worker without raising household income, which is term three moving while the thing term two is supposed to deliver does not arrive. Set beside it Chapter 28’s finding for Morocco, where wages are a multiple of Ethiopia’s and the plants are stable, and the trade-off comes into focus: the plants that pay enough to hold a worker are the plants that automate enough not to need many.
6. Regulation and policy
Six instruments recur, and they interact badly. Two of them, special economic zone law and local content, are described in Section 2 and are not restated: what belongs here is that every country in Table 15.1 has a zone statute, that Ethiopia’s ten public parks are the largest such programme in Sub-Saharan Africa, and that the recurring local-content failure is a rule written as a percentage without an auditable denominator, which the assembler then satisfies on paper.
Import bans and tariffs. Nigeria is the reference case and the cautionary one. Its tariff on fully built imported vehicles has run at up to 70 percent, made of a 35 percent duty and a 35 percent levy, which on the theory of the policy should have made local assembly irresistible; the 2026 fiscal-policy measures then cut the import levy on used vehicles from 15 to 5 percent and on new ones from 20 to 10, effective July 2026 (Chioma, 2026). Chapter 9 states the general result and Chapter 24 the local one: protection without an export test produced six decades of assembly at a few percent of capacity, and an output-per-worker series that fell at 1.94 percent a year over the decade to 2024. Ghana has taken the same road from the other end, adopting a standard barring the import of vehicles more than ten years old from October 2026 while the government elected in 2025 has undertaken to reverse the used-vehicle restrictions (Ghana Standards Authority, 2026).
Behind both sits the second-hand trade, which is the real competitor. African countries took about 40 percent of the roughly 14 million used light-duty vehicles exported worldwide between 2015 and 2018, most of them between sixteen and twenty years old (UNEP, 2020). Nigerians call an imported second-hand car tokunbo, “from across the seas”, and the trade employs importers, clearing agents, mechanics and parts dealers in numbers no assembly plant will match, so any vehicle policy here is first a policy about that trade, against a constituency larger and better organized than the one for the plant. The apparel version is the same argument in cloth: mitumba, the imported second-hand clothing sold in the bales it arrives in, is what an East African textile mill actually competes with, and the periodic attempts to ban it are the cleanest natural experiment the continent offers on infant-industry protection. The West African wax-print market, the pagne trade, was lost to imported prints on the same logic.
The automotive programmes. South Africa’s is the oldest and the only one disciplined by exports, and Chapter 25 gives its mechanism and its bill. Ghana’s and Nigeria’s development plans copied the structure without the export test, with the results in Box 15.1. Kenya’s duty-remission arrangement, which relieves duty on kits for approved assemblers, is the most modest and arguably the most honest of the four: it does not claim to be building an industry, only to be moving the final assembly step onshore, and local assemblers supplied about 78 percent of the new vehicles sold through formal dealers in the first eleven months of 2022 (Mwenda, 2022).
Rules of origin under the continental agreement are unfinished on automotives and on textiles and clothing, as Chapter 7 sets out, and that is the single most consequential piece of pending African trade law for this sector, because a continental rule is the only route by which an African plant could reach the volume full assembly requires.
AGOA. The American preference is the reason there is an African cut-and-sew industry at all, and its terms have never been the exporter’s to set. It lapsed in 2025 and was restored retroactively, for a single year to the end of 2026, by a law enacted in February 2026 (United States Congress, 2026). During the lapse, Kenya’s trade-weighted average American tariff rose from about 10 percent to about 28 percent, Lesotho’s from about 15 to about 32, and Madagascar’s to about 23 (UNCTAD, 2025a); orders were cancelled, lines slowed and some plants closed. Chapters 29 and 33 carry the history and the alternatives. The point here is Chapter 9’s about leases: a development strategy whose terminal market is renewed by a foreign legislature in one-year increments is not a strategy in the sense the recipe requires, and the firms that read the renewal calendar correctly are the ones that never sank capital into a body shop.
7. Recent trends
The critiques, in one place
Rodrik (2016) established that manufacturing employment now peaks earlier and at a lower share of the workforce than it did for the early industrializers, so that developing countries begin to deindustrialize at income levels far below those at which Britain or Korea did; Diao, McMillan and Rodrik (2019) put the African version directly, that the growth boom of the 2000s ran through domestic demand, public investment and reallocation into services rather than through workers moving into tradable industry, which is why it did not compound; and underneath both sits the dual-firm finding Chapter 6 owns (Diao, Ellis, McMillan and Rodrik, 2021).
Against that, Kruse, Mensah, Sen and de Vries (2023) find manufacturing employment shares rising again in the 2010s, including in Sub-Saharan Africa, in small and largely informal firms, and Newfarmer, Page and Tarp (2018) argue that horticulture, tourism, logistics and tradable business services, which they call industries without smokestacks, share manufacturing’s useful properties of tradability, scale economies and technology absorption, so that the recipe’s second stage is a category rather than a sector. Chapter 9 gives the cards’ unfriendly verdict on that: the two clearest African services-led growth stories, Ghana and Kenya, hold the fifty-second and the fiftieth places of fifty-three on the employment ratio. Meanwhile the policy climate has turned. Juhász, Lane and Rodrik (2024) document the return of industrial policy to respectability, with a franker account of what the evidence supports than the field allowed itself a decade ago, and the African contributions to that revival are worth reading first rather than last: Oqubay (2015) on Ethiopian industrial policy written from inside it, Cramer, Sender and Oqubay (2020) on why the useful questions are about particular sectors, firms and labour markets rather than about models, and Newman and colleagues (2016) for the firm-level evidence underneath both.
Electrification, and the second rung a machine takes
The transition to electric drive changes what an African assembly plant is for. An electric vehicle has far fewer moving parts, no engine, no gearbox and no exhaust system, which removes much of the tier-one and tier-two content a supplier park exists to make, and substitutes a battery pack, the most valuable single component and the one whose supply chain is anchored in Asia. A country that spent twenty years building a supplier base for internal-combustion vehicles holds an asset whose value declines with the customer’s product plan, which is why Chapter 28 reads the Moroccan investments in electric platforms and battery capacity as a defence of the cluster rather than an expansion of it. Morocco has one further card: the cobalt, phosphate and manganese of Chapter 13 give it a claim on the battery chain a pure assembler would not have.
Chapter 1 set out the assumption underneath the identity and the world in which it fails, in which the frontier of production is a stock of machines and energy rather than of workers. No sector is more exposed to that assumption than this one, because manufacturing is where the assumption has historically been cashed. In the labour-abundant world this chapter’s argument is about sequencing: the rung is narrower than it was and it exists, the countries that reach it are the ones with a port, a market and a rule of origin, and the policy job is to convert kit assembly into full assembly by making volume available across borders, which is Chapter 7’s unfinished business.
In the labour-redundant world the second rung is the first a machine takes. Cut-and-sew apparel and entry-level assembly are the tasks automation reaches earliest, being repetitive, indoors and performed on standardized objects. Ethiopia has already had that rung removed once, by a political decision rather than by a robot, and Chapter 29 records what a single year of it did to Hawassa. What survives is the part of manufacturing that is capital-intensive from the start and sited where the inputs are: cement near limestone, fertiliser near phosphate and gas, steel near ore and power, battery chemicals near cobalt and copper. That is a term-three sector with almost no term-two content, the configuration Chapter 25 shows an economy cannot live on. The awkward corollary is that the industries-without-smokestacks alternative is not obviously safer: a business-process centre is the first service a model replaces, and a horticulture pack-house is a cold room with a conveyor. What survives both worlds is tied to a physical input a machine cannot relocate.
8. Climate exposure
Two exposures bind on African manufacturing and neither is a weather event. The first is power. A factory that cannot be sure of electricity buys a generator, and diesel-generated power costs several times grid power, which is a tax on precisely the energy-intensive activities the continent has the best case for hosting; Chapter 25 records what three years of rotational blackouts did to South African firms and Chapter 14 carries the generation argument. The second is the European Union’s carbon border adjustment mechanism, which will price the embedded carbon of imported cement, steel, aluminium and fertiliser at the European frontier. That hits African exporters twice, once on the carbon intensity of the product and once on the carbon intensity of the grid it was made with, and it hits hardest exactly the heavy industries that Section 7 identifies as the part of manufacturing most likely to survive the labour-redundant world. Chapter 34 carries the climate-finance argument; the point here is that a continent with the world’s cleanest potential grid is being charged for the dirtiest one it currently has.
9. Firm profiles
Dangote Cement, Lagos
The reason to profile Dangote Cement is that it is the clearest case of an African firm building a continental industrial business without a trade preference, an export market or a foreign parent, and the physics of its product explain how.
The group reported revenue of 4,306.7 billion naira, ₦, in 2025, up 20.3 percent on the year, and profit after tax of ₦1,014.9 billion, more than double the previous year’s; it holds installed capacity of 55.0 million tonnes a year, operates in eleven African countries and employed 20,614 people at the end of the year (Dangote Cement, 2026). Those are the numbers of a genuinely large industrial company, and by African standards there are very few.
Three things make it instructive. The first is Section 2’s: cement is uneconomic to ship far overland, so a plant inland faces no import competition, and the strategy has been to build inland across a dozen countries rather than to put one export plant at a port. That is import substitution that works, and it works through transport costs rather than tariffs, a distinction the Nigerian policy debate has repeatedly missed. The second is the balance-sheet point of Chapter 21: the group financed its expansion out of retained earnings and domestic bank debt inside a foreign-exchange regime that made dollar borrowing dangerous, which is why the naira, symbol ₦, dominates its accounts. The third is the counter-case. A near-dominant position in a non-tradable good is a pricing position, and Nigerian cement prices have been the subject of parliamentary inquiry more than once. A firm that cannot be disciplined by imports has to be disciplined by a regulator, and Chapter 5 is the reason to doubt that it will be.
Innoson Vehicle Manufacturing, Nnewi
Innoson is the continent’s one indigenous vehicle maker of any scale, and what it demonstrates is the size of the gap rather than the closing of it.
The firm grew out of a motorcycle-parts import business in Nnewi, the south-eastern Nigerian town whose auto-parts traders are the best-documented industrial cluster in West Africa, and it builds buses, pickups, sport utility vehicles and three-wheelers, with a stated output the founder put in 2023 at 50,000 units a year, rising to 60,000 if demand allowed, and local content he puts at not less than 65 percent (Oghifo, 2023); it showed Nigeria’s first locally produced electric model in September 2024 (Okorie, 2024). Every one of those figures is the company’s own, which is why they are given as claims rather than measurements, and there is no published production series against which to check them.
The interest of the case is the environment rather than the firm. Innoson sells into a market where a twenty-year-old imported vehicle is the default purchase, where the tariff on a new import has swung by tens of percentage points inside three years, where the currency has moved by a factor of three, and where the electricity for a body shop has to be self-generated. That it exists at all is an achievement. That it has not grown into the volumes at which a supplier base forms is a statement about all four of those conditions and about the missing continental rule of origin of Chapter 7.
Huajian, Dukem and Addis Ababa
The Chinese shoemaker Huajian is the test case for the most influential idea about African manufacturing of the last fifteen years, Lin’s proposition that as Chinese wages rise, labour-intensive manufacturing will relocate to the continent in a flying-geese pattern (Lin, 2012).
The firm opened in Ethiopia in 2011, in the Chinese-built Eastern Industrial Zone at Dukem outside Addis Ababa, making shoes for American and European brands; it opened a second plant in its own industrial park near the capital in 2016, and at its peak the two together employed more than 7,000 Ethiopians. Output then stopped for more than three years, on a combination of the pandemic, Ethiopia’s removal from the American trade preference and supply-chain disruption, and resumed in March 2023 (Addis Fortune, 2026).
The sequence is the chapter in miniature. The relocation thesis was right: the firm came, hired at scale, trained and exported. The vulnerability was in everything around it. A plant whose customer is a foreign brand, whose market access is a foreign statute, whose inputs are imported and whose profits need a foreign-exchange allocation has four points of failure a Guangdong plant does not have, and three of the four fired at once. The workers who lost those jobs did not lose them because Ethiopian labour became uncompetitive.
Aspen Pharmacare, Gqeberha
Aspen is the sharpest available test of whether Africa can manufacture what Africa buys, and the answer so far is that manufacturing capability is the easy half.
Africa’s largest pharmaceutical manufacturer had group revenue of R43.4 billion in the year to June 2025, the rand’s symbol being R, and runs a sterile manufacturing site at Gqeberha in the Eastern Cape (Neethling, 2025). In March 2022 it completed a deal to package, sell and distribute an Aspen-branded version of Johnson & Johnson’s COVID-19 vaccine, Aspenovax, for Africa from that plant. By May it had not received a single order for it (Reuters, 2022), at a moment when the continent’s vaccination rates were among the world’s lowest and its procurement was running on donated doses, and the line stood idle. The rescue was a ten-year agreement with the Serum Institute of India to make four routine vaccines for African markets, with $30 million, $15 million each from the Gates Foundation and the Coalition for Epidemic Preparedness Innovations, funding the technology transfer (Dludla, 2022).
The lesson is about procurement rather than industry, and it generalizes well beyond vaccines. Building the plant was achievable and Aspen did it. What no plant can supply is a buyer willing to pay a few cents more for a locally made dose than for an imported one, and African public procurement, much of it financed by donors with their own supplier arrangements, was not that buyer. The African Union’s 2040 target is therefore a demand-side commitment dressed as an industrial one, and whether it binds is a question about tender rules rather than about factories.
10. What the experiments say
Four findings, three of them randomized
This box mixes designs on purpose, and says which is which. Three of the four are randomized controlled trials; the fourth is not an experiment at all, and is included because the question it answers cannot be randomized.
Exporting teaches, and the teaching is measurable. Atkin, Khandelwal and Osman (2017) randomly allocated export orders to Egyptian rug producers through an intermediary and found profits 16 to 26 percent higher than controls, with a rise in the measured quality of output on rugs made to a common specification. Chapter 9 uses this as the demonstration of the recipe’s central mechanism and this chapter will not restate it; what belongs here is the boundary condition. The firms learned because a demanding buyer told them what was wrong. A kit assembler’s buyer is a domestic motorist behind a tariff wall, and no learning of that kind is on offer.
Small firms are constrained by labour they cannot find, not only by wages they cannot pay. Hardy and McCasland (2023) offered small Ghanaian firms an apprentice at no cost across thirty-two districts and five trades, including welding and carpentry, and each placement offered raised firm size by about half a worker and profits by about 10 percent. Chapter 6 owns the finding. Its relevance here is that the small-firm manufacturing renaissance Kruse and colleagues identify is made of exactly these firms, and that the binding constraint on their employment is a matching problem cheaper to fix than a productivity problem.
Getting a worker to a factory gate is a real constraint and a small one. Abebe, Caria, Fafchamps, Falco, Franklin and Quinn (2021) ran a transport subsidy for job search in Addis Ababa against a two-day workshop helping applicants document skills an employer could not otherwise observe. Both worked, both helped the most disadvantaged most, and both worked by fixing distance and information rather than by creating a vacancy. Set that beside Blattman and Dercon (2018) in Chapter 29, in which the vacancy existed and the worker left it, and the pair bracket the problem: the constraint is not that Ethiopians cannot reach the parks, and it is not that they will not take the jobs. It is what the job is worth once they have it.
The competition finding, which is not an experiment. Edwards and Jenkins (2015) measured the effect of Chinese import competition on South African manufacturing and found a substantial share of the sector’s output and employment decline attributable to it, concentrated in clothing, textiles and footwear. That is an identification exercise on observational data, with the caveats that implies, and it is here because it answers the question an industrial policy in an open middle-income economy actually faces. The competitor is not the absence of a plant. It is a Chinese plant with thirty years of learning, and Section 1’s third answer to Chapter 9’s question rests on this evidence rather than on an experiment.
11. Data sources
- UNIDO industrial statistics, including the Industrial Statistics Factsheet: Africa: manufacturing value added by country, in level and in share of GDP, and the continental shares. The book’s rule is that this series, and not a plant announcement, measures the sector.
- World Bank World Development Indicators: manufacturing value added as a share of GDP where the UNIDO series has no current year, on the national-accounts basis each country publishes, which is why Nigeria’s figure moved with its rebasing.
- naamsa, the Automotive Business Council: South African vehicle production, from the industry’s own body, which is the only African country that publishes an output series. The international compilation that carries the others is a commercial product and this book does not use it, which is why this chapter has no continental total.
- naamsa, the African Association of Automotive Manufacturers and AMICA: assembler, export and supplier detail for South Africa, the continent and Morocco respectively.
- NADDC, the Ghana Automotive Development Policy returns and the Kenya Motor Industry Association: licensed assemblers, capacity and volumes in the three markets no open production series covers.
- UNCTAD and UNEP: the trade-preference exposure of African apparel exporters and the used-vehicle trade.
- Company reports: Dangote Cement, Aspen Pharmacare and the assemblers named in the text.
- Country cards: the identity terms, the wage-employment and non-agricultural overlays, the within-and-between split and the data-quality fields in Table 15.1. The cards carry no sector fields, so no production, employment or export-composition figure here comes from them.
12. Exercises
Connections to other chapters
- Chapter 6 (The Informal Economy) owns the workshops that are the largest manufacturing employers on the continent, and the apprenticeship experiment this chapter’s evidence box cites; Chapter 10 (Labor, Youth, and Migration) owns the middle term, the overlays and the survey coverage Section 5 works under.
- Chapter 7 (Regional Architecture) owns the continental agreement’s unfinished rules of origin on automotives and on textiles and clothing, this sector’s most consequential piece of pending law, and Chapter 19 (Trade, Logistics, and Ports) the corridor machinery that decides whether a kit reaches a line on time.
- Chapter 9 (The Studwell Recipe Applied) hands this chapter its central question, why the two export-disciplined African programmes delivered the third term and not the second, and Section 1 answers it.
- Chapters 13 and 14 (Critical Minerals; Energy) carry the inputs the surviving, capital-intensive half of the sector depends on, and Section 8’s power constraint.
- Chapters 25, 27, 28 and 29 (Gauteng; Cairo-Suez; Casablanca-Tangier; Addis-Djibouti) own the four places this chapter’s industry lives, and their firm profiles are not repeated here.
- Chapter 33 (The Other Partners) carries what replaces the American trade preference, and Chapter 35 (Scenarios) the labour-redundant world Section 7 sketches.
Discussion questions
Knocked-down assembly creates a small number of jobs and almost no local value added, and it is nonetheless the form almost every African vehicle policy has produced. State the conditions under which an SKD line is a rung on a ladder rather than a permanent floor, then name the observation, available within five years, that would tell you which one a given country is on.
Chapter 9 finds that Morocco and South Africa, the two African economies that have applied the export test longest, both post an employment-ratio growth of minus 0.45 percent a year. This chapter offers four explanations: the sector’s small denominator, the capital intensity of modern assembly, the displacement of existing manufacturing employment, and a labour market that half the adult population does not enter. Rank them by how much of the finding you think each carries, and say what evidence would move your ranking.
Hawassa and Tangier are both export-mandated industrial zones with power, customs treatment and serviced land. Name the differences you think decided their records, say which of them a government can actually choose, and then argue the opposite case: that the zone was never the causal variable in either place.
Try it
Open the three cards side by side: Morocco, Ethiopia and Nigeria, three countries that each bet on manufacturing and got three different things. Read down the identity block, then the wage-employment and non-agricultural overlays, then the data-quality block. Write one paragraph on a single question: which of the three would you say has the most manufacturing, and does your answer change depending on whether you use the productivity term, the wage overlay or the number of assembly plants? Then open the Growth Pole Map and switch on the auto-plants layer, which plots the assembly plants this chapter names with the kind of assembly each does, full manufacture or kits. Count the plants in each of the three countries, then turn on the confidence toggle and note that two of the three hatch out.
Data exercise
Download all fifty-four cards from the country cards page on this site, as cards.csv or as cards.json if you want the release each number came from travelling beside it, and take the chapter’s data file of manufacturing value added from the same page. Build a table with four card fields, identity.employment_to_wa_growth, identity.output_per_worker_growth, overlays.wage_employment_share and data_quality.confidence_flag, and join the manufacturing share of GDP onto it for the ten countries that have one. Then do four things. First, rank the ten by manufacturing share and again by wage-employment share, and report how far apart the two rankings are. Second, test whether a higher manufacturing share goes with a higher second term, and say honestly what a sample of ten can support. Third, drop the two cards whose confidence flag is low, note which countries they are, and say which of this chapter’s claims depend on them. Fourth, confirm from the cards that balance_sheet.exports_top3 is empty on all fifty-four, and write two sentences on what a sector chapter can and cannot say without it. Treat nulls as missing, never as zeros.
Further reading
- Dani Rodrik, “Premature Deindustrialization” (2016), for the finding that shapes the whole debate, with Xinshen Diao, Margaret McMillan and Dani Rodrik (2019) for the African version and Hagen Kruse, Emmanuel Mensah, Kunal Sen and Gaaitzen de Vries (2023) for the qualifier.
- Réka Juhász, Nathan Lane and Dani Rodrik, “The New Economics of Industrial Policy” (2024), for the state of the field after the revival.
- Arkebe Oqubay, Made in Africa (2015), and Christopher Cramer, John Sender and Arkebe Oqubay, African Economic Development (2020), for the argument from inside African industrial policy, with Carol Newman and colleagues, Made in Africa: Learning to Compete in Industry (2016), for the firm-level evidence.
- Richard Newfarmer, John Page and Finn Tarp, eds., Industries without Smokestacks (2018), for the case that the second stage is a category rather than a sector.
- Justin Yifu Lin, New Structural Economics (2012), for the relocation thesis the Huajian profile tests.
- The New Regional Economics, chapter 14 (Wilse-Samson, 2026), for the automotive and textile value chains this chapter cites rather than repeats.