31. Where the State Is Thin
Pole type: thin-state, twice over.
Two national capitals face each other across about four kilometres of the Congo River, closer than any other pair on earth, with something over 14 million people between them, and there is no bridge. The larger of the two countries behind them holds 109.3 million people, will hold 218.2 million by 2050 and 430.7 million by 2100, and last ran a scientific census in 1984.
Learning Objectives
After reading this chapter, you should be able to:
- Describe the signature a thin state leaves in the identity: a fast first term, a second pinned near zero, and a third whose sign is set by a commodity price rather than by anything a firm did.
- Set out the balance sheet of a resource economy whose state collects little of the rent, distinguishing an infrastructure-for-minerals contract from a loan, and an oil pre-payment from a bond.
- Run a growth diagnostic whose tested branch is the state’s own reach, and defend the claim that security, a road and an enforceable contract are one constraint rather than three.
- Describe the five settlements in the vocabulary of Chapter 5, and say what makes Rwanda’s the region’s one development bargain and what makes it fragile.
- Argue about economies for which most standard series do not exist, using the cards’ data-quality fields, the confidence flag and Chapter 1’s correctives, and state what such an argument cannot establish.
Prior work: the small-scale cross-border trade of the Great Lakes, and the sequencing account of Rwanda’s recovery, are set out in the companion volume, The New Regional Economics, chapters 12 and 14 (Wilse-Samson, 2026). This chapter cites that account rather than restating it, and adds the identity, the balance sheet, the diagnostic and the data-quality layer.
Seven of the eight chapters in this part describe places where something is being built. This one describes places where the thing usually assumed, a state that reaches its own territory, is itself the variable. It is the claim that the binding question here is not whether a policy is well chosen but whether any policy chosen in the capital arrives where it is meant to. The five cards hold 149.2 million people, 9.9 percent of the continent, and produce $134.5 billion, 4.3 percent of its output.
The template runs twice rather than blending the two into an essay, because treating “the Congo” as one problem is the error this book is trying to avoid. Kinshasa–Brazzaville is a river, two capitals, a demographic engine on one bank and a petro-state on the other. The Great Lakes and eastern DRC is a mineral-conflict hinterland where one commodity is a war economy on one side of a border and an export statistic on the other, with the Central African Republic as the western extension of the same condition. The Democratic Republic of the Congo appears in both, and it is the same card each time: the eastern provinces have no card, and section B10 treats that as the finding it is. The template’s twelfth section, the exercises, is shared and sits at the end. The Sahel is not a third writeup; Chapter 36 carries it.
Part A. Kinshasa–Brazzaville
A1. The pole in the identity
Chapter 1 sets out the identity: output is output per worker times the employment-to-working-age ratio times the working-age population, so in growth rates GDP growth is approximately the sum of the three.
| Country | Term one: working-age population | Term two: employment ratio | Term three: output per worker | Implied growth | Observed growth | Gap | Wage employment (percent) | Non-agricultural employment (percent) | Confidence |
|---|---|---|---|---|---|---|---|---|---|
| Democratic Republic of the Congo | 3.38 | -0.18 | 1.81 | 5.00 | 4.83 | 0.17 | 14.7 | 41.1 | low |
| Republic of the Congo | 2.60 | -0.01 | -4.00 | -1.41 | -1.52 | 0.11 | 23.1 | 63.2 | low |
Table 31.1. Annual growth rates in percentage points, 2014 to 2024, except the last three columns. Term one is the working-age population aged 15 to 64; term two is modelled employment aged 15 and over over that population. Sources: WPP 2024, ILOSTAT (November 2025) and the WEO (April 2026), via the cards.
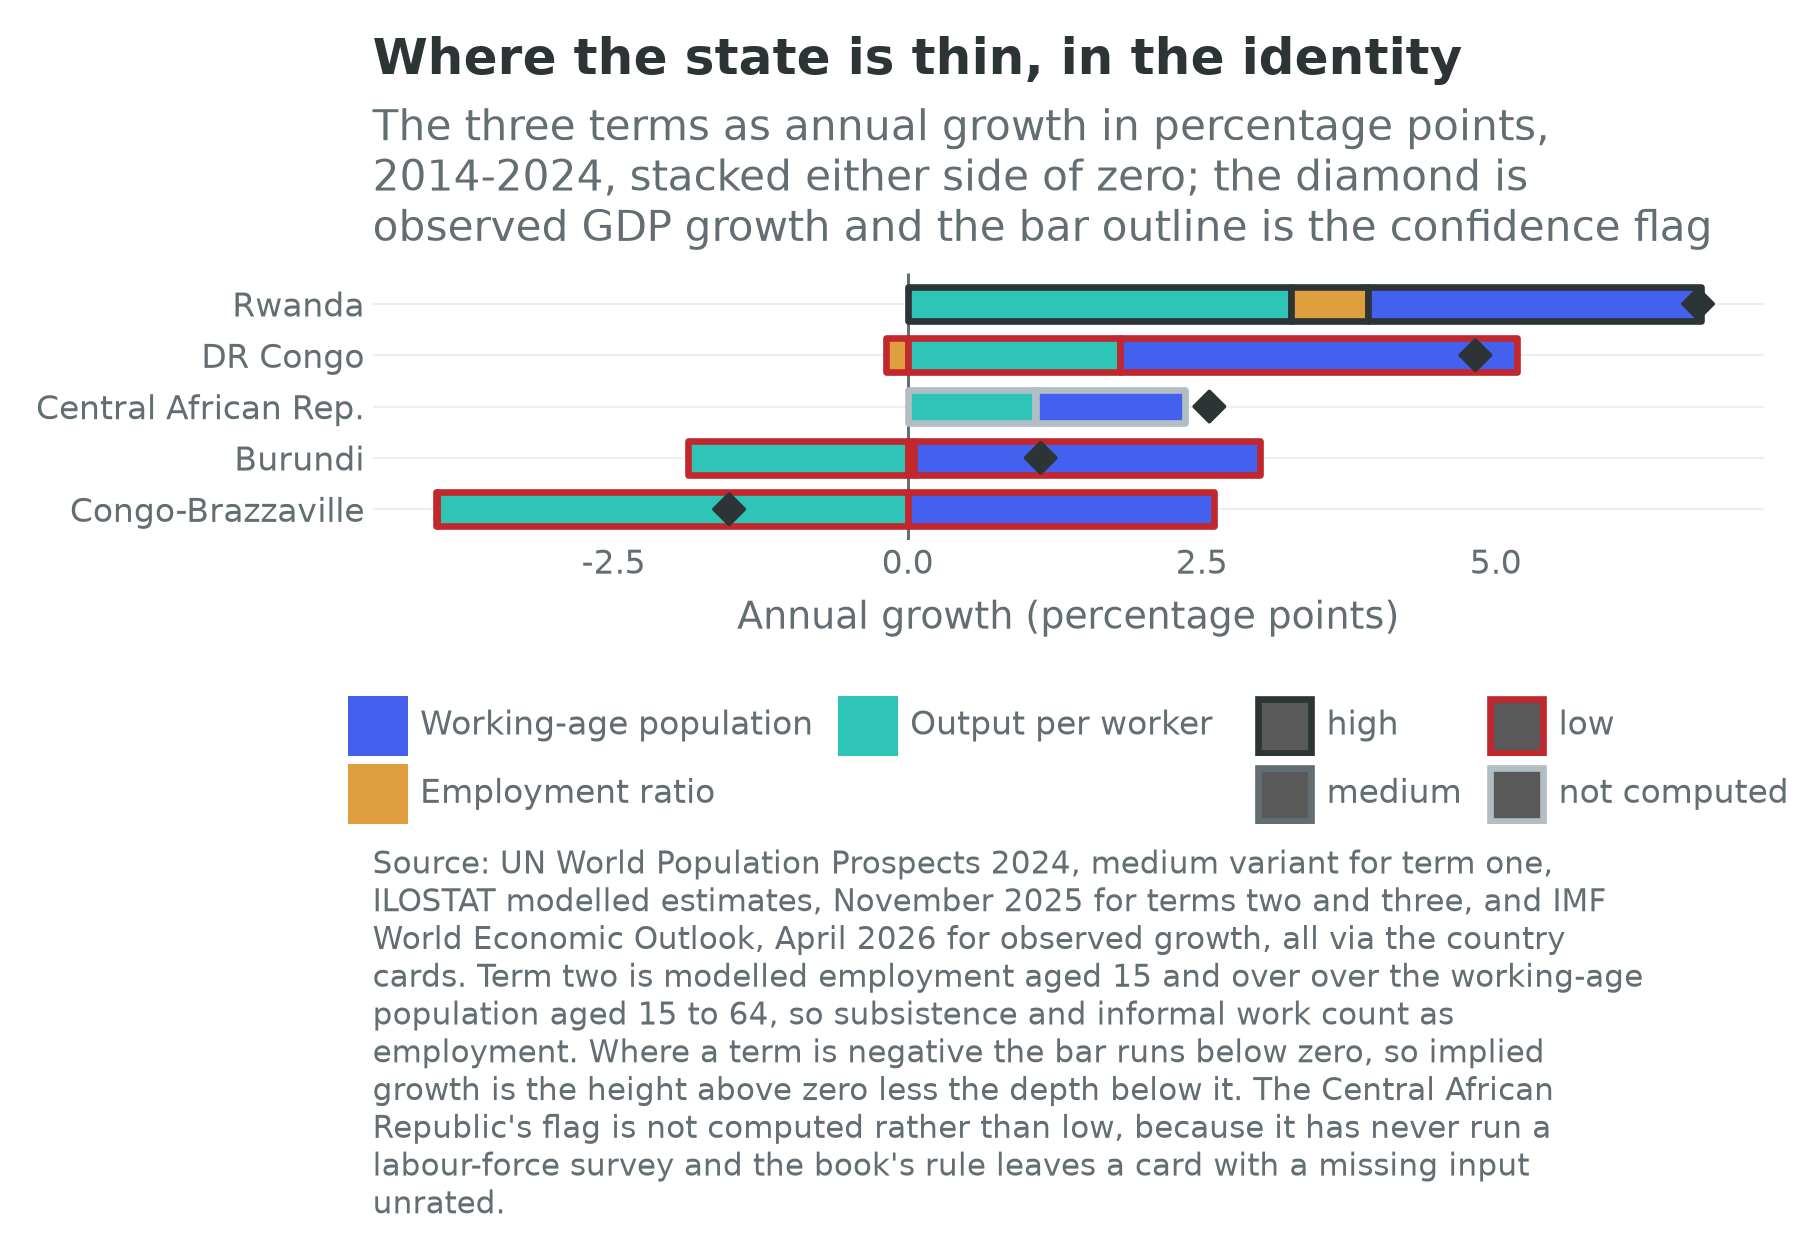
Term one is fast on the left bank and ordinary on the right. The DRC’s working-age population grew at 3.38 percent a year against a continental median of 2.89 percent, and its card carries the doubler note; Congo-Brazzaville runs at 2.60 percent on a fertility rate of 4.11 against its neighbour’s 5.98. Term two does nothing on either bank, which is the signature this chapter is about: minus 0.18 percent a year on the left, minus 0.01 on the right. Chapter 1 warned that this series flatters, and here the flattery is extreme: 97.3 percent of Congolese employment is informal, fourth highest of the 45 cards carrying the field, and 14.7 percent is waged.
Term three splits the banks apart on the oil price. The DRC posted 1.81 percent a year, above the continental median of 0.74. Congo-Brazzaville posted minus 4.00 percent, third worst of the 53 cards carrying the term, with observed growth of minus 1.52 percent, fourth worst on the continent: a decade in which output shrank while the working-age population grew at 2.60 percent a year. It still records GDP per head of $2,404 against the DRC’s $871 on a population one seventeenth the size.
Following Chapters 6, 9 and 10, term three should split within and between sectors, and neither card carries the split, because the transformation database covers 21 of the 54. Implied and observed growth differ by 0.17 and 0.11 points, so the decomposition holds arithmetically over modelled series resting on a census from 1984.
A2. The pole on the balance sheet
| Country | External debt stock (\(bn) | Multilateral (\)bn) | Official bilateral (\(bn) | Bonds (\)bn) | Other private (\(bn) | Chinese loan commitments, 2000 to 2024 (\)bn) | |||
|---|---|---|---|---|---|---|
| Democratic Republic of the Congo | 12.5 | 4.1 | 3.8 | none recorded | 0.1 | 3.4 |
| Republic of the Congo | 6.7 | 1.3 | 2.3 | 0.2 | 1.7 | 5.0 |
Table 31.2. Sources: World Bank International Debt Statistics, 2025 release, for the stock and the creditor lines, which are publicly guaranteed long-term debt and do not add to the stock; the Boston University Chinese Loans to Africa database for the commitments, a cumulative flow.
Neither is, on the face of it, heavily indebted. The DRC’s recorded external stock is 13 percent of output and there is no bond line on the card at all, which is not prudence but the residue of debt relief and of a decade in which nobody would lend to Kinshasa commercially. Congo-Brazzaville’s stock is 43 percent of output, and its public debt was about 98 percent of GDP in 2024, which the Fund’s latest assessment expects to fall only slowly, to 93 percent in 2026 (International Monetary Fund, 2026g).
The Chinese line is the sharpest instance in the book of what a thin state’s balance sheet looks like from the creditor side. The two Congos owe more of their guaranteed external debt to creditors in China than almost anyone: $3.5 billion for the DRC, 44 percent of its guaranteed stock, and $3.0 billion for Congo-Brazzaville, 56 percent of its, the second-highest share on any card. Against that, the Paris Club holds $110 million of the DRC’s debt and $574 million of Congo-Brazzaville’s. The old creditors’ club is a rounding error in this pole and one country is most of the official balance sheet.
The loan-level database records $3.4 billion of commitments to the DRC and $5.0 billion to Congo-Brazzaville, and China rescheduled its claims on Brazzaville in 2019, before the Fund approved a programme that July, and again in 2021, to reopen talks on the next one (Reuters, 2019; Savana, 2021). The DRC is one of only two cards in the book where the outstanding balance is not smaller than the twenty-five-year commitment record: $3.5 billion outstanding against $3.4 billion signed, which on a country whose defining Chinese facility is a minerals-for-infrastructure joint venture says that very little of it has been repaid. Both cards also carry a collateralisation note, from the published register of resource-backed lending: two loans for the DRC, five for Congo-Brazzaville. Congo-Brazzaville’s restructuring status reads “other”, the treatment having been agreed outside the Common Framework.
The most consequential Chinese arrangement here is not a loan. Sicomines is a joint venture under which infrastructure was to be built and repaid out of copper and cobalt. An audit by the Congolese Inspection générale des finances found that only $822 million of infrastructure spending had been delivered in fourteen years against a Chinese commitment of $3 billion (IGF, 2023). The fifth amendment of March 2024, negotiated on the strength of it, raised the commitment from $3 billion to as much as $7 billion, with about $324 million a year while copper stays above $8,000 a tonne, a royalty of 1.2 percent of sales and marketing rights over 32 percent of production for the state miner (Resource Matters, 2024). It is equity and offtake rather than credit, so it appears in no debt column, and enforcing it needs the capacity to audit, which is A3’s constraint. Brazzaville’s instrument is instead the oil pre-payment: at the start of 2020 it still owed nearly $1.7 billion to two commodity traders and their banks, secured on future cargoes, which is a loan that does not look like one until the price falls (Reuters, 2020). The copper is largely Chinese, the oil largely European, the terminals internationally concessioned: the parts of these economies that work reliably are the parts somebody else owns.
A3. The binding constraint
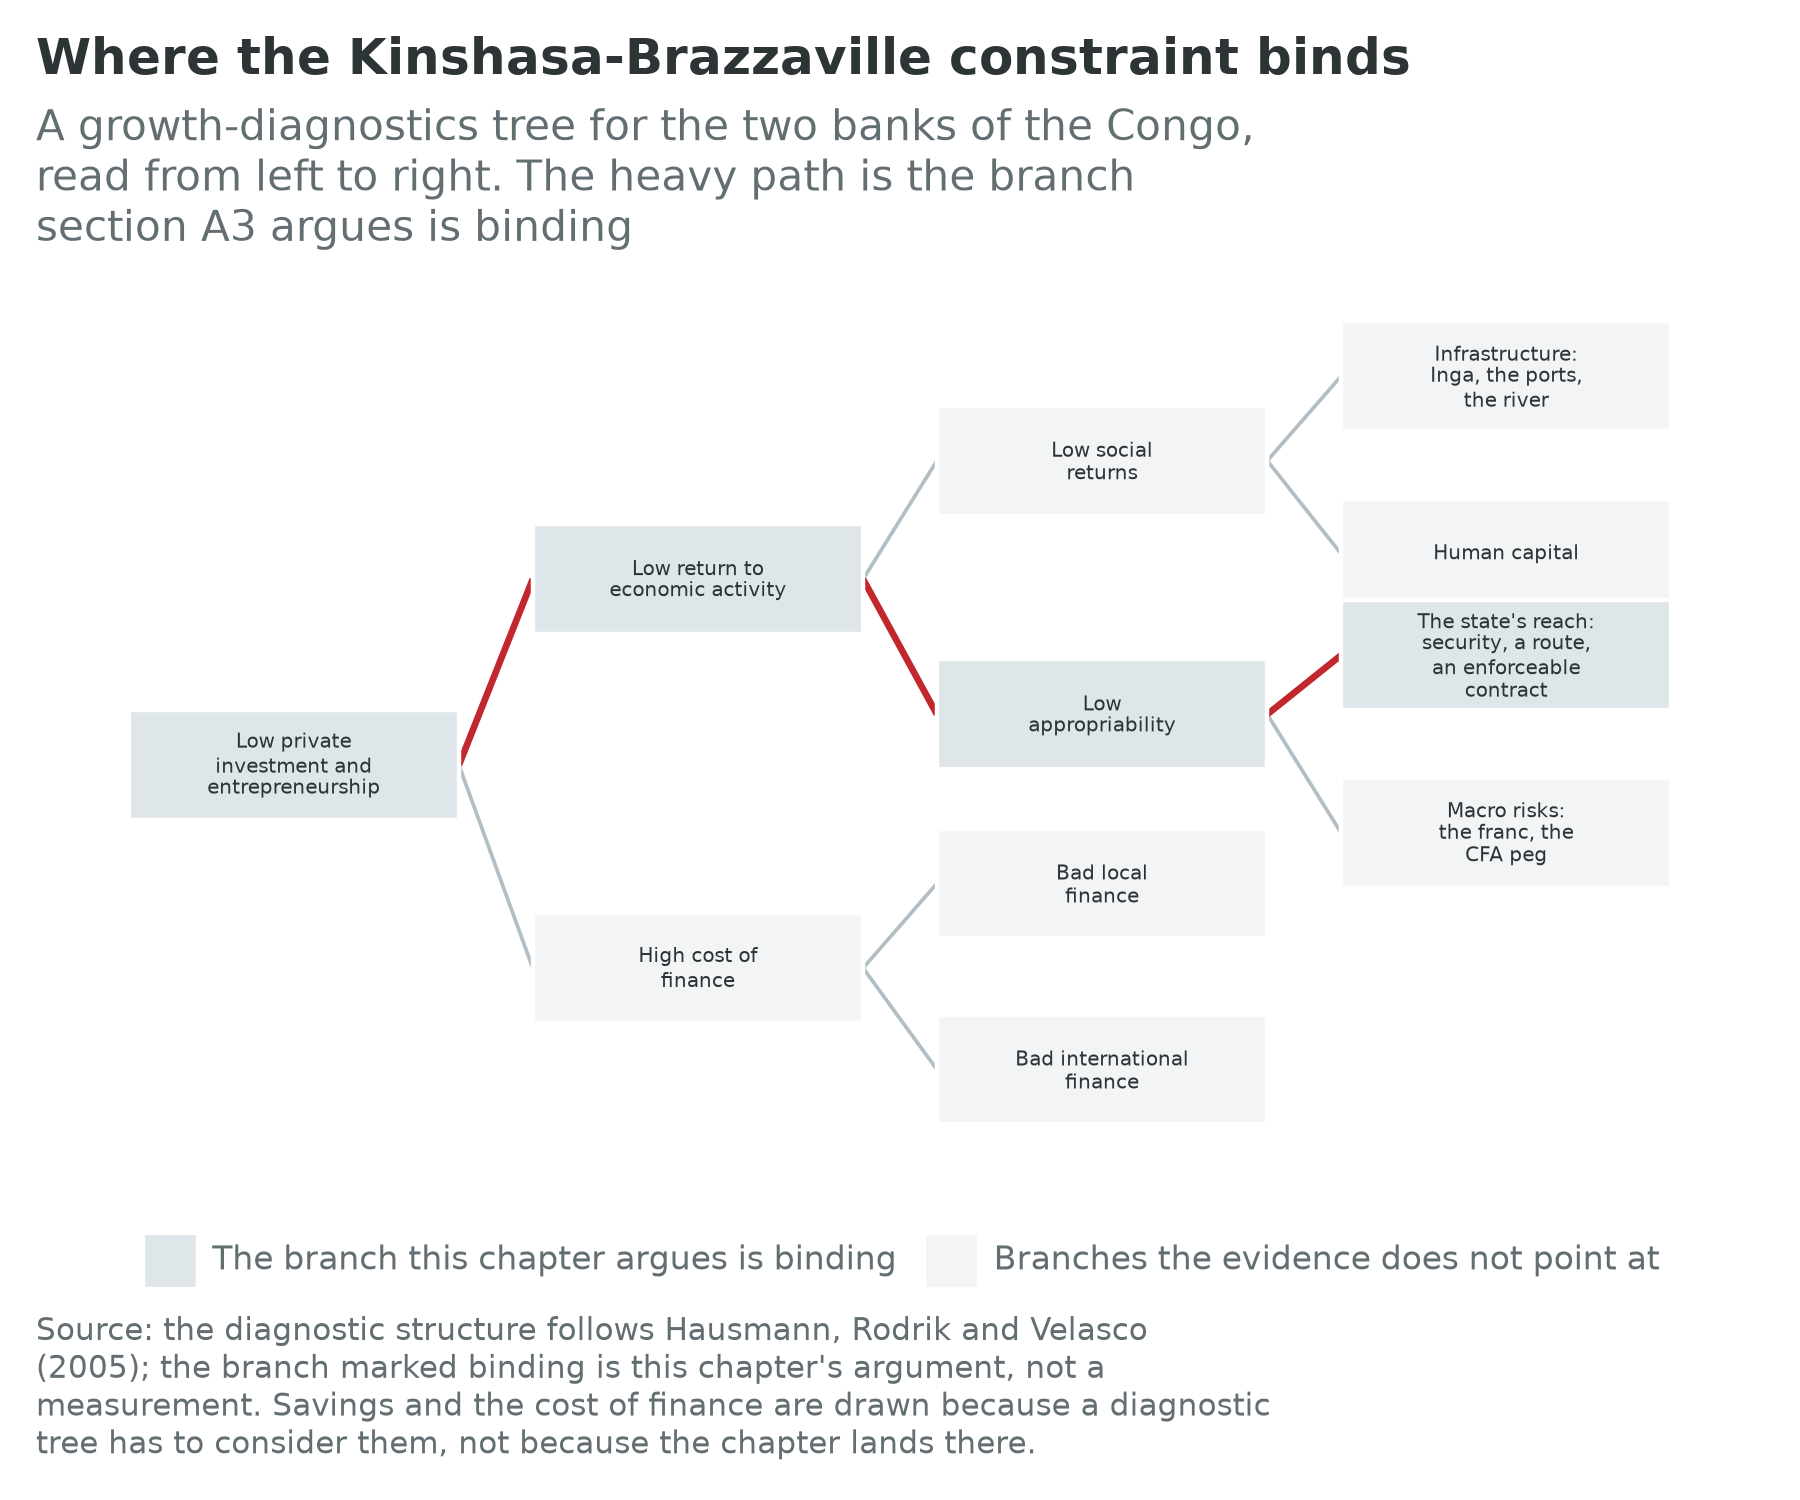
Growth diagnostics, in the form Hausmann, Rodrik and Velasco (2005) gave them, ask which single constraint, relaxed first, would raise private investment most. The difficulty in a thin state is that every branch presupposes a state. The cost of finance fails its test here in an unusual way, because when a project is genuinely bankable the money arrives. Capital enters readily when it can be secured on an asset that can be fenced, guarded and shipped, and not when the asset is a road, a farm or a shop, which is a statement about appropriability rather than about price. Human capital binds later: 31.4 percent of young Congolese are not in employment, education or training, but an economy with a wage-employment share of 14.7 percent is short of positions rather than skills.
What binds is the state’s own reach, meaning three things that arrive together. Security, developed for the east in B3, whose effect here is that a Kinshasa firm cannot treat the country as one market. A route: the road network runs to roughly 152,000 kilometres, of which the 2022 appraisal counts 3 percent paved and the 2024 project paper counts 2 percent of the national network, only about 35 percent of national roads are in good or fair condition, and road transport carries more than 90 percent of traffic (World Bank, 2022c; World Bank, 2024). An enforceable contract, first because the other two are downstream of it: a road is built by a ministry that procures and pays, and a royalty is collected because an inspectorate can audit a shipment. Sicomines is that in miniature, since the government’s own review established that $822 million of a $3 billion commitment had been spent and the remedy was a renegotiated contract rather than an enforced one. The diagnosis is falsifiable: raising the state’s capacity to observe and collect should raise investment, and money or procedure supplied without it should not persist. A8 tests the first half and B8 the second.
A4. The political settlement
Chapter 5 supplies the vocabulary: Khan (2010) on institutions working only where they fit the underlying distribution of organizational power, Pritchett, Sen and Werker (2018) on whether deals are open or closed and ordered or disordered, Dercon (2022) on whether the elite has bet on growth.
The Democratic Republic of the Congo. Felix Tshisekedi was declared re-elected in December 2023 with 73.34 percent of the vote, in an election the leading opposition candidates rejected and for which no independent parallel count was published. His first term opened with the first transfer of presidential power by ballot in the country’s history, which Nzongola-Ntalaja (2002) explains could not be assumed. The second term’s economic content is three moves: the Sicomines renegotiation, the cobalt export controls of A5, and a push on domestic revenue. This is a deals environment more ordered and no more open, and Dercon’s test is unresolved: the elite has bet on capturing more of the mineral rent, which is not betting on growth but is not nothing, since a state collecting more of its own rent can eventually build something. Trefon (2011) cautions that reform in Kinshasa is often performed for donors rather than executed, and Autesserre (2010) that outside attention has gone to the wrong level.
The Republic of the Congo. Denis Sassou Nguesso has held the presidency for about 42 years in total, from 1979 to 1992 and again since 1997, and was declared re-elected in March 2026 with about 94.8 percent of the vote, confirmed by the constitutional court at about 95 percent. This is the most closed settlement in the chapter and has the balance sheet to match, so Dercon’s test returns a clear negative. What is interesting is that Brazzaville is not weak in the sense Kinshasa is: it is small, centralized, reaches its own territory reasonably well, and has used that reach to organize an economy around a rent rather than around production. Thinness and capture are different failures, and this pole holds one of each four kilometres apart, in two countries sharing a river, a language and a name, which is as clean a demonstration of Khan’s point as the continent offers.
A5. Geography and infrastructure
The corridor here is a river, navigable for about 1,700 kilometres above Kinshasa and unnavigable for the 350 kilometres below it, where it falls through cataracts to the Atlantic. The interior reaches the coast only by the Congo-Océan line from Pointe-Noire to Brazzaville and the Matadi line to Kinshasa, both old, both lightly used, both bypassing the rapids, and both expressions of a colonial logic that made each territory a chute from its own interior to its own coast.
The seaports. Matadi is limited by draft and channel; its principal container terminal handles about 350,000 twenty-foot equivalent units a year, with a second phase to take it above 400,000. The remedy under construction is Banana, the country’s first deep-water port, with a first phase of a 600-metre quay and 450,000 units a year, built by an international operator with a development-finance institution committing up to $35 million alongside (DP World, 2025a; Howard, 2024). A country of 109 million people has at present no deep-water port. Pointe-Noire is the exception that proves the point: its terminal handled 1,219,164 units in 2025, a record since the 2009 concession, with a further terminal due in 2027 (Congo Terminal, 2026). A country of 6.3 million runs a container port handling more than three times the design capacity of its neighbour’s, which serves seventeen times as many people, and the reasons it is not the basin’s Atlantic outlet are a border, a currency line and the missing bridge.
Power and rent. Inga I and Inga II have a combined nameplate capacity of about 1,775 MW and have for years delivered well under half of it, so the country with the largest untapped hydropower resource on earth has one of the lowest electrification rates and the Katangan mines build their own. The cobalt export controls of 2025, the February suspension and the quotas of 18,125 tonnes for the rest of that year and 96,600 tonnes annually for 2026 and 2027, are the state’s attempt to convert geological position into revenue without first solving any of this (Bird, 2025; Bloomberg, 2025). Chapters 13 and 14 carry the market and the grid.
A6. Megaprojects and cities
Both cards carry a largest-city population, Kinshasa at 11.9 million and Brazzaville at 2.3 million, which is the pair above 14 million. The two are separate agglomerations on the database’s own rule, and this chapter does the adding up. Kinshasa is more than three times its 3.6 million of 1990 (Africapolis, 2025). That is a built-up-area figure rather than an administrative or metropolitan count, and it is the smaller of the two kinds of number in circulation for this city; the difference is the measurement rule and not the place, and the rule is named here every time the figure is used.
The bridge is the most-studied unbuilt project in Central Africa: a 1,575-metre tolled crossing carrying one railway track and four road lanes, costed at $414 million in the 2018 studies and at about $700 million for a first phase in current estimates (Agence Congolaise de Presse, 2026; Dossa, 2026). A continental infrastructure fund structures it as a public-private partnership, with the regional development bank as principal debt provider (Africa50, 2026). The two finance ministers signed the shared tax and customs regime in May 2026 and the call for a concessionaire went out the same month (Agence Congolaise de Presse, 2026), and the governments now speak of starting works in June 2027 (Présidence de la République démocratique du Congo, 2026). Treat that as a schedule, not an outcome; the project has had announced dates since the 1990s. The ratio makes it a section rather than a footnote: between a third and two-thirds of one percent of the two countries’ combined output, depending on which estimate is used, to connect two capitals four kilometres apart holding more people than Cairo, unfinanced for thirty years. No technical account of that failure exists; a political-settlements account does, since a ferry monopoly is a collectable rent and a bridge is not.
Inga III has been designed at between 2,000 and 11,000 MW at various times, at a cost put between $10 billion and $30 billion, and remains in design with financial close repeatedly deferred. The economics were never the difficulty: a plant that size needs a customer that size, and the candidates are South African industry 3,000 kilometres away, the Katangan mines 1,700 kilometres away, and a continental grid that does not exist, so every version has been contingent on a transmission project contingent on a treaty.
A7. Firm profiles
Rawbank, Kinshasa
Rawbank is the DRC’s largest bank, founded in 2002 and owned by a Congolese family business with roots in the trading economy. For 2025 it reported total assets of about $6.82 billion, net profit of $232 million and banking revenue of $682 million, with a non-performing loan ratio of 2.82 percent (Rawbank, 2026). A single bank holds assets equal to roughly 7 percent of national GDP in a country whose formal financial system reaches a small minority of the population, and its growth has come from mining, infrastructure and larger enterprises rather than from retail deposits. The loss rate is the telling number: a bank reporting under 3 percent non-performing, in a country with this chapter’s contract-enforcement problem, lends to the people it can collect from, which is both a rational response to the A3 constraint and the mechanism by which it reproduces itself.
Vodacom Congo, Kinshasa
The other half of the economy is reached by telephone. Vodacom Congo reports more than 23 million subscribers and about 8.5 million active mobile-money users, up from 6.4 million in 2024, an increase of 28.4 percent (Vodacom Group, 2026). It is private infrastructure that reached a national population where public infrastructure did not, restating A5: the network needing no border formality and no procuring ministry is the one that got built. Its agent network is employment of the informal, low-capital kind the wage-employment overlay exists to distinguish from a job, in a partly dollarized economy whose currency makes cash holdings unattractive.
A8. What the experiments say
Box 31.1: The state that tries to tax you
Two randomized experiments in the Congolese city of Kananga speak directly to the A3 diagnosis, and they point the same way.
Weigel (2020) randomized a door-to-door property tax campaign across 356 neighbourhoods. Compliance rose from 0.1 percent in control to 11.6 percent in treatment, a large proportional and small absolute change, and that combination is the finding. What followed matters more: political participation rose by about 5 percentage points, roughly 31 percent, as taxed citizens became likelier to attend town halls and evaluate official performance, and they updated their beliefs about the province’s revenue and its obligations. Taxation created citizens, as the fiscal-contract literature predicts and rarely gets to observe experimentally.
Balán, Bergeron, Tourek and Weigel (2022) ran the complement, randomizing whether the same campaign was run by central state collectors or by local city chiefs. Collection by chiefs raised compliance substantially, and the mechanism was information: chiefs knew which households could pay. That is Khan’s argument in experimental form.
Neither result is a policy: a campaign lifting compliance to 11.6 percent shows the constraint is real and movable, not that a road has been financed. What the two establish is direction. In a thin state, capability is built by knowing who lives where and collecting from them.
A9. Climate exposure
The exposure runs both ways here, uniquely among the poles. Beneath the basin’s central swamp forests lies the largest tropical peatland complex on earth, about 167,600 square kilometres across the two Congos, storing roughly 29 to 30 billion tonnes of carbon, about 28 percent of the world’s tropical peat carbon, and hydroclimatically vulnerable (Dargie, 2017; Crezee, 2022). They sit under an economy at $871 a head whose government has repeatedly offered oil and logging blocks over parts of the basin. The service the world most needs from this territory is that nothing happens on it, and no mechanism pays for that at a competitive scale, which is Chapter 34’s subject. The exposure running the other way binds on the megaprojects: every plan for Inga assumes the rainfall of a basin the size of India will hold, and in Kinshasa intense rain meeting unplanned settlement turns ordinary storms into fatal events, which Chapter 22 takes up.
A10. Data quality
Data quality in this book is a layer rather than a caveat, and in this chapter it is the argument.
| Country | Last census | Last GDP rebasing | Last labour-force survey | Statistical performance score | Confidence flag |
|---|---|---|---|---|---|
| Democratic Republic of the Congo | 1984 | none recorded | 2012 | 46.3 | low |
| Republic of the Congo | 2023 | none recorded | 2011 | 38.9 | low |
Table 31.3. Sources: national statistical offices for the years, World Bank Statistical Performance Indicators for the score; the flag is this book’s rule, described on the About the data page.
The DRC’s 1984 census is the most consequential data fact in this book: the second oldest enumeration on any card, behind Somalia’s of 1975, and the only scientific census the country’s statistical institute has ever run. Everything published about the Congolese population since is a projection from a 42-year-old count, updated with surveys drawn from a sampling frame built on that same count, so every per-head figure here has that projection in its denominator.
Congo-Brazzaville inverts the pattern in a way that shows what the flag measures: it ran a census in 2023, more recent than most of the continent’s, and still carries a low flag, because its last labour observation is from 2011, jointly the oldest on any card, and its statistical performance score of 38.9 is the fifth lowest of the 53 scored. The state can count people when it wants to and does not want to count work. Neither country carries a rebasing year, and given what Chapter 1 shows rebasings do to measured output, that absence should worry a reader about the level of GDP on both banks. These numbers can bear the direction and rough magnitude of the identity terms, the creditor composition as far as the debt statistics go, and the contrast between the banks. They cannot bear a DRC per-head level to more than one significant figure, a claim about Congolese employment that assumes a 2012 survey still describes 2026, or a capital’s population without its agglomeration source.
A11. Data sources
- UN World Population Prospects 2024 (term one, populations, ages 15 to 64, national not metropolitan); ILOSTAT modelled estimates, November 2025 (terms two and three, overlays); IMF World Economic Outlook, April 2026 (output, growth).
- World Bank International Debt Statistics, 2025 and the Boston University Chinese Loans to Africa database (balance sheet); Joint World Bank and IMF Debt Sustainability Analyses (Brazzaville); Resource Matters (Sicomines); ARECOMS (cobalt quotas); World Bank, PAD2573 (2022) and PIDDC00863 (2024) (the road network).
- World Bank Statistical Performance Indicators and the two statistical institutes (data quality); Africa50, the African Development Bank and AUDA-NEPAD (bridge, Grand Inga); DP World, British International Investment and Congo Terminal (ports); company reports (Rawbank, Vodacom Group); Africapolis (agglomerations).
Part B. The Great Lakes and Eastern DRC
B1. The pole in the identity
This writeup covers Rwanda, Burundi and the eastern provinces of the DRC, with the Central African Republic as the western extension of the same condition. The eastern provinces have no card; they are represented by the Congolese national card, the same COD card that carried Part A, and North Kivu, South Kivu and Ituri hold something like a fifth of the DRC’s people and almost none of its measured formal economy.
| Country | Term one: working-age population | Term two: employment ratio | Term three: output per worker | Implied growth | Observed growth | Gap | Wage employment (percent) | Non-agricultural employment (percent) | Confidence |
|---|---|---|---|---|---|---|---|---|---|
| Rwanda | 2.83 | 0.65 | 3.26 | 6.74 | 6.72 | 0.02 | 59.1 | 63.5 | high |
| Burundi | 2.94 | 0.06 | -1.87 | 1.12 | 1.13 | -0.01 | 15.1 | 14.6 | low |
| Democratic Republic of the Congo | 3.38 | -0.18 | 1.81 | 5.00 | 4.83 | 0.17 | 14.7 | 41.1 | low |
| Central African Republic | 1.27 | 0.01 | 1.08 | 2.36 | 2.57 | -0.21 | 14.5 | 34.0 | not computed |
Table 31.4. The Congolese row is the same national card as Table 31.1, repeated because the eastern provinces have none. Sources as for Table 31.1.
Rwanda is the outlier of this chapter. Observed growth of 6.72 percent a year is the second highest of the 53 cards carrying it, behind Ethiopia, and the composition matters more than the level: the second term grew at 0.65 percent, fourth highest of the 53 carrying it, and the third at 3.26 percent, so all three terms are positive and the two that must be earned do most of the work. A wage-employment share of 59.1 percent, fifteenth of 53, is extraordinary at $1,128 a head, and the five-year forecast is 7.04 percent. This is what the identity looks like when a state functions. Rwanda is also the only card of the five carrying the within-and-between split: over 2008 to 2018, within-sector growth of 0.17 percent a year against between-sector growth of 3.43 percent, so almost all its productivity growth came from moving workers into higher-productivity activities and almost none from firms in a sector getting better. That is the East Asian reallocation pattern in pure form, and it carries the companion volume’s warning that reallocation into services rather than tradable production has a ceiling (Wilse-Samson, 2026). The other three carry no split, because the database does not cover them.
Burundi is Rwanda’s control. The two have almost the same population, 14.0 million against 14.3 million, the same colonial administrator, the same hills, the same land pressure and comparable histories of mass violence. Their rows diverge completely: a flat second term at 0.06 percent, a third of minus 1.87 and observed growth of 1.13 percent against a working-age population growing at 2.94, which is a decade of falling income per head. GDP per head of $478 is the second lowest on the continent, the non-agricultural employment share of 14.6 percent the lowest of the 53 carrying it, and 98.0 percent of employment informal. Nothing in geography or endowment explains the gap; B4 argues the settlement does.
The Central African Republic is the limiting case. Its working-age population grew at 1.27 percent a year, slowest of the five, which sounds like a demographic transition and is not one: its fertility rate is 5.95, its median age of 14.4 years is the lowest on the continent and its dependency ratio of 104.7 per hundred the highest, the signature of two decades of conflict, displacement and excess mortality. Its confidence flag is not low but blank, because it has never run a labour-force survey and the book’s rule leaves an unrated card unrated.
Where does the eastern DRC appear in this table? Barely. The national row shows output per worker growing at 1.81 percent a year over a decade in which the east lost two provincial capitals and saw millions displaced. Both are true, because the mining driving the national numbers is mostly in Katanga, a thousand kilometres from the fighting, and because national accounts capture recorded formal activity, which is what the east has least of.
B2. The pole on the balance sheet
| Country | External debt stock (\(bn) | Multilateral (\)bn) | Official bilateral (\(bn) | Bonds (\)bn) | Other private (\(bn) | Chinese loan commitments, 2000 to 2024 (\)bn) | |||
|---|---|---|---|---|---|---|
| Rwanda | 13.1 | 5.6 | 1.1 | 0.6 | 1.7 | 0.7 |
| Burundi | 1.0 | 0.4 | 0.2 | none recorded | none recorded | 0.1 |
| Democratic Republic of the Congo | 12.5 | 4.1 | 3.8 | none recorded | 0.1 | 3.4 |
| Central African Republic | 1.0 | 0.2 | 0.3 | none recorded | 0.002 | 0.1 |
Table 31.5. Sources as for Table 31.2.
Rwanda’s is the only balance sheet here with a shape a finance ministry would recognise: external debt at 82 percent of output, the highest ratio in the chapter, composed of $5.6 billion owed to multilateral institutions on concessional terms, $0.6 billion in bonds sold to international investors, and only $0.7 billion of cumulative Chinese commitments, about 4 percent of a year’s output. That is a state borrowing from the cheapest lenders and pricing itself in the market, and a vulnerability on a narrow export base. Burundi and the Central African Republic are at the other end, with about $1.0 billion each, no bond line, and in Burundi’s case no recorded private creditors. The Chinese line is negligible for both, at $0.1 billion: China lends against assets, and these two lack the kind it lends against.
The balance sheet that matters most here appears on no card, because it belongs to nobody who files accounts. UN experts estimate that more than 120 tonnes of coltan a month moved from the Rubaya area into Rwanda from April 2024, earning the armed group controlling it at least $800,000 a month in taxation, with 195 tonnes reported in the last week of March 2025 alone, and official Rwandan coltan export volumes in 2025 more than two and a half times their 2021 level (United Nations Group of Experts, 2025; Global Witness, 2025). The Rwandan government disputes these findings. This book reports the estimate, reports the dispute, and observes what neither side contests: a mineral mined on one side of a border is exported from the other, and each accounting system records only its own half. Chapter 30 carries the corridor economics and Chapter 13 the world market. The mechanism is what belongs here: where the state does not tax, somebody else does, and that somebody’s revenues appear in no balance of payments.
B3. The binding constraint
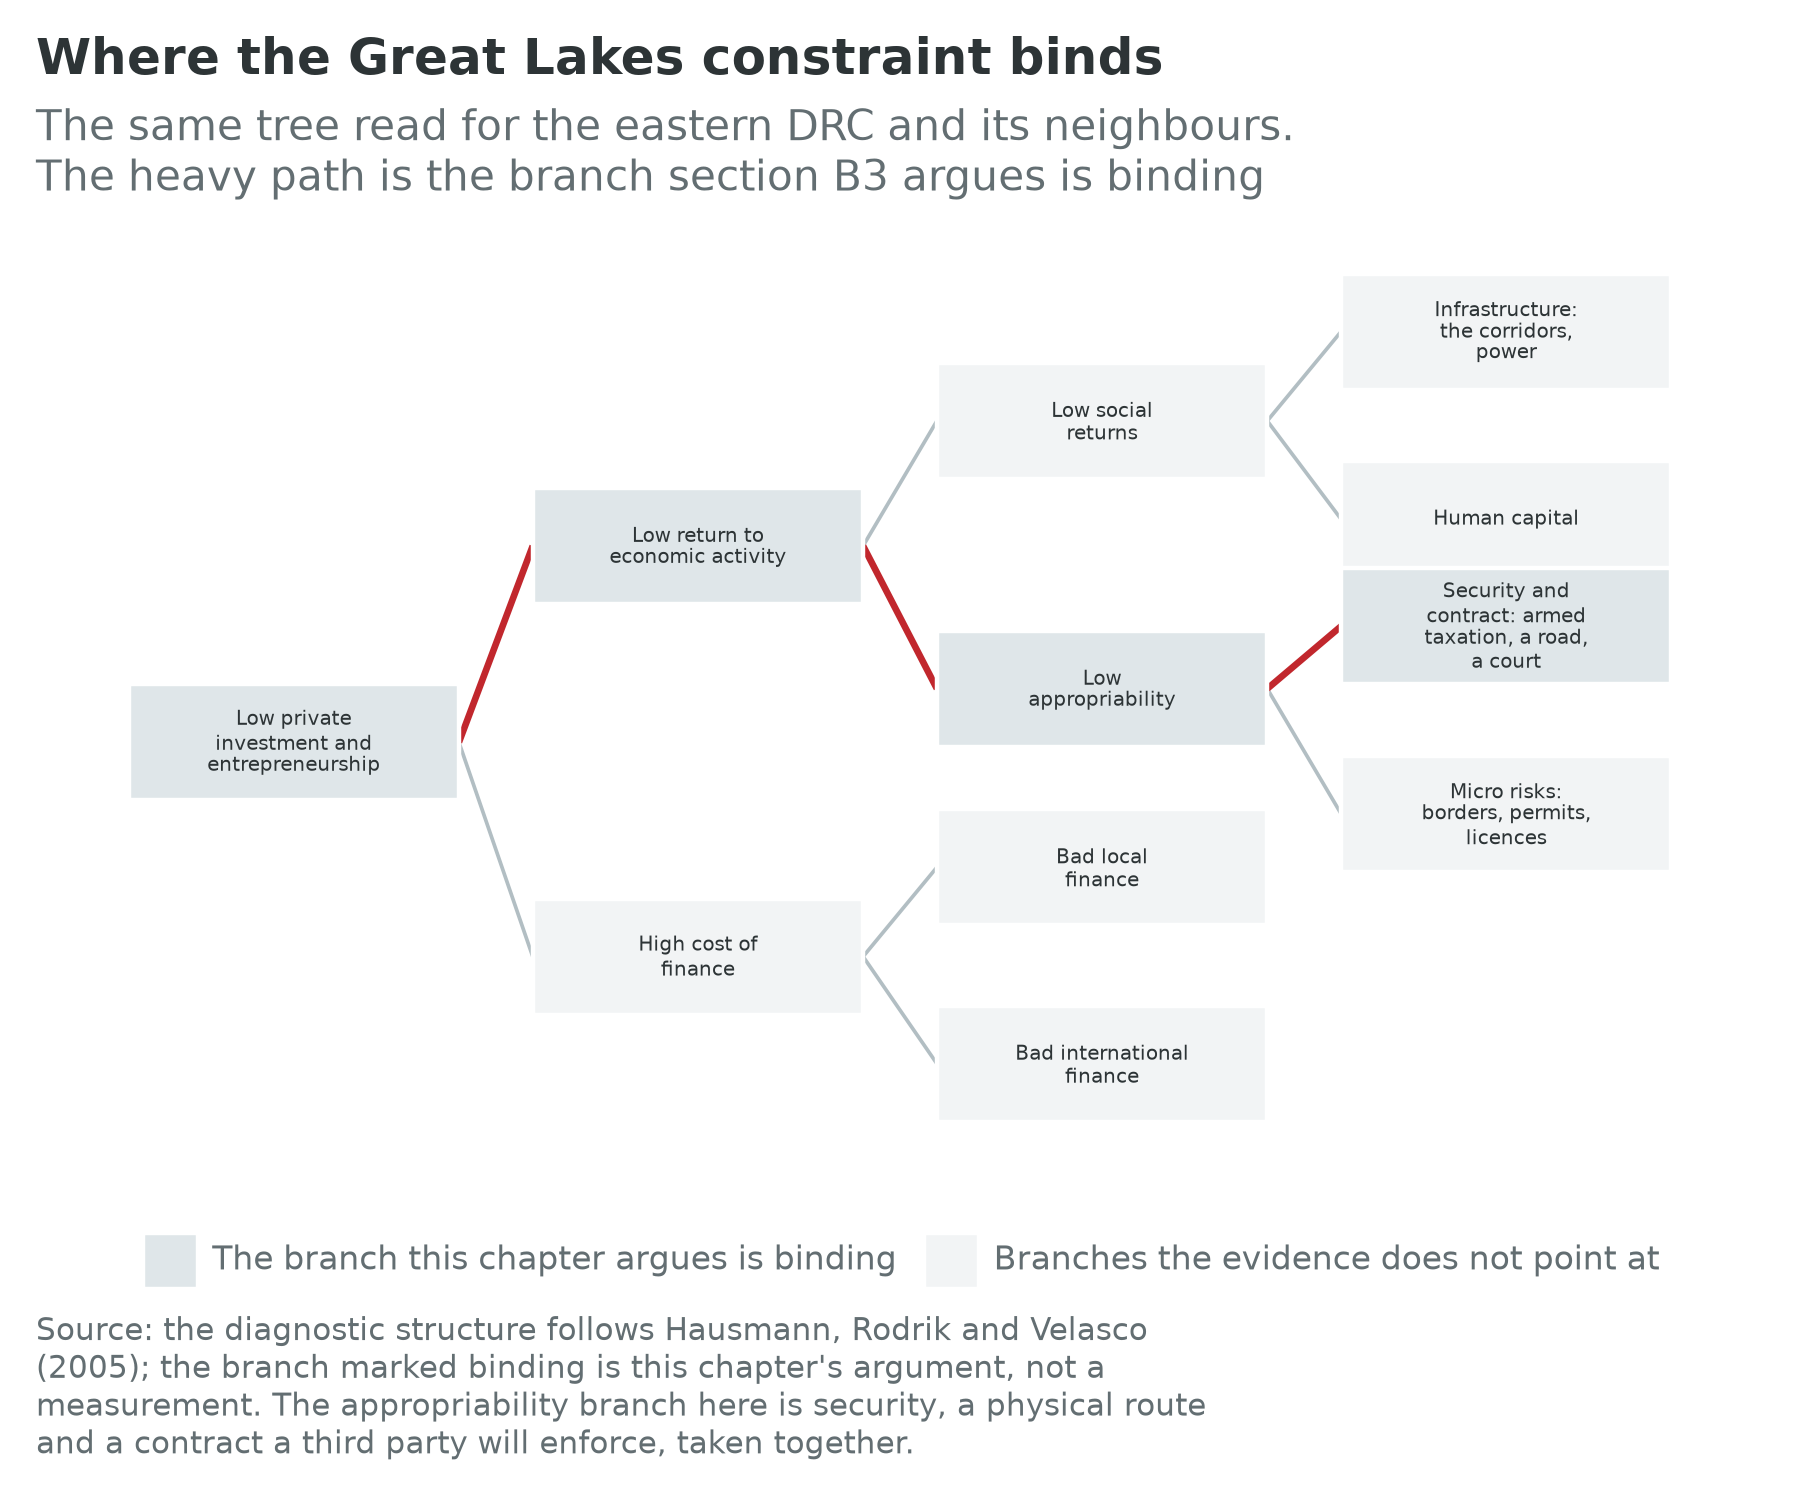
The answer here is the one development economics finds least tractable. Eliminate the cost of finance: Rwanda borrows internationally at a price, while Burundi and the Central African Republic cannot borrow at all and have no queue of high-return projects waiting on credit. Eliminate human capital next: Rwanda has invested in schooling and health for two decades and its constraint is elsewhere, while in Burundi 11.2 percent of young people are not in employment, education or training, a low figure meaning almost everyone works, in agriculture, for very little.
What binds is appropriability, in the three-part form A3 introduced, and here the three fail together. Security is prior. M23 and allied forces took Goma between 23 and 30 January 2025 and Bukavu in mid-February, the first time either provincial capital had fallen since 2012 (International Crisis Group, 2025). More than 7 million people are displaced inside the DRC, about 3.8 million of them in North and South Kivu, roughly 780,000 displaced between November 2024 and January 2025, and ACLED recorded over 2,500 fatalities from armed-group violence in the first quarter of 2025 alone (OCHA, 2025; Serwat, 2025). Two processes ran in parallel: the Washington agreement between the DRC and Rwanda, initialled by the foreign ministers on 27 June 2025 and signed by the two presidents on 4 December 2025, and the Doha Framework between the Congolese government and the armed group, signed on 15 November 2025. Five days of talks in Switzerland from 17 to 21 August 2026, facilitated by Qatar, the United States, Togo for the African Union, the African Union Commission and Switzerland, produced a roadmap of sequenced steps and timelines, a standardised method for reporting ceasefire violations and a mechanism to take up failures of implementation; sanctions, the release of detainees and the timing of political reform were left unresolved, and the fighting did not stop, the armed group alleging Congolese drone strikes on 22 August (Africa Center for Strategic Studies, 2025b). Washington reserved the rebellion itself for Doha, and the structural point is that agreements between states have come more easily than agreements with the armed groups on the ground (Stearns, 2021).
A route is second. The eastern provinces are 1,600 kilometres from Kinshasa by any land route that exists and under 200 kilometres from Kigali, so their outlets are the East African corridors of Chapter 26, and a trader in Goma is integrated with Kigali and Kampala rather than with her own capital. An enforceable contract is third, and here the region runs its own natural experiment: Rwanda is one of the easiest places on the continent to register a business and enforce a commercial judgment and Burundi one of the hardest, on the same hills with the same crops. The variable is the state, and the testable implication is that where security and administration are restored investment should respond quickly.
B4. The political settlement
Rwanda is the most-argued-about settlement in Africa and this book’s position is that both standard readings are correct. Paul Kagame was declared re-elected in July 2024 with 99.18 percent of the vote on a reported turnout of 98.2 percent. Booth and Golooba-Mutebi (2012) named the arrangement developmental patrimonialism: a centralized ruling party managing rents through party-owned holdings over a long horizon and therefore investing them, an unusual solution to the commitment problem Khan (2010) sets out. Reyntjens (2013) is the standing counter-account, that the same centralization is a system of political control with a development output attached, and Ansoms (2009) has documented how the agrarian policies that raised measured yields were imposed on smallholders who had not asked for them. Clark (2010) shows a third face in the gacaca courts, which processed a caseload no formal judiciary could have handled, at an openly accepted cost in due process. Dercon’s test returns the clearest African yes since Botswana, and Table 31.4’s row is the evidence. It also illustrates his corollary, that betting on growth is not a bargain to share power, and one this chapter adds: a settlement resting on the horizon of a single leadership carries an unpriced succession risk.
Burundi is Rwanda’s control in politics as in the identity. Évariste Ndayishimiye took office in 2020 promising an opening and the direction of travel has been the other way: his party won all 100 contested seats in the National Assembly on 5 June 2025, in an election held during a fuel shortage in its third year and inflation reported above 40 percent. This is a closed and increasingly disordered deals environment, and the bargain is plainly not on growth, since an economy that cannot import fuel is rationing scarcity rather than trying to end it. Two countries with the same endowments, population and trauma, and opposite settlements, have produced GDP per head of $1,128 and $478.
The eastern DRC is a settlement question of a different kind, because the relevant elites are not all in the capital. Sánchez de la Sierra (2020) put it most sharply, and B8 takes up the evidence: armed actors create the essential functions of a state, taxation and protection above all, when doing so raises what they can extract. That is Khan’s framework at the level of a militia, and the alternative to the Congolese state in the east is therefore not disorder but a competing set of taxing authorities. The Central African Republic is the darkest case: Faustin-Archange Touadéra was declared re-elected on 28 December 2025 with 76.15 percent of the vote on a turnout of 52.42 percent, standing for a third term after a 2023 referendum removed term limits and lengthened the presidential term from five years to seven. The settlement rests on external security provision, latterly Russian, in exchange for concessions: sovereignty rented out for protection, the rent paid in resources. Englebert (2009) explains why a state surviving on international recognition rather than domestic capability has weak incentives to build the latter.
B5. Geography and infrastructure
The Great Lakes is the densest rural population on the continent on some of its best volcanic soil, a thousand kilometres from any ocean, and its infrastructure follows from being landlocked twice, as countries and again because the nearest coast belongs to a third party. Kigali’s trade runs east on the Northern Corridor to Mombasa and the Central Corridor to Dar es Salaam, both described with their reform record in Chapter 26; what matters here is that Rwanda has invested in the domestic end of those corridors, with a maintained road network, one-stop border posts and customs clearance measured in hours.
Goma and Gisenyi are one urban area divided by an international boundary, crossed by one of the busiest pedestrian border posts in Africa. At least 22,000 small-scale traders depend on the crossings, the great majority women, in a trade defined by daily transactions under $100 a trader (International Alert, 2015). Published estimates of daily crossings range from about 2,000 to about 30,000 depending on the year and the post, which is why this book quotes the dependent population rather than a flow; the companion volume develops the argument and this chapter cites rather than repeats it (Wilse-Samson, 2026). The busiest economic institution in the eastern DRC is a border crossing worked by women carrying goods on their heads, it functions when almost nothing else does, and it appears in no national account on either side. The roads west from Goma into North Kivu are the physical stake of much of the fighting in B3, because a route is a tax base: the road from Kigali to Goma is short, paved and busy, and the road from Goma to Kisangani is neither.
B6. Megaprojects and cities
Bugesera, a new international airport south of Kigali, is Rwanda’s largest single bet: roughly $2 billion, with a Gulf carrier holding 60 percent, a first phase designed for about 7 million passengers a year, a first phase moved from the 2026 originally announced to 2028, and about $485 million allocated in the 2025/26 budget. Read it as the physical statement of the strategy, which is to be the region’s service and logistics hub rather than its factory floor: an economy of 14.3 million people at $1,128 a head building a 7-million-passenger airport is bidding for somebody else’s traffic. The counter-case is B1’s, that a hub strategy is a reallocation strategy and within-sector productivity growth of 0.17 percent a year says the sectors being reallocated into have not themselves improved. Kigali’s card puts the agglomeration at 3.6 million, and at 10.4 million in 2050, which would make a city of 7 million air passengers a year a city of ten million people. The most consequential site in the eastern DRC, however, is not a project but the coltan workings at Rubaya whose output B2 traced across the border, and Burundi and the Central African Republic have no megaproject worth the name, which is the finding rather than an omission.
B7. Firm profiles
BK Group, Kigali
BK Group is the holding company of Bank of Kigali, the country’s largest bank and the anchor of the Rwanda Stock Exchange. For 2025 it reported net profit of FRw110.1 billion, up about 23 percent, total assets of FRw2,919 billion, up 15.8 percent, customer loans of FRw1,688 billion and a cost-to-income ratio of 37.9 percent (BK Group, 2026); the Rwandan franc is written FRw. It earns the profile for what it demonstrates rather than its size: a bank listed, audited and reporting to a timetable is itself an institution of the kind B3 says the region lacks. Set Rawbank’s loss rate in A7, low because it lends only where it can collect, beside a banking system in which collection is a normal expectation of the courts, and the two are doing different things with the same instrument.
Bralirwa, Kigali and Gisenyi
Bralirwa is Rwanda’s brewer and soft-drinks bottler, majority-owned by an international group, locally listed, with its main brewery at Gisenyi on Lake Kivu. For 2025 it reported revenue of FRw263.0 billion, up 22.1 percent, profit after tax of FRw42.8 billion, up 15.6 percent, on sales volume growth of 10.7 percent (Bralirwa, 2026). Beer is a non-tradable consumer good, so volumes are an honest thermometer of domestic purchasing power between household surveys; the supply chain reaches smallholders through local sorghum and maize sourcing, the within-sector channel Rwanda’s split says has been weak; and the Gisenyi plant stands a few kilometres from the Congolese border on a lake whose methane powers the country and whose other shore has been at war.
B8. What the experiments say
Box 31.2: What the experiments say about building a state from outside
Three findings from the eastern DRC and Rwanda point in a consistent and sobering direction.
Armed groups build states when it pays them to. Sánchez de la Sierra (2020) assembled a historical dataset on armed actors across eastern Congo and used commodity price shocks as the source of variation. A demand shock for coltan, whose bulky output cannot be hidden, led armed actors to settle at the mines, create customs posts and provide protection: to become stationary bandits. A shock for gold, easily concealed, produced stationary bandits instead in the villages where gold income was spent, with mining visas, taxes and an administration. Where the stationary bandit was affiliated with a militia or the Congolese army, welfare rose. That is no defence of militias; it shows that the functions of a state emerge from the economics of extraction, which is what any outside programme competes with.
Building governance from outside did not take. Humphreys, Sánchez de la Sierra and van der Windt (2019) evaluated the first phase of Tuungane, a DFID-funded community-driven reconstruction programme in eastern Congo that worked in 1,250 villages between 2007 and 2011 at a cost of about $46 million. The democratic governance practices it was designed to instil did not persist after the programme left. The authors read this as casting doubt on the exportability of democratic practices; this chapter reads it as Khan (2010) predicts, that procedures which do not fit the local distribution of power are performed while funded and abandoned when not.
Cash outperformed the programme. McIntosh and Zeitlin (2022) randomised 1,848 underemployed young Rwandans between a workforce-readiness programme and unconditional grants ranging from about $317 to $750 delivered by mobile money, with comparisons adjusted to the same donor expense. The cost-equivalent grant beat the training programme on income, productive assets, consumption and well-being, and the smaller grant did about as well as the larger.
Programmes that supply money work about as well as they cost; programmes that install procedures do not survive their funding; and the incumbent alternative to the state is a competing tax authority with its own logic. That is Box 31.1’s conclusion again: what is worth building is the state’s own capacity to observe and collect.
B9. Climate exposure
Lake Kivu is the region’s defining physical fact and both a resource and a hazard. Its deep water holds dissolved methane and carbon dioxide in quantities without parallel in any other lake, and the methane is extracted commercially: the KivuWatt plant generates about 26 MW, with a further 100 MW under discussion, and methane supplied about a fifth of Rwanda’s electricity in 2025. The hazard is a limnic eruption, the sudden overturn that killed about 1,746 people at Lake Nyos in Cameroon in 1986; Kivu is far larger, holds vastly more gas and has about two million people on its shores. Measurements spanning four decades show gas concentrations close to a steady state rather than rising toward saturation, and extraction reduces the stock, so the risk is low-probability, catastrophic and monitored.
Nyiragongo is the acute case: a volcano 20 kilometres north of Goma whose lava moves faster than a person can run. It erupted on 22 May 2021, killing about 32 people, destroying about 1,000 homes and causing more than 400,000 people to leave the city. Set that beside B3: Goma is a city of well over a million, a large share already displaced by conflict, between an active volcano and a gas-charged lake, with an observatory whose funding has repeatedly been interrupted. That is compound risk where the institution that would manage it is the institution that is thin.
B10. Data quality
| Country | Last census | Last GDP rebasing | Last labour-force survey | Statistical performance score | Confidence flag |
|---|---|---|---|---|---|
| Rwanda | 2022 | 2025 | 2024 | 72.6 | high |
| Burundi | 2024 | none recorded | 2020 | 45.2 | low |
| Democratic Republic of the Congo | 1984 | none recorded | 2012 | 46.3 | low |
| Central African Republic | 2003 | none recorded | never run | 46.8 | not computed |
Table 31.6. Sources as for Table 31.3.
Rwanda is the region’s one high-confidence card and one of only eleven on the continent, with a census in 2022, a rebasing in 2025, a labour-force survey in 2024 and a score of 72.6. That is part of the story, since the capability producing an annual labour-force survey is the one producing the border post and the land registry. It also sets a trap: Rwanda is the country here whose story can be told with numbers, so it gets told, and the region’s other 95 million people appear as context.
Burundi inverts Rwanda’s pattern as Congo-Brazzaville inverted the DRC’s: a census in 2024, more recent than Rwanda’s, and a low flag, because it has never run a dedicated labour-force survey, the observation recorded as 2020 being a household living-conditions module, and its score of 45.2 is in the lowest quarter. The Central African Republic is the limit: last census 2003, never a labour-force survey, and a flag that is not low but blank, one of only three cards of 54 with no computable flag, alongside South Sudan, which has also never surveyed, and Eritrea, which has never held a census. Every term in its row rests on a projection from a 2003 enumeration and accounts never rebased; the row is printed because printing it is more honest than omitting the country, and the blank flag beside it stops the row being quoted as a measurement.
Then there is the object this writeup is about, which has no row at all. The eastern DRC is not a card: its population is a share of a projection from 1984, its output is whatever the accounts attribute to it, its employment has never been surveyed, and its most important activity is smuggled by design. These numbers can bear Rwanda’s decomposition, with the reallocation warning attached; the Rwanda and Burundi contrast, too large for measurement error to close; and the direction of the mineral flows, corroborated by customs records on the receiving side. They cannot bear a statement about the eastern DRC as an economy, a Central African figure quoted as a measurement, or a Burundian employment structure that treats a household module as a labour-force survey.
B11. Data sources
- UN World Population Prospects 2024 (population, term one); ILOSTAT modelled estimates, November 2025 (terms two and three, overlays), with the GGDC Economic Transformation Database for the within-and-between split, which among these four cards exists only for Rwanda; IMF World Economic Outlook, April 2026 (output, growth).
- World Bank International Debt Statistics and the Boston University Chinese Loans to Africa database (balance sheet); World Bank Statistical Performance Indicators, the statistical offices of Rwanda and Burundi and ICASEES in Bangui (data quality).
- UN Group of Experts on the Democratic Republic of the Congo, Global Witness and customs records (mineral flows); UN OCHA and ACLED (displacement, fatalities); International Crisis Group and the Africa Center for Strategic Studies (the 2025 offensives, the peace processes); International Alert (Goma and Gisenyi trade); company reports (BK Group, Bralirwa); ContourGlobal and Rwanda Energy Group (Lake Kivu methane); The New Regional Economics, chapters 12 and 14 (Wilse-Samson, 2026).
The Sahel, and How to Argue Where the Numbers Are Absent
The Sahel is not a third writeup, and the reason is a claim rather than an editorial convenience. A growth pole is a place where the identity’s terms are being pushed in a direction; the Sahel is a place where they are being pushed back. Mali’s working-age population grew at 3.54 percent a year over the decade, Burkina Faso’s at 3.31, Niger’s at 4.01 and Chad’s at 4.14, all near the top of the continental distribution, while their second terms are negative in three of the four, at minus 0.72, minus 1.12 and minus 0.43, with only Niger positive at 0.81, and their third terms run from 2.47 in Burkina Faso to minus 1.31 in Chad. The fastest first term on the continent meeting a shrinking employment ratio, where state authority has been contracting for a decade, is the configuration Chapter 10 calls the most dangerous in the book. It belongs with the scenarios, and Chapter 36 carries it as a full section.
Which leaves the method. Everywhere else in Part VI the book argues from series; here it mostly cannot, and the temptation is to fall silent or to quote modelled numbers as though the fog were not there.
Print the data-quality fields beside every claim and let them argue. The 1984 census is not a caveat on the DRC’s numbers; it is a finding about the DRC. The Central African Republic’s blank flag is not missing data; it is the most informative cell in Table 31.6.
Use the confidence flag as a filter and say what drops out. Four of the five cards here are low or blank and only Rwanda is high, so a reader switching the map into confidence mode loses almost this entire chapter. That is the right response to the data and also a trap, because a book discussing only what it can measure ends up writing about five countries and calling it Africa. The rule here is to print the low-confidence rows, mark them, and lean only on differences too large for measurement error to explain.
Bring in Chapter 1’s correctives and respect their limits. Nightlights are the obvious instrument for territory a statistical office cannot reach (Henderson, Storeygard and Weil, 2012), and they fail here in the third of their specifically African ways: subsistence agriculture emits almost no light, and it is what most people in this chapter do, so a satellite reports the Kivus as empty, which is the error the official statistics already make (Wilse-Samson, 2026). Afrobarometer is the better corrective, since it asks people directly whether the state has reached them, and reaches provinces the accounts do not; its coverage is intermittent in exactly these places (Afrobarometer, 2025). Jerven (2013) is the reminder that the response to manufactured numbers is not uniform distrust but knowing which were made how.
Say what the two worlds of Chapter 1 mean here. In the labour-abundant world these are among the highest-return places on earth: a hundred and fifty million people, most of them young, at incomes between $478 and $2,404 a head, holding the minerals and a fifth of the world’s tropical peat carbon. In the labour-redundant world the reading inverts, and in a particular way for thin states: term one is fastest exactly here, since the chapter’s two doublers will each roughly double their populations by 2050, and terms two and three are least measurable exactly here, because the apparatus that would measure them is the one the thin state does not have. What these territories would sell in that world is not labour but ore, land, water and carbon, whose value does not depend on the people living above them and whose rents accrue to whoever holds the contract, so the contract-enforcement problem of A3 becomes the whole of the distribution question. Chapters 34, 35 and 36 take that forward. This chapter proceeds on the labour-abundant case, and adds that the assumption is doing the most work precisely where the least is known.
12. Exercises
The template’s twelfth section, shared by the two writeups.
Discussion questions
Rwanda and Burundi have almost the same population, terrain and crops and comparable histories of mass violence, and their identity rows show observed growth of 6.72 percent and 1.13 percent a year. Set out the two most plausible explanations in the vocabulary of section B4 rather than as a list of policies, say what evidence observable before 2035 would distinguish them, and state what your answer implies about how much of a development outcome a leadership can be held responsible for.
Sections A3 and B3 both argue that the binding constraint is the state’s reach, defined as security plus a route plus an enforceable contract. That is three things, and a growth diagnostic is supposed to name one. Make the strongest case that they are separable, choose the one you would relax first, and say what would have to be observed for your choice to be wrong.
Box 31.2 reports that a community-driven programme built infrastructure that lasted and governance practices that did not, and that a cost-equivalent cash grant outperformed a training programme; Box 31.1 reports that a property tax campaign raised both compliance and political participation. Build a position on what outside money should buy in a thin state, then argue against it using Sánchez de la Sierra (2020).
Try it
Open three cards side by side: the Democratic Republic of the Congo, the Republic of the Congo and Rwanda, in that order. Read down the identity block, where the three columns share one scale, then down the data-quality block. Then switch to the Growth Pole Map and turn on the confidence toggle, which hatches every country flagged low or with no computable flag. Write one paragraph on a single question: if the confidence layer removes four of this chapter’s five countries, what should a book do with the fifth? Argue for one of three positions: report Rwanda and say plainly that it is not representative; report all five with their flags attached; or refuse country-level claims here and write only about the region’s institutions. Then say which this chapter did.
Data exercise
Download all fifty-four cards from the country cards page on this site, as cards.csv or cards.json, and build a table of this chapter’s five countries with these fields: identity.working_age_pop_growth, identity.employment_to_wa_growth, identity.output_per_worker_growth, identity.gdp_growth_observed, overlays.wage_employment_share, scale.gdp_per_capita, data_quality.last_census_year, data_quality.last_lfs_year, data_quality.spi_overall_score and data_quality.confidence_flag. Then do four things. First, reproduce both identity tables and confirm that the three terms sum to implied growth and that implied growth is close to observed. Second, compute for all 54 cards the years between the last census and 2026, rank them, and say where this chapter’s five sit. Third, restrict to cards whose confidence_flag is neither low nor null and report what share of continental population and output survives the filter, and what share of this chapter’s does; write two sentences on whether a high-confidence Africa is a useful analytical object. Fourth, add overlays.output_per_worker_within and overlays.output_per_worker_between, note that exactly one of the five carries them, and say what a reader may conclude about structural change in the other four. Treat nulls as missing, never as zeros: a country with no labour-force survey is not a country with no labour market.