23. Inequality, Social Protection, and Health
Roughly four in five Africans are covered by no social protection benefit of any kind: no pension, no child grant, no unemployment payment, no insurance that pays when they fall ill (ILO, 2024). The exception is a single country at the southern tip of the continent, where about 28 million people, something like four in nine residents, receive a monthly payment from the state (Dondolo, 2025). South Africa is not the model. It is the outlier, it is also the most unequal country the international statistics measure, and the relationship between those two facts is the subject of this chapter.
Learning Objectives
After reading this chapter, you should be able to:
- Distinguish between-country from within-country inequality, say which of the two has been the moving part in Africa since 1990, and explain why a continental Gini and a national Gini answer different questions.
- Read a poverty rate and a poverty count together, explain how the first can fall while the second rises, and state what the 2025 revision of the international poverty lines did and did not change.
- Price a transfer system against the identity: compute what a stated transfer would cost as a share of output, set it beside the continent’s tax ratio and its informality rate, and say why the arithmetic is easiest exactly where the political case is weakest.
- Describe the three problems a transfer system has to solve, financing, delivery and settlement, and name the African programme that is the clearest test of each.
- State health’s place in the identity as a precondition rather than a sector, and say what the randomized evidence on transfers and on disease actually establishes about the systems questions this chapter asks.
Prior work: the Rwandan poverty series and the mapping of Afrobarometer’s lived-poverty responses onto a satellite activity layer are set out in the companion volume, The New Regional Economics, chapter 12 and Lab 6 (Wilse-Samson, 2026). This chapter cites that material rather than repeating it.
Three subjects sit in this chapter and the join between them is the identity. GDP growth is approximately the growth of output per worker, plus the growth of the employment-to-working-age ratio, plus the growth of the working-age population. The identity says how much is produced. It says nothing whatever about who gets it. That silence is the first subject: who eats the growth. The second is what the state does about the answer, which is social protection. The third is the condition underneath both, because a population that does not survive childhood and does not reach fifty in good health is not a labour force in the sense any of the three terms assumes.
Health here is a reprise rather than a survey. Chapter 2 established the mechanism that matters most, that child survival falls before fertility does and is therefore the precondition of the demographic dividend rather than a competing claim on the same budget. This chapter takes the distributional half of that argument and declines to write a sector survey of African health systems, which would be a different and longer book.
The chapter also has a debt to pay, owed from four directions. Chapter 6 said this chapter would price a transfer system in an economy with no payroll; Chapters 8 and 16 said it would price and own the transfers a payments rail delivers; Chapter 10 said it would price the transfer floor that becomes the system rather than the residual if the frontier of production stops needing workers. Section 2 pays it with arithmetic.
1. Who eats the growth
Two inequalities, and which one moved
Start with the distinction that organizes everything else. The inequality a person experiences has two components: the difference between her and her neighbours, which is within-country inequality and is what a national Gini index measures, and the difference between her country and somebody else’s, which is between-country inequality and is what a national Gini cannot see at all. Milanovic’s contribution was to insist that at the global level the second component dominates, so that where a person is born explains the large majority of the variance in world incomes and the return to holding one passport rather than another swamps almost anything she can do inside a single labour market (Milanovic, 2016).
Africa is where that decomposition is most useful, because the continent contains the widest income spread of any landmass. Chapter 1 gave the range: Seychelles at $18,479 per head against South Sudan at $470, thirty-nine to one inside a single continent. An African living in Kinshasa and an African living in Port Louis are further apart in income than a Portuguese and a German, and no national statistic registers the gap.
The best current measurement of the two components together is the World Inequality Lab’s African series, which combines household surveys, national accounts and tax data across the continent for 1990 to 2019 (Chancel, Cogneau, Gethin, Myczkowski and Robilliard, 2023). Three of its findings organize this section.
The first is the level. Africa is among the most unequal regions in the world on the top-share measure: the richest tenth of Africans receive on the order of 54 percent of continental income and the bottom half on the order of 9 percent, a ratio between the average person in each group of something like thirty to one (Chancel, Cogneau, Gethin, Myczkowski and Robilliard, 2023). The second is the composition. A substantial part of that inequality, on the order of a quarter to a third depending on the index and the year, is between countries rather than inside them, a much larger between-country share than any comparable region records. A Southern African mining economy and a Sahelian agricultural one are not two draws from the same distribution.
The third is the dynamics, and it is the one that matters for this book’s argument. Within-country inequality in Africa has been high and remarkably stable since 1990. What moved over the three decades was the between-country component, and it moved down, because several large poor countries grew faster than several rich small ones. Continental inequality fell modestly, in other words, for reasons that had almost nothing to do with national redistribution policy and almost everything to do with the composition of continental growth. That is an uncomfortable finding for a chapter about social protection and it belongs before the programmes rather than after them. Over thirty years the thing that changed African inequality was growth in the right places, and the thing that did not change it was anything a ministry of social development did.
The rate fell and the count rose
Set the inequality series beside the poverty series and the section’s second finding appears at once. The share of Sub-Saharan Africans living below the extreme-poverty line fell from something like 55 percent in 1990 to something like 35 percent by the end of the 2010s. Over the same period the number of people below that line rose from roughly 280 million to well over 400 million, and the region’s share of the world’s extreme poor went from about a sixth to about three fifths (World Bank, 2025e). Both halves are the same arithmetic. A poverty rate is a ratio and a poverty count is a numerator, and when the denominator grows at Chapter 2’s rates the rate can fall for thirty years while the count rises throughout.
This is the distributional face of the identity’s first term. Chapter 2 established that Africa adds about 27 million people of working age every year for the next twenty-six years. Poverty reduction on this continent is a race between the rate and the denominator, and for three decades the denominator has been winning on the count while losing on the rate. Which of the two numbers a government quotes is a political choice, and both are true.
One measurement change belongs on the page rather than in a footnote. In 2025 the World Bank moved the international poverty lines from $2.15 and $3.65 a day in 2017 prices to $3.00 and $4.20 a day in 2021 prices, and revised the underlying survey data at the same time. The effect was to raise the measured global count of the extreme poor substantially without anybody becoming poorer (World Bank, 2025e). This chapter quotes the older $2.15 series where a comparison over time is being made, because the revised series does not yet run back through the 1990s on a consistent basis, and it says so wherever it does. A reader who wants the single most important lesson of Chapter 1 restated in one line has it here: a third of the world’s measured extreme poverty appeared and disappeared in a methodological note.
The card table
The country cards carry no inequality field and no poverty field. They carry the labour-market and demographic quantities that determine who is in a position to claim a share of output, and Table 23.1 sets those out for the fourteen countries this chapter discusses.
| Country | Term one: working-age population | Term two: employment ratio | Term three: output per worker | Wage employment (percent of employment) | Informal employment (percent) | GDP per head ($) | Confidence |
|---|---|---|---|---|---|---|---|
| South Africa | 1.61 | -0.45 | -0.48 | 82.7 | 34.8 | 6,769 | high |
| Namibia | 2.64 | -0.37 | -1.05 | 63.2 | 55.6 | 4,862 | low |
| Botswana | 1.78 | 0.41 | -0.11 | 71.9 | 75.6 | 7,662 | medium |
| Zambia | 3.70 | 0.59 | -0.93 | 27.9 | 82.7 | 1,318 | medium |
| Nigeria | 2.90 | 0.29 | -1.94 | 13.6 | 93.1 | 1,223 | low |
| Ethiopia | 3.46 | -1.58 | 5.91 | 15.4 | 77.7 | 987 | low |
| Kenya | 2.94 | -1.17 | 2.84 | 35.1 | 86.5 | 2,558 | high |
| Ghana | 2.52 | -1.56 | 3.48 | 32.2 | 78.1 | 3,271 | medium |
| Senegal | 3.51 | 1.50 | 0.27 | 35.3 | 89.2 | 1,936 | high |
| Egypt | 1.96 | 0.07 | 2.26 | 72.9 | 68.6 | 3,379 | high |
| Morocco | 1.10 | -0.45 | 1.88 | 59.6 | none recorded | 4,842 | high |
| Tunisia | 0.53 | -0.19 | 0.48 | 75.0 | 36.9 | 4,664 | high |
| Rwanda | 2.83 | 0.65 | 3.26 | 59.1 | 84.3 | 1,128 | high |
| Togo | 2.74 | 0.02 | 1.98 | 23.0 | 92.3 | 1,217 | medium |
| Continental median | 2.89 | -0.15 | 0.74 | 31.0 | 89.1 | 1,678 |
The first three columns are annual growth rates in percentage points over 2014 to 2024; the next three are levels; the last is the book’s own flag. Term one is the working-age population aged 15 to 64, term two modelled employment aged 15 and over divided by that population, term three the residual output-per-worker series. The informal share is on 45 of the 54 cards and Morocco is one of the nine without it. The median row is taken column by column and is not a country. Sources: UN World Population Prospects 2024, ILOSTAT modelled estimates (November 2025) and the IMF World Economic Outlook (April 2026), via the country cards.
The fourteen hold 49.9 percent of the continent’s population and produce 57.7 percent of its output, and seven of them carry a high confidence flag, four medium and three low. Read down the wage-employment column and the distributional argument arranges itself without any inequality statistic at all. In South Africa, Botswana, Namibia, Egypt and Tunisia most people who work do so for a wage paid by somebody else, and the state can therefore see, tax and in principle redistribute their income. In Nigeria, Ethiopia, Togo and Zambia most people who work are paid by nobody, and the state can see almost none of it: 93.1 percent of Nigerian employment is informal against a continental median of 89.1. Chapter 6 owns that structure. What it means here is that the instrument the rich world redistributes with, a payroll, exists for a minority of Africans, and Section 2 is about what follows.
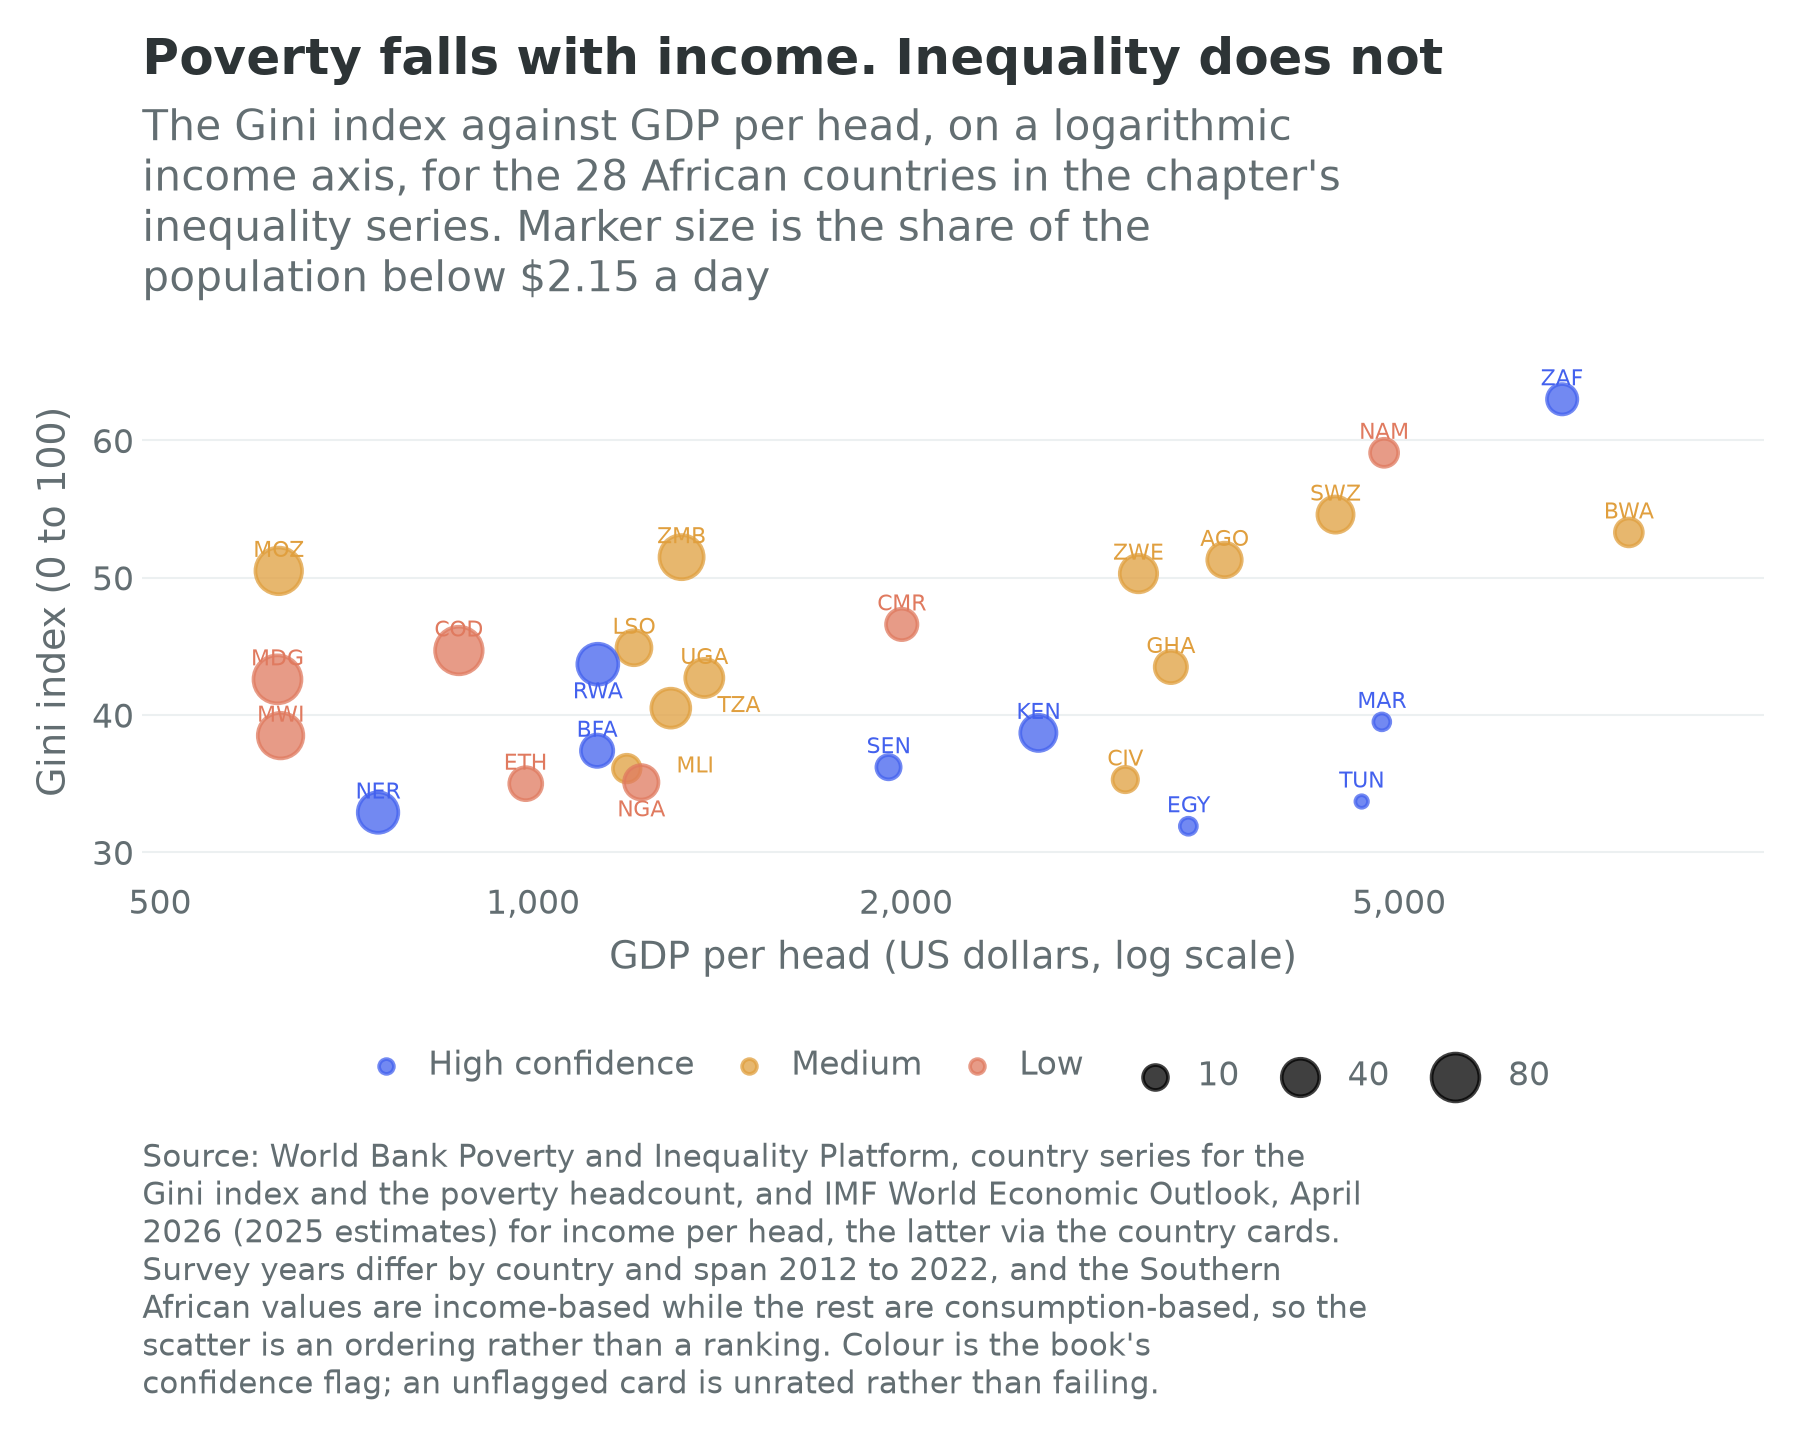
Figure 23.1 makes the section’s argument in one picture. Marker size, the share below the extreme-poverty line, shrinks steadily from left to right: poverty is an income phenomenon and richer African countries have less of it, which is the least surprising finding in this book. Vertical position, the Gini index, does nothing of the kind. Madagascar at $622 per head and Ghana at $3,271 record almost the same measured inequality, and the two richest countries in the series, Botswana and South Africa, sit at the top of the inequality range rather than the bottom of it. Growth reduces poverty on this continent. It does not, on this evidence, do anything predictable to inequality.
Two special cases
South Africa is the world’s most unequal measured economy and Chapter 25 carries the settlement that produced it: a 1994 transition in which political power transferred completely and economic ownership almost not at all, sitting on a labour market organized around the exclusion of the poorest (Seekings and Nattrass, 2005; Levy, Hirsch, Naidoo and Nxele, 2021). What belongs here is a warning about how the number is used. South Africa’s Gini is genuinely extreme, and part of the gap between it and its neighbours is a measurement artefact: the South African series is income-based while most African series are consumption-based, and income is always more unequally distributed than consumption because households smooth. A country that measures itself better than its neighbours will look worse than them, which is a version of Chapter 1’s problem arriving in the distributional data.
The identity says the rest. South Africa records the continent’s highest wage-employment share, at 82.7 percent, and one of its worst employment outcomes, an employment ratio falling at 0.45 percent a year on an output-per-worker series that also fell, at 0.48 percent. Inequality in a country like that is not mainly about the distribution of wages. It is about the boundary between the people who have one and the people who do not, which is why the grant system of Section 2 does so much work and why it has not closed the gap.
North Africa is the opposite puzzle and it is instructive precisely because the two puzzles have the same cause. Egypt and Tunisia record measured Gini indices in the low thirties, comparable with Western Europe and lower than almost anywhere in Sub-Saharan Africa. Almost nobody who has lived in either country believes it. The reconciliation comes from the tax data: when Alvaredo, Assouad and Piketty (2019) assembled income tax records, national accounts and surveys for the Middle East including North Africa, they found the top tenth taking on the order of 64 percent of regional income, which would make it the most unequal region in the world, against household surveys implying nothing of the sort. The mechanism is that household surveys do not reach the very rich, who decline to answer, understate what they have, and hold much of it abroad. A survey-based Gini is therefore a measurement of the part of the distribution that answers the door.
That is the honest position on African inequality statistics and it cuts both ways. Southern Africa’s measured inequality is real and probably slightly overstated relative to its neighbours by the welfare concept used; North Africa’s measured equality is substantially understated by the instrument; and the continental average of the two tells a reader almost nothing.
What the cards cannot say
Data quality is a layer in this book, not a caveat, and the layer is thin here in three specific places.
The first is survey coverage. Every Gini and every poverty rate in this section comes from a household survey, and Chapter 10’s rule about labour-force surveys applies with equal force to consumption surveys: the countries that measure themselves are systematically richer, less informal and more waged than the countries that do not, so a continental average puts its least anchored numbers at exactly the end of the distribution where the argument is sharpest. The survey years behind Figure 23.1 span 2012 to 2022. Morocco’s is more than a decade old, in a country whose card carries a 2024 census and a 2024 labour-force survey. The Democratic Republic of the Congo’s survey frame rests on the 1984 census.
The second is that the cards carry almost nothing. There is no Gini field, no top-share field and no poverty field on any of the 54, which is why every inequality number in this section is cited to a source outside them. The one distributional field the card schema does reserve is filled on thirty-nine of the fifty-four, and it is worth reading slowly, because both the thirty-nine and the fifteen have something to say. Afrobarometer’s lived-poverty index asks respondents how often in the past year they or their family went without food, clean water, medicine, cooking fuel or a cash income, and averages the five answers on a scale running from none of it to all of it constantly (Afrobarometer, 2025). The result needs no price index, no consumption aggregate and no expenditure recall, so it fails in different ways from the money-metric measures rather than in the same ways. The continent it describes runs from Seychelles at 0.36 to Mauritania at 2.11, with a median of 1.47.
Set against the rest of the card it behaves as an experiential measure should, which is to say it agrees with income enough to be believable and disagrees enough to be worth having. It falls as income rises, at a correlation of about minus 0.54 against the logarithm of GDP per head across the thirty-nine. What it tracks far more tightly is informality: across the thirty-five cards carrying both, the correlation is about 0.77, closer than the index comes to anything else on the card, which is Section 1’s argument arriving through the front door. And the disagreements are the point. Gabon reports 1.79, among the ten worst readings on the continent, on 9,376 dollars a head; Sierra Leone reports 1.29 on 874 dollars and Tanzania 1.13 on 1,292. Angola and Ghana sit within a few hundred dollars of each other and report 1.99 and 0.91. A mean income divided by a population says none of that, and an oil economy is where it says least.
Now the fifteen empty cards, which are the most informative nulls in the book’s data layer. Algeria, Burundi, the Central African Republic, Chad, the Comoros, the Democratic Republic of the Congo, Djibouti, Egypt, Equatorial Guinea, Eritrea, Guinea-Bissau, Libya, Rwanda, Somalia and South Sudan were not surveyed in this round. Ten of the fifteen are on the World Bank’s fragility list, against twenty-one of the fifty-four overall (World Bank, 2025a). That is not a coincidence and it is not a complaint about Afrobarometer: a face-to-face national probability sample, published under the answers people actually gave, needs a government that will license it, enumerators who can reach the sampling points, and a respondent willing to say on the record that the household went hungry. The field’s coverage is therefore close to a map of where those three conditions hold. The thirty-nine hold 75.2 percent of Africa’s people and produce 72.0 percent of its output, which sounds like enough and is not. An average across them is a statement about the countries where the survey can be run, and this book does not call such a thing African. The map shades thirty-nine countries by what their citizens report; the fifteen it leaves blank are blank for reasons that belong in this chapter rather than in a footnote.
The third is conceptual. Everything above measures the distribution of income or consumption; almost nothing measures the distribution of wealth, which on this continent is mostly land, and Chapter 22 is where that argument lives. A country where the median household holds an unregistered claim on a plot it cannot sell, mortgage or defend has a wealth distribution no survey has ever seen.
2. What the state does about it
The coverage numbers
The International Labour Organization’s standing measure of a social protection system is effective coverage: the share of the population receiving at least one contributory or non-contributory benefit. Globally that share has risen past half. In Africa it is on the order of 19 percent, the lowest of any region, and the share of Africans above retirement age receiving a pension is on the order of 32 percent (ILO, 2024). Both numbers are averages over an extraordinary range, and the range is the finding.
At one end, tax-financed pensions in Southern Africa reach about three quarters of people above retirement age (ILO, 2024). Lesotho, Botswana, Namibia, Mauritius and South Africa are the clearest national cases of a universal or near-universal non-contributory pension. At the other end sit the countries of Chapter 10’s fourteen, where a pension is something a retired civil servant has.
Two structural features explain most of the gap and both are Chapter 6’s. Contributory social insurance, the instrument that covers most people in most rich countries, requires a payroll to deduct from, and in a country with 93.1 percent informal employment there is almost nothing to deduct from. Across the 45 cards carrying the field the median informal share is 89.1 percent. And non-contributory transfers require a state that can find people, which is Chapter 5’s narrow definition of capacity and the subject of the delivery problem below.
A coverage rate of 19 percent should not be read as meaning that four in five Africans are uninsured against everything, only that they are uninsured by the state. Chapter 6 catalogues what stands in its place: the rotating savings clubs, the stokvel and the equb and the tontine, which supply commitment more than credit; the Ethiopian iddir, a burial and mutual-aid society that pays out on a death or another shock and is the closest thing to community insurance in a country with almost no formal cover; and, in the Muslim-majority economies, zakat, the obligatory annual alms of a fixed share of qualifying wealth, and sadaqa, voluntary charitable giving, which together move a substantial and almost entirely unmeasured volume of resources between households. None of these is a substitute for a state transfer, because all of them pool risk inside a community and therefore fail exactly when the whole community is hit, which is what a drought, a currency collapse or a pandemic is. But they are the reason a family with no grant is not without recourse, and a reform that displaces them without replacing them makes households worse off.
The programmes
African social protection is therefore overwhelmingly non-contributory, mostly recent, and much more substantial than the coverage number alone suggests. Six programmes carry most of the continental caseload.
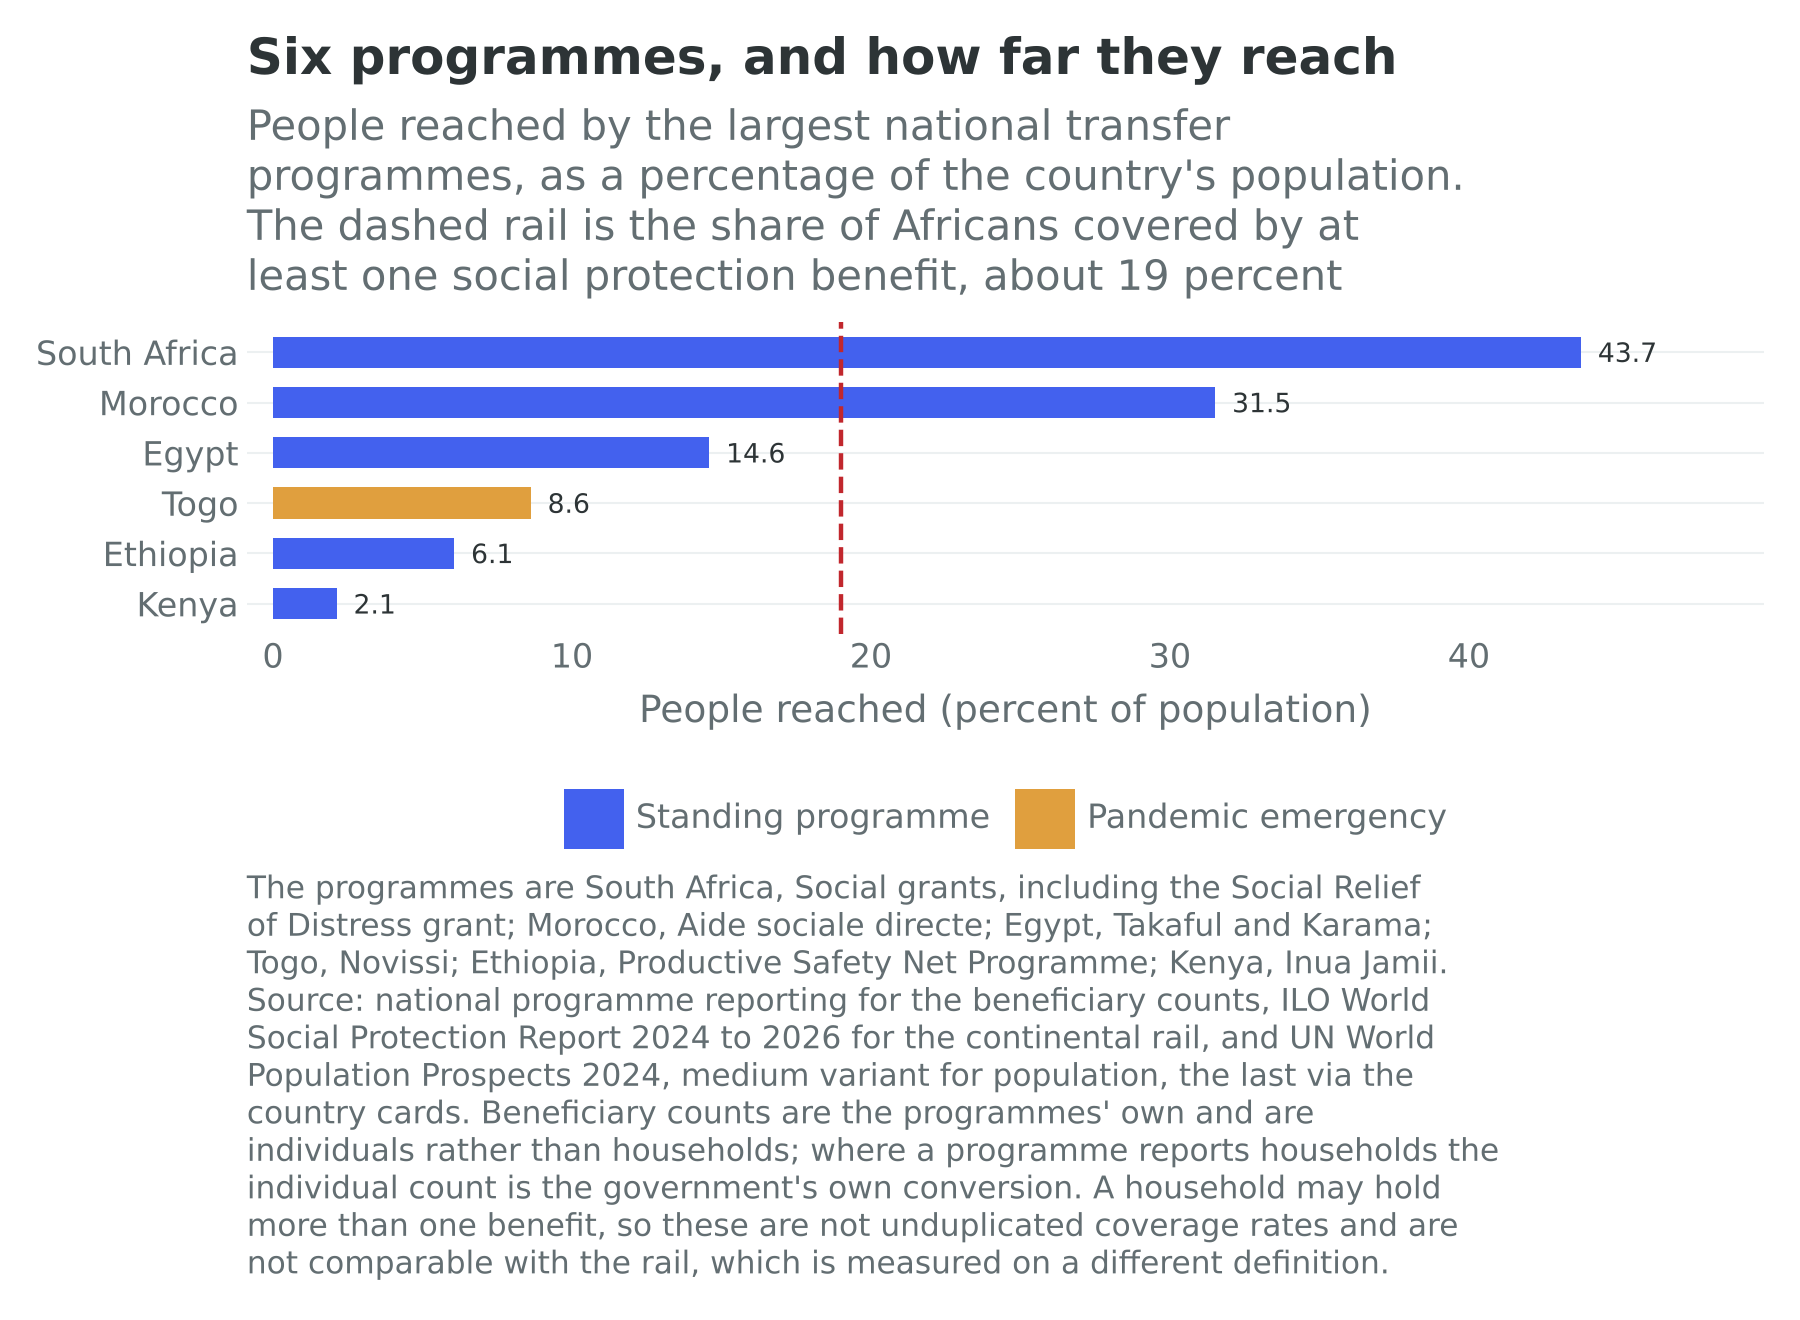
South Africa’s grants are the oldest and by far the largest. The old-age grant, the child support grant, the disability grant and their relatives reach on the order of 19 million people; the Social Relief of Distress grant, introduced as a pandemic emergency measure in 2020 and repeatedly extended since, reaches more than 9 million more (Dondolo, 2025). Together they are the reason a country with the continent’s worst unemployment has a measured poverty rate far below its income peers, and they are one of the largest single items in non-interest public spending. Chapter 25 carries the fiscal politics. What matters here is that South Africa is doing the thing the rest of the continent is being urged to do, at scale, for thirty years, and its Gini has not moved.
Ethiopia’s Productive Safety Net Programme is the largest outside South Africa: a public-works and direct-support scheme reaching a chronic caseload of about 8 million people, about 7 million of them on public works for six months of the year and about 1 million on year-round direct support, with an emergency caseload on top that moves with the harvest (European Union Delegation to Ethiopia, 2025). Chapter 29 names it as the net built to absorb the Horn’s five failed rainy seasons and Chapter 11 as the thing that catches a failed harvest. Its design is the interesting part: most beneficiaries work on soil and water conservation for their transfer, which makes it a safety net, a labour programme and a rural-infrastructure programme at once, and which is also the source of the standing objection that public works are an expensive way to deliver a transfer.
Egypt’s Takaful and Karama, launched in 2015, reaches about 4.7 million families and some 17 million direct and indirect beneficiaries, with a conditional transfer for families with children and an unconditional one for older people and people with disabilities (Ministry of International Cooperation, 2025). Chapter 27 sets it beside the bread subsidy it is slowly intended to replace. The pair is the clearest African instance of the reform every fund and every ministry recommends: stop subsidizing a commodity everybody buys and start paying money to the households you meant to help.
Morocco’s aide sociale directe, launched at the end of 2023, is the fastest large rollout on the continent: about 4 million households, some 12 million people, by May 2025, on a budget of 26.5 billion dirhams that year (Finances News Hebdo, 2025), and the government has tied its financing to the gradual removal of the butane subsidy (El Masaiti, 2024). That is the same reform again.
Kenya’s Inua Jamii pays KSh 2,000 a cycle to more than 1.2 million people, older persons aged 70 and above and people with severe disabilities (Citizen Digital, 2025). Beside a population of 56.4 million that is a small programme, and the distance between it and South Africa’s is the largest single fact in Figure 23.2.
Nigeria’s case is the most instructive because it has run into the delivery problem hardest. The National Social Register, built over a decade, holds tens of millions of individuals in poor and vulnerable households. After the fuel subsidy was removed on 29 May 2023 the government announced a transfer of 75,000 naira, ₦, paid in three monthly tranches, to 15 million households, explicitly as one of the measures to cushion the price rise (Ripples Nigeria, 2023). Chapter 12 owns the subsidy and Chapter 24 the settlement. What belongs here is that the announcement and the payment are two different events: by March 2026, nearly three years after the subsidy went, about 9.2 million households had received the first tranche and 6.5 million the third (Daily Trust, 2026). A register is not a payment system.
Two further programmes are worth naming for what they demonstrate. Senegal’s bourses de sécurité familiale, running since 2013, paid more than 355,000 households in March 2026 and is the francophone West African template (Le Soleil, 2026). And Togo’s Novissi, launched within days of the March 2020 lockdown, paid mobile-money transfers to about 820,000 people by March 2021, enrolled by phone with no in-person registration, and when the register ran out it used satellite imagery and mobile-phone metadata to find the poorest districts and subscribers (Debenedetti, 2021; Aiken et al., 2022). It is the clearest African demonstration that a state with a payments rail and a phone network can move money to unregistered people in weeks. It is also, and the enthusiasm usually omits this, a programme that ended.
The fiscal arithmetic
Now price it, because everything above is a description and the argument this chapter was asked to make is an arithmetic one.
Take the simplest possible transfer: one dollar a day, every day, to every person aged 15 to 64, with no targeting, no conditions and no administration. The cards carry what is needed to cost it. The working-age population follows from the card’s population and its dependency ratio, since the ratio counts dependants per hundred people of working age, and output is on the card in dollars.
In South Africa the transfer would reach 43.2 million people and cost $15.8 billion a year, which is 3.7 percent of output. In Kenya it would reach 34.0 million people and cost $12.4 billion, or 9.1 percent of output. In Nigeria it would reach 130.2 million people and cost $47.5 billion, or 16.4 percent of output. In Ethiopia it would reach 76.2 million people and cost $27.8 billion, or 25.5 percent of output.
Set those against Chapter 5’s opening fact. The governments of the 36 African countries in the continental revenue statistics collected on average on the order of 16 percent of their output in tax in 2022 (OECD, African Union Commission and ATAF, 2024). A dollar a day to every working-age Nigerian would therefore cost, to a rounding error, the entire tax revenue of an average African state. In Ethiopia it would cost more than half as much again as all tax revenue. In South Africa, whose tax take as a share of output is well above the continental average and whose transfer costs 3.7 percent of that output, it is affordable, which is why South Africa is the country that actually does this and nobody else is.
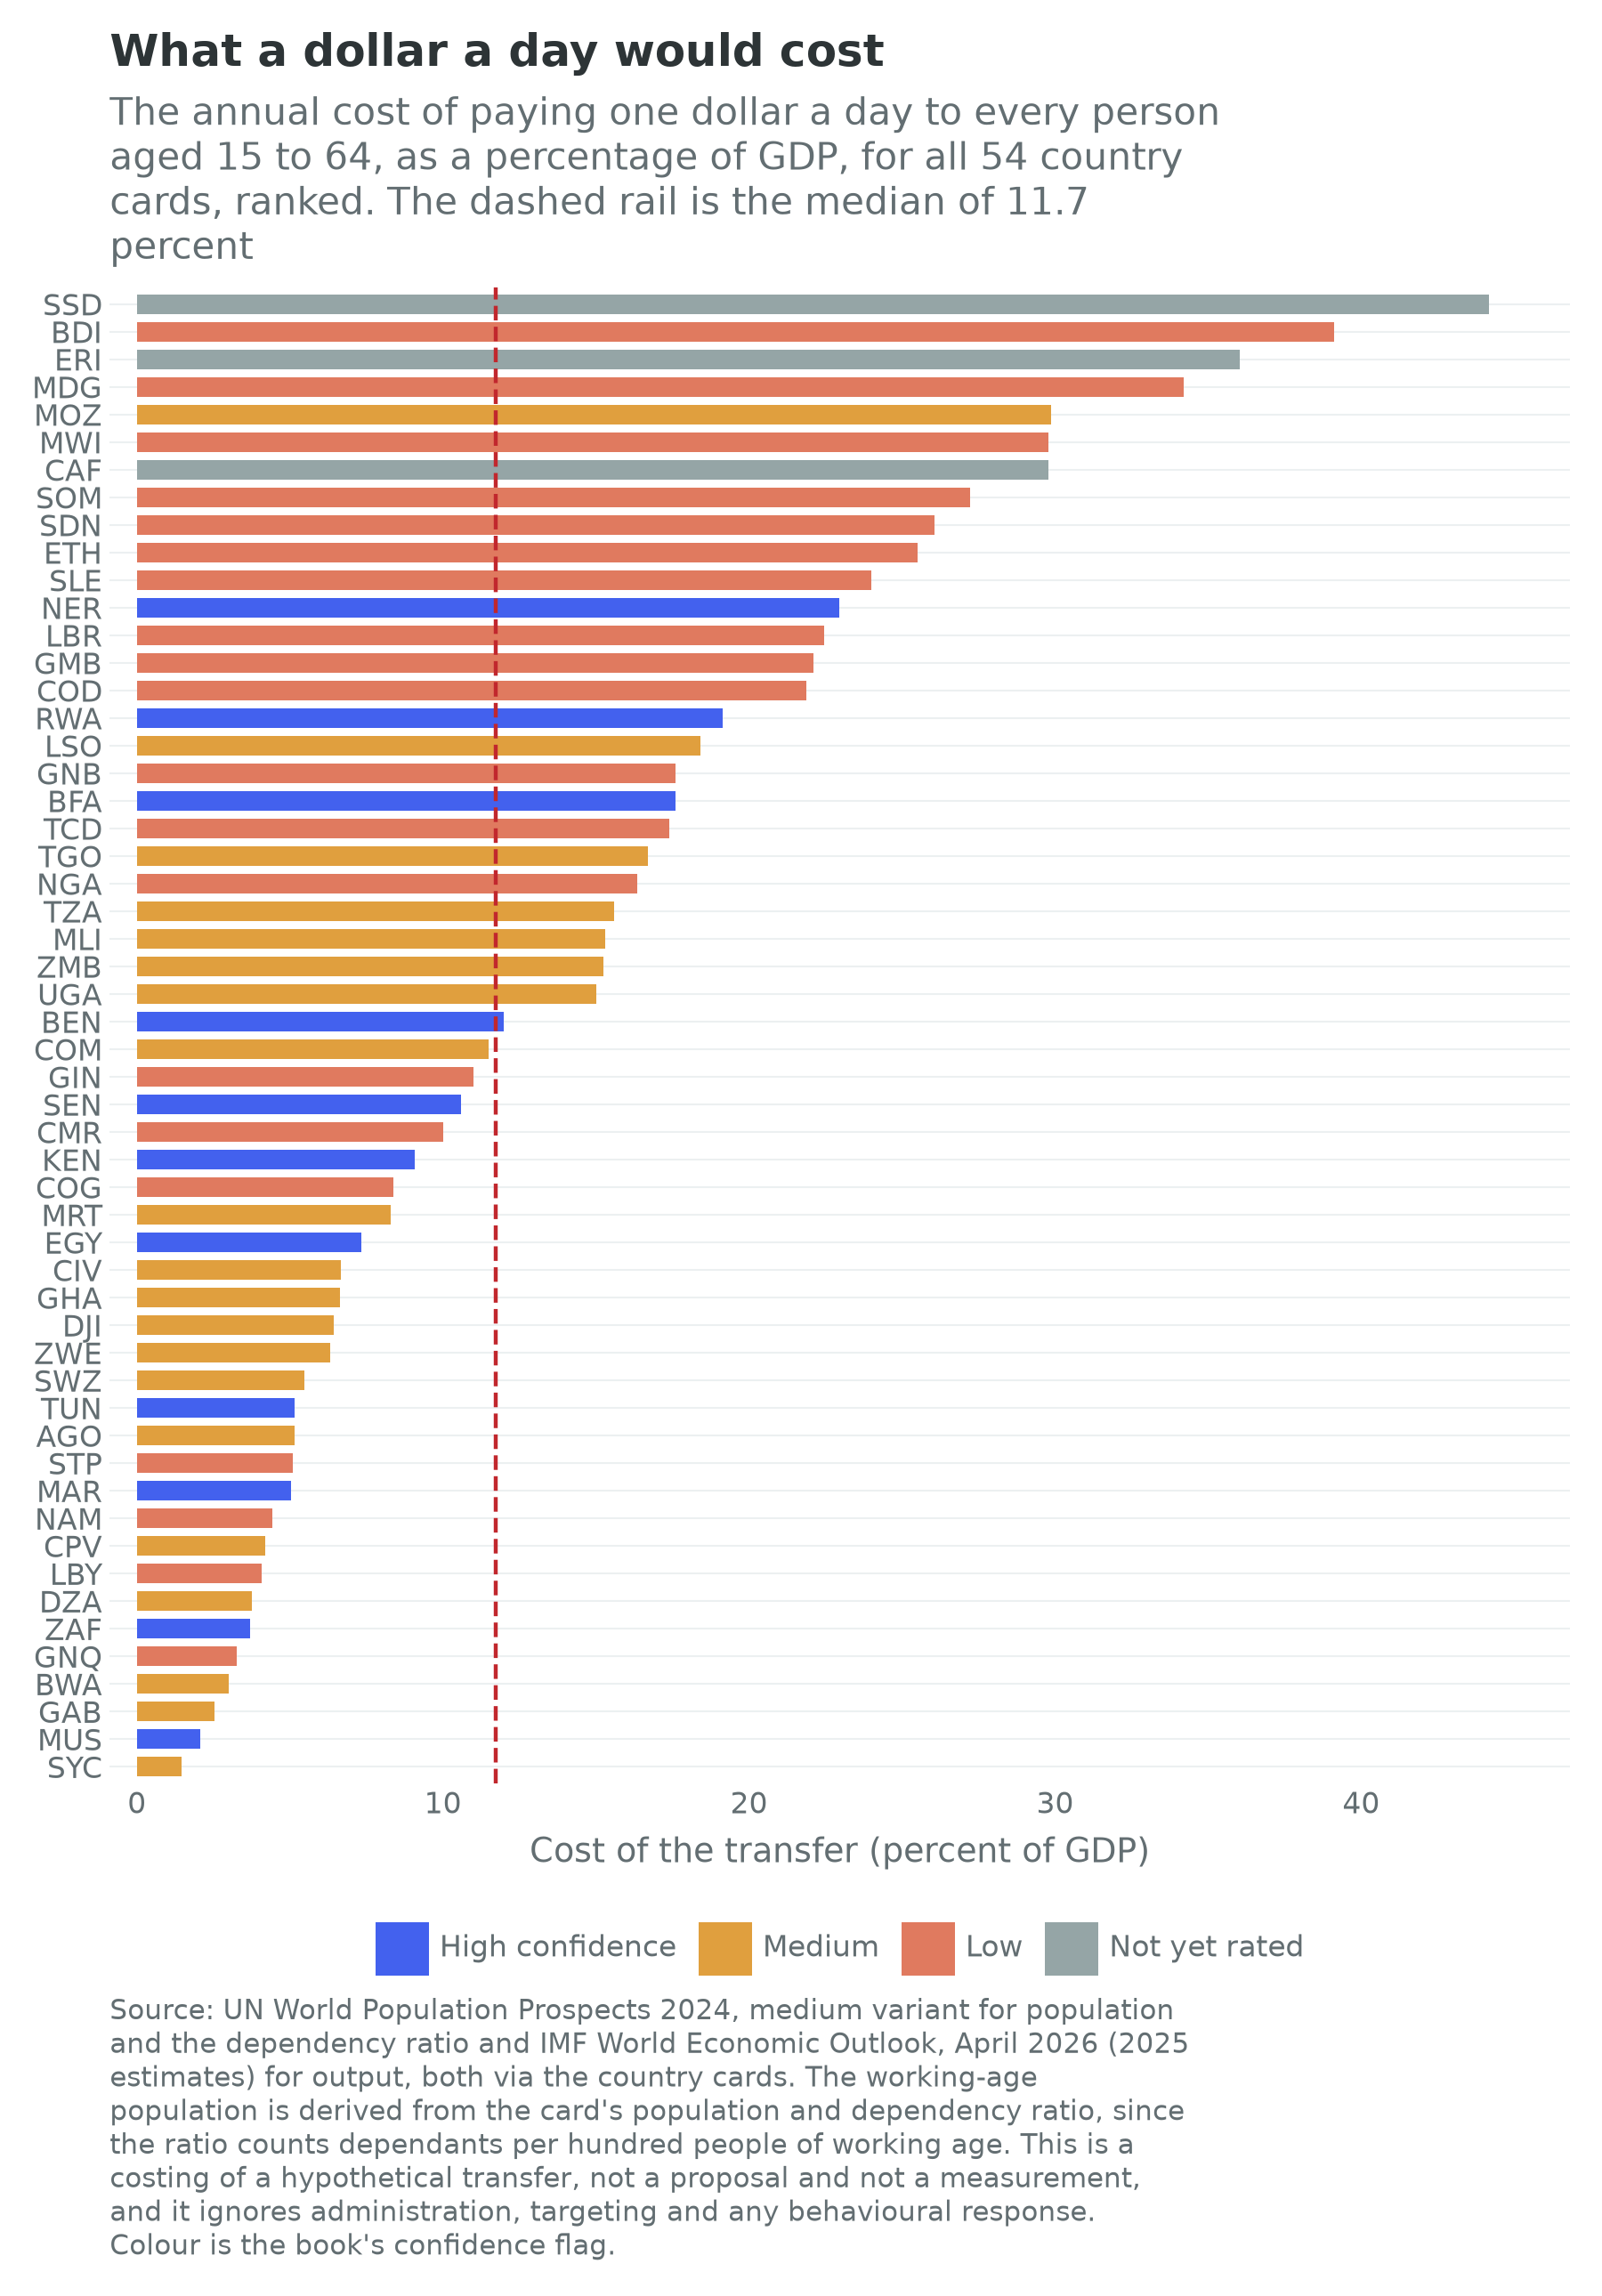
Figure 23.3 ranks all 54 and the shape of the distribution is the finding. The median country would spend 11.7 percent of its output on the transfer, which is about three quarters of the average African tax take; fifteen would spend more than a fifth of output and twenty-four less than a tenth. At the expensive end sit South Sudan at 44.2 percent, Burundi at 39.1, Eritrea at 36.0 and Madagascar at 34.2. At the cheap end sit Seychelles at 1.5 percent, Mauritius at 2.1, Gabon at 2.5, Botswana at 3.0 and Equatorial Guinea at 3.3.
Look at that second list. Across the 54, the cost of the transfer as a share of output correlates with the logarithm of income per head at minus 0.91, which is about as tight as anything in this book. That is not a coincidence and it is not really a finding about transfers. A fixed dollar amount per head, divided by output per head, is income per head upside down with a demographic correction, so the ranking is measuring how poor a country is and how many dependants it carries. Which is the point. A universal transfer is cheapest exactly where the state has the least reason to pay it, and most expensive exactly where it would matter most. The cheap end of Figure 23.3 is a list of oil, diamond and tourism economies with small populations and thin labour markets, with South Africa the one large exception. The expensive end is thick with the countries of Chapter 10’s fourteen, six of the ten most expensive being on that list.
One more line of the arithmetic, because a reader will reach for it. Halving the transfer and widening it to everybody rather than to adults saves almost nothing, because African populations are so much larger than their working-age subsets: fifty cents a day to every resident costs 14.6 percent of output in Nigeria against 16.4 for the working-age version, and 22.1 percent in Ethiopia against 25.5. The dependency ratio is doing the work. In an economy with 73.9 dependants per hundred adults of working age, universality is expensive by construction.
Three problems: financing, delivery, settlement
Financing. If there is no payroll the money has to come from somewhere else, and the two candidates are indirect taxation and rents. The reform every institution recommends, and the one Egypt, Morocco, Nigeria and Angola have each attempted in the last four years, is to convert a universal price subsidy into a targeted transfer. The logic is unanswerable in a spreadsheet: a fuel subsidy accrues in proportion to fuel consumed, which is to say in proportion to how many vehicles a household owns, so it is a transfer to the urban middle class paid for by everybody, and Chapter 12 shows that Nigeria’s reached several percent of GDP in bad years and that removing it saved the federation ₦15.8 trillion between June 2023 and December 2025 (Oladele, 2026). The logic also, as Chapter 12 says, arrives with the political cost immediately and the fiscal benefit over a parliament, and the Egyptian bread subsidy is the standing illustration: raising the price of the baladi loaf in June 2024 for the first time since 1989 still left it covering about 16 percent of the cost of the loaf (Chapter 27). Subsidy reform is the most promising financing source for African social protection and the reform most likely to end a government.
The other candidate is the resource rent, and it has a proposal attached. Moss, Lambert and Majerowicz (2015) set out the oil-to-cash idea: distribute a fraction of petroleum revenue directly to citizens as a universal dividend and tax part of it back, on the reasoning that a citizen who receives and is taxed on a visible payment acquires an interest in how the rest is spent, which is the fiscal contract the rent destroyed. Chapter 12 records that no African producer has implemented it and that its advocates present it as a hypothesis with an implementation problem rather than a result. The arithmetic of Figure 23.3 is why it keeps being proposed: in Angola a dollar a day to every working-age adult is 5.2 percent of output, in the Republic of the Congo 8.4 percent and in Equatorial Guinea 3.3 percent, sums that are large but not absurd against hydrocarbon revenues.
Delivery. A transfer system is a register plus a payment rail, and Africa has had a decade of unusual progress on both. Chapter 17 records that Nigeria’s national identification number passed 130 million enrolments by mid-2026, that Kenya has issued the maisha namba since 2023 and that Ethiopia’s fayda had registered over nine million residents by 2024. Chapter 16 records that about $1.4 trillion moved through mobile money in Sub-Saharan Africa in 2025, roughly two thirds of the global total (GSMA, 2026), and Chapter 8 what cheap payments did to household risk-sharing in Kenya (Jack and Suri, 2014; Suri and Jack, 2016). Put a register beside a wallet and the marginal cost of paying a poor rural household falls close to zero, which is the technical precondition for everything in this section and which did not exist in 2005.
Two cautions belong beside that. The first is Chapter 17’s: the strongest evidence for identity systems is a payments result, Muralidharan, Niehaus and Sukhtankar (2016) on biometric smartcards in Andhra Pradesh, where payments became faster, more predictable and less leaky with no loss of access. It is not a result about conditioning a SIM card or a school place on an identity number, which is what most African implementations have done first. The second is Chapter 5’s and is harder. Kananga’s door-to-door property-tax campaign raised compliance from 0.1 percent to 11.6 percent, and the complementary experiment showed local chiefs collecting better than central agents because they knew which households could pay (Weigel, 2020; Balán, Bergeron, Tourek and Weigel, 2022). Run those findings backwards and they are a statement about transfers: the information about who is poor sits with the same local authorities, and a state that cannot find a household to tax it cannot find the household to pay it either.
Settlement. The last problem is the one the technical literature is worst at, and Chapter 5 supplies the vocabulary. A transfer is a rent in that chapter’s precise sense, an income received by decision rather than by production, so it is a political instrument and the question of who it buys is a design question rather than a cynical one. South Africa’s grants are paid on demographic categories, which makes them hard to allocate politically and correspondingly durable. Nigeria’s post-subsidy transfer was paid against a register assembled state by state, which made it a federal transfer administered through state governments, with all that implies. Ethiopia’s public works are allocated by community committees, which puts the allocation exactly where Chapter 5 says the information is and exactly where the local settlement is.
The general point is Dercon’s. An elite that has bet on growth has a reason to build a transfer system, because a growth strategy needs a population that survives its transitions. An elite that has bet on dividing what exists has a reason to build one too, because a transfer is the most efficient patronage instrument ever invented. The two look identical in a budget line and different in who is on the register.
3. What the experiments say
Can a state that cannot tax finance a transfer that works, and does the transfer build the economy it is spent in?
Cash transfers are the most heavily randomized instrument in development economics, which is fortunate, because the aggregate data above can price a transfer and cannot say what one does. Eight findings mark out what this literature settles and what it does not.
The multiplier is large, and that is the systems result. Egger, Haushofer, Miguel, Niehaus and Walker (2022) delivered one-time transfers of about a thousand dollars to more than 10,500 households across 653 randomized villages in Siaya County, Kenya, a fiscal shock worth over 15 percent of local annual output, and measured non-recipients, firms and prices as well as recipients. This is the book’s recurring box and it gets its fullest treatment here. The design is what makes it a systems result rather than a programme evaluation: randomizing at village level and then saturating a whole geography turns general-equilibrium effects, which every household-level study treats as contamination, into the object of measurement. They recovered a local fiscal multiplier of about 2.5, with large positive spillovers to households that received nothing, an expansion of local enterprise revenue, and price inflation well under one percent. The transferred dollar was spent, the receiving firm hired and restocked, and the second-round income accrued to people the programme never touched. That is the difference between a transfer system that sustains an economy and one that merely sustains consumption, and it is the strongest available answer to the objection that transfers are charity rather than development. Two qualifications hold it in place: the multiplier is local, measured in an economy with idle capacity and slack labour, and Chapter 26 reads the same number less warmly, as evidence that the binding constraint on East African rural activity is demand rather than technology.
The scale of the study changes the sign of the spillover. Haushofer and Shapiro (2016) evaluated the same organization’s unconditional transfers in western Kenya at much smaller scale and found large gains in assets, consumption, food security and psychological wellbeing. Their follow-up three years later found the recipients’ gains in assets persisting. Non-recipients inside treated villages showed lower consumption and food security than households in untouched villages, a spillover the authors treat as suggestive (Haushofer and Shapiro, 2018). Egger and co-authors, saturating a much larger geography, found positive spillovers. The two designs suggest that the frame determines the answer: at village scale a transfer can move relative position, at district scale it moves aggregate demand. The village-scale spillover is the less secure of the two results, and a ministry costing a national programme should be reading the second.
Money is not spent on drink. Evans and Popova (2017) reviewed nineteen studies across Africa, Asia and Latin America and found almost no case of transfers raising spending on alcohol or tobacco, and several reducing it. The finding is boring and has to keep being restated, because the objection it answers is the one that decides parliamentary votes.
A one-off grant accelerates and does not transform. Blattman, Fiala and Martinez (2014) evaluated Uganda’s Youth Opportunities Program, which gave groups of young people cash grants of about $382 each to start skilled trades. At four years recipients had substantially more business assets, higher earnings and more hours of work, and the return looked extraordinary. The nine-year follow-up is why it is in this box: by then earnings and consumption had largely converged, the control group having accumulated capital more slowly out of its own earnings, while the extra durable assets and the shift into skilled trades remained (Blattman, Fiala and Martinez, 2020). The grant bought four years of earlier income, not a permanent change in earnings. That is a real benefit and not the benefit the programme was sold on.
Bundling works where cash alone does not, for the very poorest. Banerjee, Duflo and others (2015) evaluated a graduation programme across six countries, Ethiopia and Ghana among them, in which the poorest households received a productive asset, training, consumption support, savings access and coaching over about two years. Consumption, assets, food security and mental health were all higher a full year after the programme ended, and benefits exceeded costs in five of the six sites; the exception, Honduras, failed because the poultry died. For the very poorest the evidence favours a package over a payment, and a package costs several times what a payment costs.
The condition buys the outcome it conditions on and costs the others. Baird, McIntosh and Özler (2011) randomized conditional against unconditional transfers for adolescent girls in Zomba, Malawi. The conditional arm, paid on school attendance, produced better schooling outcomes. The unconditional arm produced sharply lower rates of early marriage and teenage pregnancy among girls who had already dropped out, whom the condition would have excluded by construction. Conditionality is not a general improvement on unconditionality; it is a choice of which outcome to buy and which population to lose.
A guaranteed income changes behaviour differently from a one-off payment. Banerjee, Faye, Krueger, Niehaus and Suri (2023) report short-term results from the longest-running universal basic income experiment anywhere, across 195 villages in western Kenya, with arms receiving a small monthly payment for twelve years, the same payment for two years, or the two-year sum as a lump sum. The lump-sum and long-term arms produced substantially more enterprise creation and investment than the short-term monthly arm, and no arm showed a rise in spending on temptation goods. A lump sum is capital and a small monthly payment is consumption, unless the payment is credible for long enough that a household can save into it or borrow against it. That is the strongest argument in this box for making a transfer permanent rather than generous.
On the health side, the return is measured in decades. Miguel and Kremer (2004) randomized school-based deworming across 75 schools in Busia, Kenya, and found large reductions in absenteeism with substantial spillovers to untreated children in treated and neighbouring schools, which is why treating a worm is a public good rather than a private one. The long-run follow-ups make it a systems result: at ten years the treated cohort worked more hours and had moved into non-agricultural self-employment (Baird, Hicks, Kremer and Miguel, 2016), and, measured up to twenty years later, consumption and hourly earnings roughly an eighth to a seventh higher (Hamory, Miguel, Walker, Kremer and Baird, 2021). The reanalysis debate of 2015 is worth reading beside it, because the absenteeism finding is more robust than some of the downstream ones. The comparison case is historical rather than experimental: Bleakley (2007, 2010) traced hookworm eradication in the American South and malaria eradication in the Americas and found the same shape. Disease control is a term-three investment with a twenty-year lag.
Put the eight together and the systems question has half an answer. A transfer reaching a poor rural economy does more than feed a household: the multiplier is real, the money is not wasted, and the health investments pay over decades. What no experiment establishes is the thing this chapter’s arithmetic is about, because none of them financed anything. Every transfer above was paid by a foreign donor or a research budget, and whether a state collecting 16 percent of output in tax can pay 12 percent of output in transfers is not a question randomization can answer. The gap between what can be demonstrated and what would have to be delivered is the honest shape of the evidence base under this chapter, as it is under Chapters 5 and 20.
4. The body
Chapter 2 owns the demography and made the argument this section reprises: child survival falls before fertility does, so health spending is not a competing claim on the growth budget but the first stage of it. What belongs here is the distributional half, in four facts, a financing problem and a productivity channel. The country cards carry no health field and the book’s demographic benchmark table carries population totals rather than mortality series, so every number here is cited to a source outside them.
The first fact is that the transition happened. African life expectancy at birth has risen from something under fifty years in 1980 to something around sixty-four today, and under-five mortality in Sub-Saharan Africa has fallen from roughly 180 deaths per thousand live births in 1990 to roughly 70 (UN Inter-agency Group for Child Mortality Estimation, 2025). That is one of the largest improvements in human welfare recorded anywhere in three decades and the least celebrated finding in this book. It is also the mechanism behind Chapter 2’s fertility projections and therefore behind the identity’s first term.
The second is that the burden is unlike anywhere else. The African region carries about 95 percent of the world’s malaria cases and about 95 percent of its malaria deaths, some 579,000 deaths in 2024, roughly three quarters of them children under five (World Health Organization, 2025). Eastern and southern Africa remain the epicentre of the HIV epidemic. And the composition is changing underneath: non-communicable disease, cardiovascular disease and diabetes above all, is rising as a share of African mortality, and the WHO’s regional director warned in 2024 that it is set to overtake communicable, maternal, neonatal and nutritional diseases combined by 2030 (Ihechu, 2024), so African health systems are being asked to fight the last war and the next one at once, on the same budget (World Health Organization, 2025).
The third is the workforce, which Chapter 20 owns and which belongs here as a distributional fact. Africa carries a very large share of the world’s disease burden with a very small share of its health workers, and the outflow is documented: by November 2024 roughly one in eleven doctors in the English National Health Service held the nationality of a country the World Health Organization lists as having a critical shortage, and more than one in ten new registrants to the British nursing register in 2022 and 2023 had trained in such a country, more than half of them in Nigeria (Health Foundation, 2025). Chapter 20 declines to choose between the pessimistic and optimistic readings and so does this one. The fiscal accounting is not in doubt: the training is a public cost and the earnings are a private and foreign benefit.
The fourth is the financing, and it connects back to Section 2. In the Abuja Declaration of 2001 African Union governments undertook to allocate at least 15 percent of their budgets to health. Two decades on, two members, Cabo Verde and South Africa, met it in 2021 (Human Rights Watch, 2024), and in 2019 out-of-pocket payment was more than a quarter of current health spending in 31 countries of the WHO African region and more than half in 11 (WHO Regional Office for Africa, 2024), which is to say that a large part of African health finance is a household paying cash at the point of illness. Out-of-pocket spending is the most regressive financing instrument there is and, mechanically, one of the largest causes of households falling into poverty in the surveys that measure it. A safety net that does not cover illness is not a safety net.
The response has been an attempt at universal coverage in several forms, and the African record is genuinely mixed rather than uniformly poor. Rwanda’s mutuelles de santé, community-based insurance with premiums banded into five income categories and the poorest fully subsidised, has raised coverage from about 7 percent of the population in 2003 to more than 88 percent in 2025 and is the continent’s most-cited case (Nkurunziza, 2026). Ghana’s National Health Insurance Scheme is financed mainly by a 2.5 percent levy collected with value-added tax and a slice of social-security contributions, with premiums paid only by informal-sector members (National Health Insurance Authority, 2026); its active membership was 56.3 percent of the population in 2024, reported at 70 percent by August 2026 (Addae, 2026). Kenya replaced its National Hospital Insurance Fund with a Social Health Authority in October 2024; by August 2026 32.3 million people had registered but only about five million had paid premiums, and hospitals were still complaining of delayed reimbursements (Otinga, 2026). Egypt’s system, launched under a law of 2018, covers the six governorates of its first phase and is preparing a second in five more (Yasser, 2025); a 2021 directive had brought the completion date forward from 2032 to 2027 (Soliman, 2021). The pattern across all four is the one Chapter 20 found in education: the design is rarely the binding constraint, and the delivering institution is part of the treatment.
One thing has made the financing problem sharply worse since 2025. Chapter 21 records that official development assistance from the traditional donors fell 23.1 percent in real terms in 2025, with bilateral assistance to Sub-Saharan Africa down 26.3 percent and a further fall projected (OECD, 2026). A large share of that was health money, and the American HIV programme in particular had funded testing, treatment and health-worker salaries across eastern and southern Africa for two decades. The disruption during 2025 is real and its consequences are contested, and this chapter states the position rather than the projection: the modelling exercises published during the year projected large numbers of additional infections and deaths under continued interruption, they are models rather than observations, and the observations will take years to arrive. What is not in doubt is the lesson, which is that a health system funded from outside is a health system whose budget is set by another country’s politics.
The productivity channel closes the section. Health enters the identity as an input to the third term and reaches the second through participation. The historical evidence for that channel is the strongest in this chapter: Bleakley (2007) found that cohorts exposed in childhood to hookworm eradication in the American South and to malaria eradication across the Americas earned measurably more as adults, through a schooling and cognition pathway rather than a mortality one (Bleakley, 2010), and the deworming literature in the box above is the African experimental counterpart. Chapter 20’s stunting paragraph is the same argument from the nutrition side: more than 150 million children under five are stunted worldwide, African prevalence runs at roughly 31 percent, and Africa is the only region where the absolute number has been rising (UNICEF, WHO and World Bank, 2025). A meaningful share of the learning deficit Chapter 20 measures at age ten was determined before the child reached a classroom, and a meaningful share of the productivity deficit measured at thirty was determined before that.
That is the case for treating health as the precondition rather than the sequel, and it has an uncomfortable corollary. The returns arrive twenty years after the spending, in a different minister’s term, and they arrive as a slightly higher third term rather than as anything a government can put on a poster.
5. Distribution in two worlds
Chapter 1 asked every chapter to say what its subject becomes if the frontier of production stops needing workers. This is the chapter where Chapter 5’s version of that question lands, and it lands hardest, because Chapter 5 said so explicitly: if income no longer arrives through wages, it arrives through whatever the settlement decides to transfer.
In the labour-abundant world, distribution is a residual and social protection is a safety net. Income arrives through employment, which is the least discretionary distribution mechanism ever devised, because an elite that grows the economy through wage employment cannot easily choose who benefits. Transfers then catch the people employment misses: the old, the disabled, the children, the household whose harvest failed. Everything in Sections 2 and 3 is written for that world. The programmes are called safety nets because that is what they are, and the fiscal problem is hard but bounded, because a growing wage economy widens the base that pays for them. The hopeful version of this book’s bet runs through that mechanism, and Chapter 10 states it: as workers arrive they acquire organizational power, and settlements have to accommodate factions with power.
In the labour-redundant world, distribution is not a residual. It is the system. If output is a function of installed compute, energy and capital, and labour enters as a complement at best, then wages stop being the channel from production to income and income becomes whatever a society decides to transfer (Korinek and Stiglitz, 2021). The employment ratio stops being something to measure and becomes something to choose, and the whole apparatus of Sections 2 and 3 moves from the margin of the budget to the middle of it.
Three consequences follow, and each is uncomfortable in a different way.
The rent economies are a preview, not an exception. Chapter 12 makes this argument at sector length and it generalizes here. A hydrocarbon exporter is already an economy whose income depends on what it owns rather than on what its people produce, whose measured productivity moves with a world price, and whose state has no fiscal reason to bargain with its workforce. Everything the resource-curse literature has learned about such economies is therefore evidence about the second world rather than a curiosity of the first, and Chapter 5’s finding that 27 of the 54 African settlements are organized around dividing a rent means that a large part of the continent has been running the experiment for fifty years. The results are not encouraging.
The second world’s welfare state is a sovereign fund plus a payments rail, and Africa has more of the second than the first. The instrument set is not speculative. A country that owns an asset the world pays for, whether that is oil, copper, sunlight, land or a data centre’s electricity, can put the receipts in a fund, and a country with mobile money and a national identity number can pay a dividend out of the fund to every citizen at near-zero marginal cost. Alaska has run the first half since 1982 and Iran ran a large version of the second half after its own fuel-subsidy reform of 2010, which is the closest thing to a national universal transfer any large country has attempted (Moss, Lambert and Majerowicz, 2015). Chapter 12’s Ghanaian petroleum funds are the African instance of the first half; Chapters 8, 16 and 17 are the second half. Nobody has joined them.
Price it and the arithmetic is the one Figure 23.3 already gave, read the other way round. A dollar a day to every working-age adult costs 3.3 percent of output in Equatorial Guinea, 5.2 percent in Angola, 8.4 percent in the Republic of the Congo and 4.1 percent in Libya. Those are sums a hydrocarbon budget could carry. They are also the four countries on the continent least likely to do it, and the reason is not fiscal.
The counter-case is the whole argument and it should be stated at full strength. Chapter 5’s version is that every rent mechanism it identified, licences, land, contracts and the gate, is captured without employing anyone: a solar farm does not strike, a cobalt concession does not vote, and a carbon credit does not have to be paid a wage. An elite that does not need its population in order to produce has no economic reason to strike a bargain with it. Nothing in the technology of transfers changes that. A register and a payments rail make it cheap to pay everybody and equally cheap to pay only the people whose acquiescence is needed, and the same infrastructure that could deliver a universal dividend can deliver a precisely targeted patronage system with an audit trail. The optimistic reading of the second world is that a state which does not need workers still needs legitimacy, and buys it with a dividend. The pessimistic reading is that it needs the acquiescence of the people who could disrupt the mine, the port and the fibre, which is a much smaller number of people, and buys that instead.
The honest position is Chapter 1’s. Nobody knows which world arrives. But a reader should notice that this chapter has spent its length on instruments built for the first world, and that the second world would need every one of them, at ten times the scale, financed from a base that does not yet exist, administered by states that mostly cannot count their own people.
Connections to Other Chapters
- Chapter 2 (The Demographic Century) owns the child-survival mechanism this chapter reprises on the distributional side, and hands it the arithmetic in which a poverty rate falls while a poverty count rises.
- Chapter 5 (States, Political Settlements, and Development Bargains) supplies the vocabulary in which a transfer is a rent and the state’s ability to find a household is the binding constraint, and poses the two-worlds question this chapter’s last section answers.
- Chapter 6 (The Informal Economy) owns the structure that makes a payroll unavailable as a tax base, and Chapter 10 (Labor, Youth, and Migration) owns the employment overlays and the finding that the middle term did nothing while the other two moved.
- Chapters 8 (Money) and 16 (Finance and Fintech) own the payments rails a transfer system runs on, and Chapter 17 (Digital and Telecoms) the identity systems it runs against.
- Chapter 12 (Oil and Gas) owns the fuel subsidy, its removal and the oil-to-cash proposal this chapter prices; Chapter 11 (Agriculture) and Chapter 14 (Energy) hand it the failed harvest and the cooking-fuel burden that the nets absorb.
- Chapter 20 (Human Capital) hands this chapter the health inputs whose outputs are its own, and Chapter 22 (Land) carries the wealth distribution no income survey measures.
- Chapter 25 (Gauteng) owns the South African settlement behind the world’s highest measured inequality, Chapter 27 (Cairo to Suez) the Egyptian bread subsidy and its replacement, and Chapter 29 (Addis to Djibouti) the safety net built to absorb the Horn’s drought.
- Chapters 35 and 36 (Scenarios; What Could Go Wrong) carry the labour-redundant world as a scenario axis and the distributional failure modes this chapter’s last section only names.
Discussion Questions
The cost of a dollar a day to every working-age adult correlates with the logarithm of income per head at minus 0.91 across the 54 countries, which means the ranking in Figure 23.3 is very largely a restatement of how poor a country is. Is that a reason to discard the exercise, or is the restatement itself the finding? Answer by saying what a policymaker in Ethiopia and a policymaker in Gabon should each take from the same figure, and whether they should take the same thing.
Egger and co-authors recovered a local multiplier of about 2.5 on transfers into a rural Kenyan economy, while Blattman, Fiala and Martinez found that a one-off grant to Ugandan youths bought four years of earlier capital accumulation and no permanent change in trajectory. Both are true and they point in different directions for policy. Construct the strongest case that the two findings are consistent, then say which of them a finance minister deciding between a permanent transfer and a one-off grant programme should weigh more heavily, and why.
This chapter argues that a universal transfer is cheapest exactly where the state has least reason to pay it. Take a hydrocarbon exporter from the cheap end of Figure 23.3 and set out what would have to change in its political settlement, in Chapter 5’s sense, for an oil-to-cash dividend to be adopted. Then say whether any of those changes is more likely in a world where the frontier of production stops needing workers, and what that implies about the sequencing of Chapter 1’s two worlds.
Try It
Open the three cards side by side: South Africa, Ethiopia and Nigeria, in that order. They are the continent’s three largest transfer efforts and three entirely different distributional problems. Read down the overlays.wage_employment_share and scale.informal_employment_share rows first, which say how much of each economy a payroll tax could reach; then the three identity terms; then scale.dependency_ratio and scale.gdp_usd, which are the two numbers that decide what a transfer costs. Write one paragraph on a single question: which of the three could finance the transfer system it already runs out of its own tax base, and how much of your answer is a claim about the size of the economy rather than about the willingness of its government? Then switch on the confidence toggle on the Growth Pole Map and note that two of the three carry a low flag, which is itself a finding about how well the countries with the largest distributional problems are measured.
Data Exercise
Download all fifty-four cards from the country cards page on this site, as cards.csv if you work in a spreadsheet and cards.json if you want the release each number came from travelling beside it. Build a table with five columns: scale.population, scale.dependency_ratio, scale.gdp_usd, scale.gdp_per_capita and scale.informal_employment_share.
Then do four things. First, compute each country’s working-age population as scale.population divided by one plus scale.dependency_ratio over a hundred, and confirm the result against a country you can check independently. Second, cost a transfer of one dollar a day to every person aged 15 to 64 as that working-age population times 365 dollars, express it as a percentage of scale.gdp_usd, and rank all 54. Third, regress that percentage on the logarithm of scale.gdp_per_capita and report the correlation; then say in two sentences what the ranking is really measuring, and whether a ranking that is mostly a restatement of income per head is worth publishing. Fourth, repeat the costing with a transfer set at each country’s own extreme-poverty line rather than at a common dollar, if you can find one, and say what changes and what does not. Note which fields are null rather than zero, and never impute a null as a zero.
Data Sources and Further Reading
Key data sources
- The country cards for every identity term, population, dependency ratio, output and data-quality field quoted here: UN World Population Prospects 2024 (medium variant, ages 15 to 64) for term one and the demographic fields, ILOSTAT modelled estimates (November 2025) for terms two and three and the wage-employment and informality overlays, and the IMF World Economic Outlook (April 2026) for output and income per head. The cards carry no inequality field and no health field, which is why every such number here is cited to a source outside them; the one distributional field the schema reserves, the Afrobarometer lived-poverty index, is filled on 39 of the 54, each card carrying its own fieldwork year.
- World Inequality Lab and WID.world, and Chancel, Cogneau, Gethin, Myczkowski and Robilliard (2023) in particular, for the African top shares and the within-and-between decomposition; Alvaredo, Assouad and Piketty (2019) for the tax-data correction to the North African surveys.
- World Bank Poverty and Inequality Platform: the Gini index and the poverty headcounts in Figure 23.1, country by country and survey by survey, with the survey year on every value, and the 2025 revision of the international lines.
- ILO, World Social Protection Report: effective coverage, pension coverage and the programme inventory behind Section 2.
- National programme figures for the beneficiary counts in Figure 23.2, each from the source the text cites for that programme: South Africa’s grants (Dondolo, 2025), Morocco’s direct social aid (Finances News Hebdo, 2025), Egypt’s Takaful and Karama (Ministry of International Cooperation, 2025), Ethiopia’s Productive Safety Net Programme (European Union Delegation to Ethiopia, 2025), Kenya’s Inua Jamii (Citizen Digital, 2025) and Togo’s Novissi (Debenedetti, 2021).
- Afrobarometer for the lived-poverty index, which asks what households went without rather than what they spent: the Round 9 country means, from the pan-African profile of February 2025, are on 39 of the 54 cards with each country’s own fieldwork year of 2021, 2022 or 2023 beside the number. The fifteen the round did not reach are named in Section 1 and are not missing at random.
- World Health Organization, the UN Inter-agency Group for Child Mortality Estimation and the UNICEF, WHO and World Bank Joint Child Malnutrition Estimates for the mortality, disease-burden, health-financing and stunting figures in Section 4.
Further reading
- Lucas Chancel, Denis Cogneau, Amory Gethin, Alix Myczkowski and Anne-Sophie Robilliard, “Income Inequality in Africa, 1990 to 2019” (2023), which should be read before any continental statement about African inequality, and Branko Milanovic, Global Inequality (2016), for the between-and-within frame.
- Jeremy Seekings and Nicoli Nattrass, Class, Race, and Inequality in South Africa (2005), for the structural account of the world’s most unequal economy, with Brian Levy and co-authors (2021) for the institutional version.
- Todd Moss, Caroline Lambert and Stephanie Majerowicz, Oil to Cash (2015), for the direct-distribution proposal this chapter prices, and Chapter 12 for the sector it would be financed from.
- Dennis Egger, Johannes Haushofer, Edward Miguel, Paul Niehaus and Michael Walker, “General Equilibrium Effects of Cash Transfers” (2022), the single most important study in this chapter, read beside Christopher Blattman, Nathan Fiala and Sebastian Martinez (2020) for the nine-year view of what a grant actually buys.
- Abhijit Banerjee and co-authors (2015) on the graduation approach, Sarah Baird, Craig McIntosh and Berk Özler (2011) on conditionality, and David Evans and Anna Popova (2017) on the temptation-goods objection.
- Edward Miguel and Michael Kremer, “Worms” (2004), with the ten-year and twenty-year follow-ups, and Hoyt Bleakley (2007, 2010) for the historical comparison, for what disease control is worth to output per worker.